Written by Sig Silber
The crop production looks good but a tad less good than last week. We are not spending a lot of time on it in this report. The wildfire situation in Utah, Colorado, Arizona, and New Mexico is concerning especially if there is a late start to the Monsoon. We have a new seasonal drought outlook. I have included some slides from an interesting presentation on the interaction between agriculture and pollution. As usual, we provide a 28-day weather forecast where the first 14 days update daily.

Please share this article – Go to the very top of the page, right-hand side, for social media buttons. Please feel free to send this article to anyone who you think might benefit from reading it.
Directory
Readers can scan through this article or jump to where they want to go via the links to the right. Directory links are under construction. Check future weeks for completion. |
|
Special Topics for this Week
New Drought Forecast.
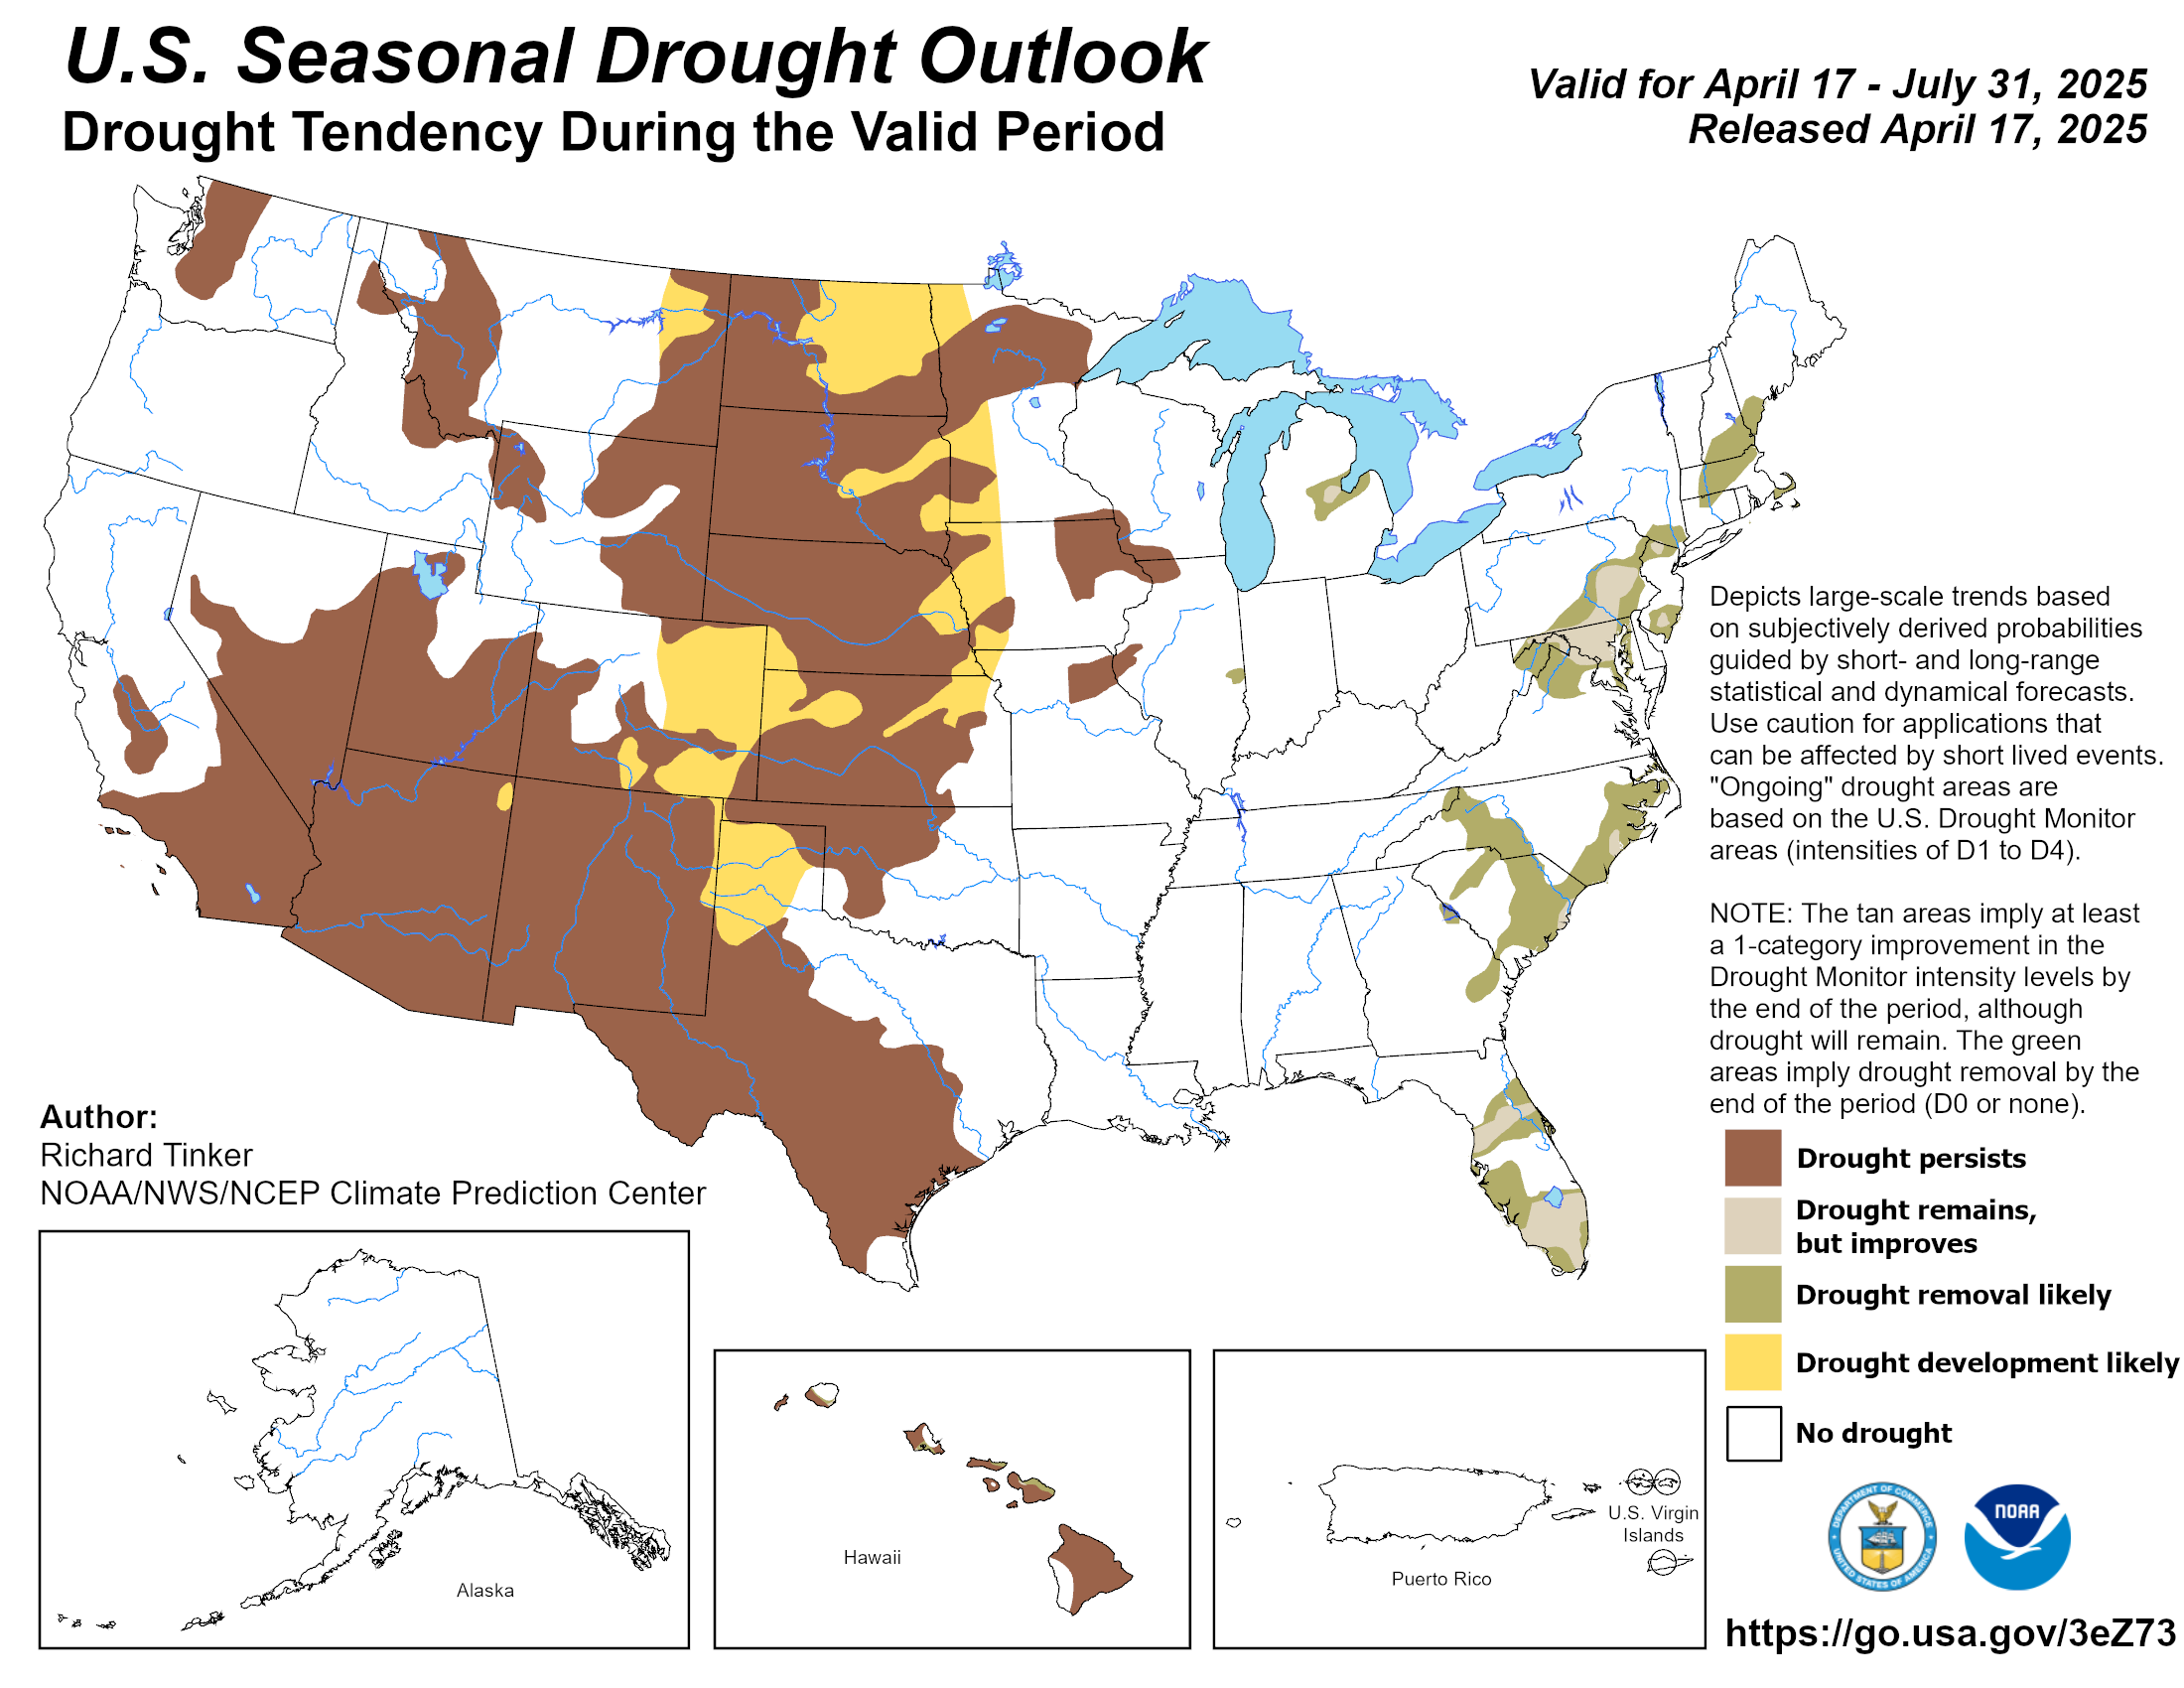

I do not have to turn this into a presentation but you can read the full presentation here. There are not a lot of surprises.
Pollution and Agriculture and Vice Versa
Selected Slides from an Interesting Presentation on the interaction between Agriculture and Pollution and Vice Versa Pollution and Agriculture and the impact on Climate Change is inherent in some of this. It was a Metastudy i.e. a literature review. I know I did not do it justice since I select a dozen from 44 slides and there is no audio. But it is a topic that is not usually discussed so I thought I would provide a snapshot of the presentation. It has not been written up yet so I do not have a URL to share but there will be one in the future.


Water Supply Issues


It is also useful to look at the last seven days.

Here is a side by side comparison
 |  |
This is an up to date map of snow depth. It is up-to-date when published but it does not auto-update but you can obtain updates Here.

We show a different version of this later but now it becomes really important as it


Current Drought Conditions
Now we take a look at Thursday’s U.S. Drought Monitor Report.
The U.S. Drought Monitor is a comprehensive way of understanding the drought situation for the U.S. It is issued every Thursday and reflects the conditions as of the prior Tuesday. Drought is defined as a moisture deficit bad enough to have social, environmental or economic effects. Thus, more factors than recent precipitation are considered and more information on how it is done is found at the end of this report.
U.S. Affiliated Pacific Islands and the U.S. Virgin Islands.

And this shows the U.S. including Alaska, Puerto Rico, and Hawaii.

Below is the map for just CONUS.
 |
 |
| Last Week | This Week |
| |

Some might find this animation of twelve weeks of change useful;

The graphic below shows the one-week change in drought intensity. Yellow is bad. Green is good.
|

Now we show the week to week change information by region. The yellow is where the level of drought has been raised. The green is where the level of drought has been lowered.
 |
A mixed pattern but mostly degradation |
 |
| Degradation the northwest part of this region. |
 |
Some degradation in upstate NY. |
 |
Improvement in the south and some degradation in Oklahoma and the Texas Panhandle. |
 |
Degradation in northern Florida and improvement in extreme south Florida. |
 |
| Here is where it has been dry. But not as dry as last week. |
Here is the Discussion that was issued with the Drought Report. The Regional Headings can be clicked on to obtain maps and statistics.
This Week’s Drought Summary
The southern Plains, Mississippi Valley, Pacific coast and south Florida were the recipients of the greatest rains this week, with some areas of Louisiana and south Florida recording 5+ inches of rain for the week. Dryness over the East and West was also coupled with warmer than normal temperatures over the West. Temperatures were 3-6 degrees above normal over the Nevada, Utah, Colorado and New Mexico regions while the northern Plains was 6-9 degrees below normal. Many dry areas of the Plains and Midwest have not had drought development due to the unseasonably cool temperatures in May.
Northeast
Cooler than normal temperatures dominated the region, with most areas at least 2-4 degrees below normal for the week and the northernmost portions of the region 6-8 degrees below normal. Precipitation was mixed for the week, with the southern areas remaining dry while portions of the northern areas of the region recorded normal to slightly above normal precipitation. Ongoing dryness in portions of northeastern New York did allow for the introduction of D0 this week, which was based upon the short-term indicators.
Southeast
For the region as a whole, the week was mostly dry. Spotty precipitation throughout the area did bring near-normal precipitation with it, but those who missed out were mainly dry for the week. Portions of southern Mississippi, southern Florida, and the panhandle of Florida did see 200+ percent of normal precipitation. Temperatures were cooler than normal over most of the area with most locations right at normal to 3-6 degrees below normal for the week. Due to the significant rains in south Florida, a full category improvement was made as the short-term dryness has been improved upon greatly over the last several weeks. The drought area of central Florida was split from that of southern Florida where lingering abnormally dry conditions were eliminated. With dryness over the last several weeks, abnormally dry conditions again returned to northern Florida into southern Georgia. In the panhandle region, abnormally dry conditions and moderate drought were expanded northward in response to short-term dryness. The dryness gradient remained in place over portions of southern Mississippi and southern Alabama with the severe drought areas pushing slightly northward this week. The areas of the region with sandier soils with lower capacity to hold moisture are in need of precipitation to stave off a widespread expansion of abnormally dry conditions. The cooler temperatures have lessened demand, but that can change rapidly in this region.
Midwest
Cooler than normal conditions again dominated the region with temperatures 2-4 degrees below normal in the southern portions of the area and 4-6 degrees below normal in the north. A slow-moving storm system affected the eastern areas of the region, with many areas recording 2-3 inches of rain with locally greater amounts. There are several dry pockets in the region, and areas of Wisconsin, Minnesota and northeast Iowa all had abnormally dry conditions expand this week due to the dryness over the short-term. Abnormally dry conditions were also expanded over southeast Iowa and into northwest Missouri. The lack of above-normal temperatures has kept drought from developing, but conditions are being monitored.
High Plains
Temperatures over the region were generally 6-8 degrees below normal, with portions of Colorado and Wyoming the outliers with temperatures 2-4 degrees above normal. Most of the region was fairly dry for the week with many areas below normal for precipitation during one of the wettest months of the year. Portions of western South Dakota, western Nebraska, northeast Colorado, and southeast Kansas did record precipitation that was well above normal with 150-400 percent of normal for the week. With the dryness throughout much of the area, abnormally dry conditions were expanded and moderate drought was introduced to portions of western North Dakota and into South Dakota. Abnormally dry conditions were expanded through central and southeast Nebraska and portions of northeast Kansas. These areas will be ripe for drought development without rain, especially if temperatures become more seasonable. Northeast Colorado did see some improvement due to recent heavy rains as the severe and moderate drought as well as the abnormally dry conditions shifted south slightly. The abnormally dry pocket in southeast South Dakota was also removed this week after some locally heavy rain.
South
Temperatures over the region were near normal to slightly below normal where the most precipitation took place. Areas of west Texas were 3-6 degrees above normal for the week. It was an active week over much of the region for precipitation, which allowed for improvements over much of the area. Most of southern, central, and eastern Texas as well as southern Louisiana had a full category improvement as these areas recorded the greatest precipitation, which shifted the drought indices, allowing improvement to take place. Some areas of southern Louisiana had 10+ inches of radar-estimated rainfall. Areas of the Texas and Oklahoma panhandles, west Texas, and southwest Oklahoma did not receive any of this rain and conditions continued to deteriorate. Portions of western Oklahoma have had all winter wheat zeroed out as producers did not get a crop to grow and did not even see enough growth for grazing purposes. In southwest Oklahoma, moderate drought and abnormally dry conditions expanded this week. Some areas of the Texas panhandle did see improvements to the abnormally dry conditions while other areas missed out on the rain and saw conditions decline. Abnormally dry conditions were also expanded over west Texas this week.
West
Most of the region was dry for the week with the exception of the Pacific Northwest and northern California, where 150-200 percent of normal precipitation was recorded. Temperatures for the region were 3-6 degrees above normal over central Nevada, Utah, Colorado, and eastern New Mexico, with most of the rest of the region near normal to 3 degrees below normal for the week. In the Pacific Northwest, the recent rains helped to slow down further degradation in Oregon and Washington, with portions of the abnormally dry areas of western Washington improved this week. Oregon has some improvement to the severe and extreme drought over the southwest portions of the state but did see moderate drought expand slightly over portions of the western areas of the state. Conditions in Nevada and Utah continue to decline with an intensification of moderate and severe drought over northern portions of both states as the short-term dryness is starting to combine with the long-term issues in these areas. New Mexico had an expansion of moderate, severe, and extreme drought in the northern portions of the state as some of the recent dryness is coupled with longer-term issues in the drought indicators. Abnormally dry conditions were expanded over most of eastern New Mexico as a result of short-term issues. Southwest Colorado had an expansion of extreme and severe drought conditions while moderate drought was expanded northward over the central portion of the state.
Alaska, Hawaii, and Puerto Rico
Hawaii has been dry recently, which allowed the expansion and introduction of abnormally dry conditions over most of the state. On Kauai, abnormally dry conditions were added to the southern half of the island. In Oahu, abnormally dry conditions were expanded to cover the southwestern half of the island. Abnormally dry conditions were expanded to cover the rest of Maui and the Big Island. On Molokai, moderate drought was expanded eastward to Kaunakakai and on the Big Island, moderate drought was pushed to the east to include the leeward slope of the Kohala Mountains and south to Waikoloa. In Puerto Rico, abnormally dry conditions were expanded to the north with a new area introduced in the northeast part of the island. With short-term dryness impacting the southern portions of the island, a new area of moderate drought was added this week. No changes were made in Alaska this week.
Pacific Islands
The weather conditions across the U.S.-Affiliated Pacific Islands (USAPI) during this USDM week (5/13/20-5/19/20) were dominated by trade winds in Micronesia and a relatively stable and dry air mass over American Samoa. In Micronesia, the trade-wind regime brought dry weather to the northern latitudes. In the southern latitudes, faster trade winds overcame slower winds, with the resulting trade-wind convergence generating showers. The trade-wind convergence was accompanied by surface troughs, with the surface features interacting with upper-level divergence associated with a couple upper-level lows. The Marianas were mostly dominated by the dry trade-wind regime, except surface troughs and a weak tropical disturbance brushed southern parts, primarily Guam. A surface trough took up residence southwest of the Samoan Islands. Even though a dry and stable air mass dominated American Samoa, some moisture advected from the trough was enhanced by orographic lifting to produce scattered precipitation.
Satellite-based estimates of 7-day precipitation (QPE) showed a broken band of 2+ inches of precipitation stretching across the Pacific between the equator and 10 degrees North latitude associated with the Inter-Tropical Convergence Zone (ITCZ). Another broken band stretched southeastward from Indonesia to southwest of the Samoan Islands as the South Pacific Convergence Zone (SPCZ). In Micronesia, the band meandered across the Federated States of Micronesia (FSM), stretching an arm toward Guam, and teasing parts of the Marshall Islands (RMI). The SPCZ was comprised of splotches of 1+ inches of rain around but mostly southwest of the Samoan Islands.
In the Republic of Palau, based on data through May 19, the Palau International Airport station reported 2.26 inches of rain this week (which is above the weekly minimum of 2 inches needed to meet most water needs) and the COOP station at Koror recorded 3.22 inches. The monthly totals were well above the 8-inch monthly minimum: 18.24 inches at the Palau IAP and 17.91 inches at Koror COOP. Jellyfish Lake continues to recover from the drought of a year ago. With April and May wet, D-Nothing continued at Palau.
This week was dry (below the 1-inch weekly minimum needed to meet most water needs) on Guam and very dry across the Commonwealth of the Northern Mariana Islands. Localized showers resulted in a range of rainfall reports, with the Guam airport recording 0.92 inch of rain for the week, while Tinian recorded 0.16 inch and Dededo 1.02 inches (with 2 days missing). Dryness was more widespread across the CNMI, with Rota recording 0.37 inch of rain, Saipan International Airport 0.28, Saipan ASOS station 0.21, and the NPS automated station on Saipan 0.11. Based on data received so far in May, the Saipan IAP had the driest May, April-May, March-May, February-May, and January-May in the 40-year record, but second wettest June-May (last 12 months). D3-SL continued for Saipan, D3-S continued at Rota, and D1-S continued for Guam.
In the Federated States of Micronesia, Fananu (which has been missing for several months) and Pingelap (missing this week) could not be analyzed and are not plotted. The week was dry at the western and southern stations in the FSM, but wet from central Yap State to Kosrae State. In the west, less than an inch of rain was reported at Yap (0.58) and Rumung (0.62), and less than an inch fell in the south at Kapingamarangi (0.44) and Lukonor (0.28). But well over 4 inches was recorded at Pohnpei (4.53) and Mwoakilloa (4.78), with over 2 inches at Chuuk (2.08) and Kosrae (3.31). In Yap State, Ulithi received 1.19 inches while Woleai got 2.85 inches.
The recent rain at Woleai has not improved conditions significantly. Impact reports received since last week’s analysis indicated that water catchment tanks were still less than half full and there was low available drinking water. Even though 8.91 inches of rain fell at Woleai so far in May, March-May 2020 still ranked as the 8th driest March-May on record, January-May ranked as the 7th driest, December-May as the 8th driest, and June-May as the 4th driest. The USDM status at Woleai was worsened back to D2-S based on this recent information. No other changes were made in the FSM. Reservoir water levels on Yap remain low. Although aquifer levels have shown some recovery from the recent rains, well levels in Eyeb Valley and Monguch Valley show a steady groundwater decline in the Tomil Volcanics Aquifer for at least the last 4 to 5 months. With January-May ranking as the 5th driest such period on record, D2-S continued at Yap. D1-S continued at Ulithi, D0-S continued at Chuuk where February-May ranked as the 5th driest, and D-Nothing continued at the rest of the stations. This week marked the second consecutive dry week (below the 2-inch weekly minimum needed to meet most water needs) at Kapingamarangi, and Nukuoro barely met the 2-inch minimum with 2.03 inches. Based on data so far, May 2020 ranked as the second driest May on record for Kapingamarangi and third driest for Nukuoro. December-May ranked 5th driest for Kapingamarangi and February-May ranked 6th driest for Nukuoro. The USDM status continued at D-Nothing for these two stations, but they will be watched for possible D0-S if the dryness continues, especially Kapingamarangi where only 2.88 inches of rain has been reported so far in May.
In the Marshall Islands, no data was received from Mili or Utirik this week so an analysis could not be made for these stations. Majuro was wet (more than the 8-inch monthly minimum needed to meet most water needs) in April (13.95 inches) and each of the last 4 weeks, and the reservoir level has risen to above the 80% threshold for concern. The May 19 reservoir level was 31.31 million gallons, which is 87% of the 36 million gallon maximum capacity, and most of the 1000- to 1500-gallon water catchments on the island were now in the range of 80-90% full. The rising reservoir levels have prompted the Majuro Water and Sewer Company to end water rationing from the Treatment Plant C and Laura Plant. As a result of these changes, the USDM status at Majuro was improved to D-Nothing. Jaluit was wet (3.66 inches) this week but the other stations were dry. With each of the last six months dry, the status at Wotje was changed from D3-S to D3-SL and the status at Kwajalein was changed from D1-S to D1-SL. No other changes were made in the RMI.
Localized convective/orographic showers in American Samoa caused a spread in rainfall totals, with 0.62 inch recorded this week at the Toa Ridge automated station, 2.00 inches at the Siufaga Ridge automated station, and 1.84 inches at Pago Pago. This brings the May monthly total at Pago Pago to 4.73 inches, which is above the 4-inch monthly minimum and continues a string of wet to very wet months. D-Nothing continues at Tutuila.
Virgin Islands
During this USDM week (5/13/20-5/19/20), weak ridging and a high zonal flow maintained dry and stable conditions at the upper-levels over the U.S. Virgin Islands (USVI) region. Surface high pressures over the western Atlantic and over the east-central Atlantic promoted an easterly surface wind flow with embedded patches of moisture.
Radar-based estimates of rainfall for the 7 days ending at 12z on Tuesday depicted half an inch or more of rain over parts of St. John and St. Thomas and across the western coast of St. Croix, with the rest of the islands receiving little to no rain.
Showers were scattered and localized on St. Croix, with 0.62 inch of rain falling this week at East Hill, but only 0.15 inch and 0.07 inch, respectively, at the CoCoRaHS stations at Christiansted 1.8 ESE and 4.1 ESE, 0.13 inch at the UVI Sheep Farm station, and 0.03 inch at the Rohlsen AP. May monthly totals (based on data received so far) ranged from 0.99 inch at East Hill and two-thirds of an inch (0.62) at the UVI Sheep Farm, to half an inch at Christiansted 1.8 ESE (0.54) and Rohlsen AP (0.52) and a third of an inch (0.32) at Christiansted 4.1 ESE. The May monthly normal precipitation for Rohlsen is 4.15 inches. Rohlsen has been drier than normal for each of the last seven weeks, with the April 1-May 19 total precipitation of 1.13 inches ranking 2020 as the sixth driest such period out of a 61-year record. This translates to the 10th percentile in the historical record, which is at the D2 USDM level. At the end of March, the year-to-date precipitation was 2.16 inches above normal; the year-to-date anomaly went negative in May, reaching 1.47 inches below normal on May 19. The Standardized Precipitation Index (SPI) values for the Rohlsen/Hamilton Airport and East Hill stations changed little compared to last week. East Hill SPI is at D0 levels for the last 1, 9, and 12 months, but the Rohlsen AP SPI values are at the D1 level for the last 1 and 12 months, the D0 level at the 6-month time scale, and D3 level for the last 9 months. Current groundwater data is not available for the USGS Adventure 28 well; the latest data is through April 25, 2020, but it was in steady decline for a month to that point. The USDM status was worsened to D1-SL for St. Croix.
On St. Thomas, a third of an inch (0.38) of rain was reported by the CoCoRaHS station at Anna’s Retreat this week, bringing the monthly total to 0.61 inch. But only a trace of rain has fallen at the King AP for all of May so far. The May monthly normal for King AP is 3.06 inches. With 0.92 inch in April, this ranks April 1-May 19, 2020 at the airport as the third driest such period out of 57 years of data. This translates to the 5th percentile in the historical record, which is at the D3 USDM level. At the end of March, the year-to-date precipitation was 2.32 inches above normal; the year-to-date anomaly went negative in May, reaching 1.52 inches below normal on May 19. The SPI at King AP was at the D0 level for the last 3 and 9 months, but at the D3 level for the last month. The USGS Grade School 3 well level has been steadily declining since the end of March, and is now the lowest it’s been since the end of August 2019. The USDM status was worsened to D1-S for St. Thomas.
On St. John, the station at Windswept Beach reported 0.61 inch of rain this week, bringing the May total (through the 18th) to 1.11 inches. The long-term average for May is 4.54 inches. Dividing by 4 gives a long-term weekly average of about 1.14 inches. Based on these statistics, this week marks the eighth consecutive week with below-average precipitation for Windswept Beach. The SPI is at the D0 level for the last month, but at the D1 level for the last 3 and 9 months. The USGS Susannaberg well level has been steadily declining since the end of January, and is now the lowest it’s been since August 2019. As a consequence of the precipitation and groundwater data, the USDM status for St. John was worsened to D1-S.
Looking Ahead
Over the next 5-7 days, it is anticipated that the Plains states will remain in an active pattern, with the greatest precipitation to occur over portions of Nebraska, Kansas, Oklahoma and into Texas. The Mid-Atlantic is also anticipating precipitation amounts of up to 3-4 inches during the period. Dry conditions will dominate the Southwest and into most of the Pacific Northwest and West Coast. Temperatures during this period will be near normal over most of the country with below-normal temperatures over the Northwest and northern Rocky Mountains. Areas that receive the most rain will also have the coolest temperatures over the Mid-Atlantic into the Northeast.
The 6-10 day outlooks show a high probability of greater than normal temperatures over the West, northern Plains, Midwest, Northeast and Alaska. The greatest probabilities are over the Southwest. There are also high probabilities of cooler than normal temperatures over the southern Plains and into the South. The precipitation outlook has the northern Plains and Pacific Northwest with the greatest likelihood of below-normal precipitation. The best chances of above-normal precipitation will be over the South and Southeast but may also include the Midwest and Southwest.
And shifting to the Alaska and CONUS Intermediate-Term Weather Forecast (it is somewhat redundant with the Visual Consistency Analysis presented earlier but if I remove it, I may forget to put it back in next week).
 |
|
|
|


And then Precipitation
|
|
|


The week 3-4 temperature outlook calls for elevated probabilities for above normal temperatures over all of Alaska during the week 3-4 period, with greater probabilities over the northern regions of the state exceeding 60 percent, under predominantly above normal mid-level heights. Above normal temperatures are also likely for most of the western CONUS under a predicted ridge in most model forecasts. Probabilities exceed 60 percent in much of the Southwest region, where positive decadal temperature trends are greatest, while lower probabilities for above normal temperatures are indicated over the Pacific Northwest, where there is greater spread among dynamical model forecasts, possibly related to the impacts of the MJO. Below normal temperatures are favored over parts of the Northern Rockies and Northern Plains, under lower mid-level heights in most model forecasts and moderated by likely cloudy conditions. An area of equal chances of above and below normal temperatures extends through the Great Plains region to the western Gulf Coast, where mid-level height anomalies are weaker in model forecasts and variability in the predicted pattern increases uncertainty for the week 3-4 period averages. Probabilities of above normal temperatures increase across the eastern CONUS from the Mississippi Valley to the Atlantic Coast, under predominantly positive 500-hPa height anomalies, with greater probabilities over the Southeast with a predicted northward flow of warm moist air and over the Northeast, under predicted larger positive 500-hPa height anomalies. Dynamical model forecasts predict elevated probabilities of above normal temperatures across the Hawaiian Islands during the week 3-4 period with continued positive sea surface temperature anomalies.
The week 3-4 precipitation outlook calls for elevated probabilities for above median precipitation along the southern coastal region of Alaska, including the Alaska Panhandle, extending into the Northern Rockies and Northern Plains, where dynamical models indicate lower mid-level heights and the potential for storminess during the period. Below median precipitation is likely for much of the Aleutians and the western Alaska mainland, under predicted positive 500-hPa height anomalies in most dynamical model forecasts and consistent with the impacts of the MJO. Below normal precipitation is indicated for most of the western CONUS, under a predicted ridge during the week 3-4 period, while equal chances is indicated for parts of the Pacific Northwest, where dynamical models show greater spread, and areas of the Southwest, which are climatologically likely to be dry. Above median precipitation is likely for much of the Gulf Coast and Southeast regions, as most models, such as many models of the SubX MME, indicate increased storm activity over the Gulf of Mexico during the week 3-4 period, consistent with the potential impacts of MJO. Below median precipitation is likely for the Northeast, under a predicted positive 500-hPa height anomaly. Dynamical model forecasts show a slight increase in the probabilities of above median precipitation for Hawaii during the week 3-4 period.
Some may find the below way of looking at things useful and I hope these graphics are not too small to read. I did not make them so you could click on them individually but you can click on the whole graphic and it may enlarge. But I think you get the picture. It has been a rapid onset and demise. When you read these graphics, remember that the older graphics are not the drought conditions that existed then but the change from then until now.

Let’s focus on the change between April 21, 2020 and May 19, 2020, i.e. one month.

Focusing on the Intermountain West

Drought Forecasts
These two forecasts (Monthly and Season) are issued by the same agency but to obtain them you need to access two different links here and here.
Here is the Three-Month Forecast which was issued on May 21, 2020

Here is the discussion released with the new map.
Tools used in the U.S. Seasonal Drought Outlook (SDO) include the Climate Prediction Center (CPC) temperature and precipitation outlooks for June 2020 and June-July-August (JJA) 2020, various short-range and medium-range forecasts and models, such as the 7-day quantitative precipitation forecast (QPF) totals from the Weather Prediction Center (WPC), the 6-10 day and 8-14 day CPC extended-range forecasts (ERFs), the Weeks 3-4 outlooks and tools from CPC, dynamical models at the monthly and seasonal time scales, climatology for the JJA season, snow cover, soil moisture, streamflow values, and initial conditions. ENSO-neutral conditions are favored to remain at least through boreal summer.
Across the Western states during the past 14-days, precipitation amounts ranged between 1.0-5.0 inches for the Cascades, the Coastal Ranges of the Pacific Northwest, the Sierras, and portions of the Rockies. Northern Nevada generally received 1-inch of precipitation or less. Some of the drier locations included parts of the Central Rockies, which saw precipitation amounts that ranged from zero up to a quarter-inch. As of May 17th, SNOTEL basin-averaged Snow Water Equivalent (SWE) was generally near to below average across the West (0-90 percent of average, the Sierras, Nevada, Arizona and New Mexico being on the low end), while the Northern and Central Rockies were in good conditions (90-164 percent of average).
Precipitation across the West during the upcoming week is predicted to be light (less than 0.5-inch) for the valleys and lower elevations, with orographic enhancement leading to somewhat higher amounts (0.5-2.0 inch) for the mountainous regions. Little to no precipitation is expected in California, Arizona, New Mexico, or to the lee of the Cascades in Washington and Oregon. During week-2, below normal precipitation is favored for most of the northwestern US, and near to above normal precipitation is forecast across parts of the Southwest. CPC’s June and JJA precipitation outlooks favor below normal precipitation for most of the northwestern areas and Equal Chances (EC) for the remaining West. This is consistent with the onset of the dry season across most of the West starting in May, and with the climatological onset of the monsoon in late June/early July. Therefore, drought persistence is indicated for the current drought areas depicted across the West. In addition, warm, dry conditions anticipated in JJA support new drought development for adjacent areas of this region, such as northeastern Nevada eastward into northern Utah, western Oregon, central and southwestern Idaho, and parts of Washington state.
Forecast confidence for the West is moderate to high.
During the past 14-days over the High Plains region, moderate precipitation (0.1-2.0 inches) fell across most of the Northern Plains. Departure from Normal Precipitation (DNP) over the past two weeks ranged from 1-3 inch deficits in most areas. Up to two inches of precipitation is predicted across the region during the next week, with slightly more possible in eastern Kansas. CPC extended range forecasts (6-10 days and Week-2) predicted below normal precipitation over the region. The June, and JJA precipitation outlooks from CPC all favor above normal precipitation in the eastern parts of this region, but near to below normal precipitation in most remainding areas. Generally all range forecasts predict near to above normal surface temperatures for the next three months. Given a wet JJA climatology but overall above normal temperatures and below normal precipitation outlooks, drought persistence is predicted at this time. However, this region is prone to flash droughts, which by definition develop quickly, and will need to be monitored in the weeks and months ahead.
Forecast confidence for the High Plains region is moderate.
Moderate to high precipitation (0.1-4.0 inches) fell across the Midwestern states over the past two weeks, with 4-7 inch totals (locally greater) observed in northern Illinois, Michigan and Ohio. This resulted in rainfall surpluses of 3-6 inches in these three states. In contrast, rainfall deficits of 1-3 inches were noted over much of the Upper and Middle Mississippi Valley. Soil moisture anomaly change over the past two weeks reveals soil moisture values have diminished by 0.5-3 inches over parts of the Midwest.
During Week-1, northern portions of the Midwest are forecast to receive little precipitation. Southwestern and southeastern portions of the Midwest, however, are predicted to receive up to 1.0-2.0 inches of precipitation. Above normal temperatures and above normal precipitation (albeit with modest probabilities) are favored over the Midwest during the Week-2 period. CPC’s 30- and 90-day outlooks favor near to above normal rainfall. As was the case with the High Plains region, given favorable precipitation outlooks and JJA climatology, there is little reason to go with developing drought at this time. However, this region is also prone to rapidly-developing flash drought, and will need to be under careful surveillance in the weeks and months ahead.
Forecast confidence for the Midwest is moderate.
Across the South, precipitation totals (0.1-10 inches) were observed over the last 14-days from western Texas generally northeastward across the Arklatex region, most of Arkansas and Tennessee, and the northern half of Mississippi. This wet period is attributed to plentiful low-level Gulf moisture, active baroclinic zones, mid-level disturbances, and severe weather. In contrast, less than a half inch of rain fell across western and northern Oklahoma, and West Texas. Remaining areas of the South saw rainfall totals in the moderate range with the highest rainfall in southeastern Louisiana. During the past two weeks, 1-3 inch rainfall deficits were noted in north-western Oklahoma and Texas, and parts of eastern Texas.
A review of precipitation outlooks for time periods of one-week to one-season in advance shows that all agree on the more significant precipitation amounts falling over eastern and central portions of the Southern region, with little to none across western Texas. Based on the various rainfall outlooks and favorable climatology, the current drought areas in the Southern Region are expected to either improve or be removed, while drought persistence is predicted in western Texas.
Forecast confidence is considered moderate across the South.
Precipitation amounts generally ranged from 0-10 inches over the region during the past 14-days. Most areas reported 0.0-3.0 inch rainfall deficits. The only place that observed more than 3.0-6.0 inch rainfall surpluses was parts of southern Florida and the Carolinas.
Nearly all outlooks, from one week to one season in advance, favor at least a slight tilt in the odds towards above normal precipitation across the Southeast. Given these official outlooks, and the climatological onset of Florida’s rainy season, drought removal is favored for the Florida Peninsula, and one-category improvement is forecast for the remaining region, meaning either improvement or removal of drought areas for the Southeast.
Forecast confidence is moderate to high across the Southeast.
In the Northeast region, 0-4 inches of precipitation fell from the Central Appalachians northeastward across eastern Pennsylvania, New Jersey, Long Island, and New England. Two-week precipitation surpluses ranged from 0.5 to (locally) 3.0 inches and were reported over western New York and northwestern Pennsylvania, while the remaining areas reported 0-3 inches rainfall deficits.
Up to an inch of precipitation is forecast for the southern Northeast during Week-1. Near to below normal precipitation is predicted for Week-2. EC is forecast for the month of June. For the JJA season, odds favor above normal precipitation for the southern Northeast Region, and EC is most likely for the northern Northeast. At this time, there is little evidence to support significant areas of drought development across the region.
Forecast confidence is moderate.
Hawaii: With the day season starting for the Hawaiian archipelago, it becomes increasingly difficult to reduce or eliminate remaining drought. CPC outlooks valid for June and JJA favor above normal temperatures and below normal precipitation. Therefore, new drought development or persistence of existing drought is favored in most of the leeward areas in the state (except the Kona region, which has its wet season during the summertime).
Forecast confidence for Hawaii: moderate to high
There is no drought at this time in Alaska. In Alaska, there are mixed climate signals out through the seasonal period (JJA). For the shorter-term (Week-2), near to above normal precipitation is forecast across the state. The June and JJA outlooks tilts the odds towards near to above normal precipitation for the state. Given the climatology and outlooks over relevant time periods, there is no clear reason to favor drought development in JJA.
Forecast confidence is moderate for Alaska.
For Puerto Rico, although the climatology becomes increasingly wet during June and JJA, the NMME forecasts favor the existing drought to persist over the region.
Forecast confidence is moderate for Puerto Rico.
Here is the Monthly Drought Outlook which was updated on April 30, 2020. (We discussed this in the Special Topics Section of tonight’s Report).

Floods
Floods remain a concern.

| Last Week | Current Week |
| |


Wildfires
Our usual graphic is not updating so we have deleted it. Bu updates from this source can be found here.
Current Wildfire Risk. This is a new model that updates daily by NOAA (but not automatically in this article) to show the short-term risk.

Click here to update. Red is high risk, blue is low risk. This graphic updates daily but you have to click on the link provided to get the updates More information can be found here.
This explains the model a bit.

The below graphics are monthly risk estimates for Wildland Fire Potential. They update monthly.

Looking out another month.


Surface soil conditions
 |
 |
Subsurface Soil Conditions
 |
 |
Here is another way of looking at it.

Crop and Animal Husbandry Progress.
USDA Executive Briefings can be found here NASS reports can be found here. Foreign Intelligence reports can be found here.
There were a lot of NASS reports this week and we did not have time to prepare them all for publication. This shows the major reports scheduled. Most are NASS Reports.

 |
 |
 |
 |
| Crop | Production Stage | Better or Worse than Last Year, 5- year Average, and considering crop condition. (Better than last year may not be good enough given the very slow start last year). |
| Corn | Planted and Emerged | Good to Very Good |
| Soybeans | Planted | Very Good |
| Cotton | Planted | Good |
| Rice | Planted and Emerged | Improved over last year but slower than five-year average. |
| Sorghum | Planted | Improved over last year but slower than five-year average. |
| Peanuts | Planted | Slow |
| Sugar Beets | Planted | Slow |
Sunflowers | Planted | Slow |
| Winter Wheat | Headed | Improved over last year but below five-year average. Condition a problem. |
| Oats | Planted and Emerged | Good |
| Spring Wheat | Planted and Emerged | Improved over last year but slower than five-year average. |
| Barley | Planted and Emerged | Improved over last year but slower than five-year average. |
| Pasture and Range | Condition | Not as good as last year |
International

A map helps and is not always available and fortunately, it was available this week.

Major Sources of Information
In the box are shown the major resources we use. We will not be using them all each week but the reader is welcome to refer to these resources.
Major Sources of Information Used in this Weekly Report
|
Background Information


The sequence of drought occurrence and impacts for commonly accepted drought types. All droughts originate from a deficiency of precipitation or meteorological drought but other types of drought and impacts cascade from this deficiency. (Source: NDMC)
Source: National Drought Mitigation Center, University of Nebraska-Lincoln
.floo


