Written by Sig Silber
Our research on the meat distribution chain continues but we are not ready to report our findings as the situation is more complex than some believe. We have information on other agriculture distribution networks and have not had the time to explore them. But we believe that one needs to look at the subject broadly. So we are reporting tonight on the expansion of corn production in Argentina as increased food production with a World population that may be reduced by 5% to 10% due to COVID-19 might create a lot of different problems. We have begun to provide the expanded U.S. crop reports and they are looking good so far.

And of course, we have our full set of regular weekly reports that focus on the latest NIDIS Drought Report which together with the May weather forecast suggests that for most of CONUS, drought remains close to minimal. We provide a 28-day weather forecast where the first 14 days update daily. We also took a second look at the May forecast which we reported on last night.
Please share this article – Go to the very top of the page, right-hand side, for social media buttons. Please feel free to send this article to anyone who you think might benefit from reading it.
Directory
Readers can scan through this article or jump to where they want to go via the links to the right. Directory links are under construction. Check future weeks for completion. |
|
Special Topics for this Week
We are going to start by reviewing the May Forecast as we did not have the Week 3- 4 forecast at that time as we wanted to publish the new forecast on the day it was released.
Here is the summary of the forecast
| April 16, 2020 Forecast for May 2020 | April 30, 2020, Forecast for May | |
| Temperature |
|
|
| Precipitation |
|
|


And here is the visual consistency analysis that we issued yesterday but now with the updated week 3 – 4 Forecast and updated commentary.
Visual Consistency Testing.
It is useful to see how the full-month forecast fits with the set of partial-month forecasts that we have. These will continue to update in this article. It is important to remember that with the partial-month forecasts, we generally have about 25 days of the subsequent month to look at when we do this at the end of the month as we are doing now. It depends on what day of the week the month ends. So this month, which ended on a Thursday, we were missing a forecast that included the last nine days of the month. But we now have that.
First Temperature
 |  |  |  |
| The new monthly forecast is to the right. Does it appear to be reflective of the four parts of the month for which we have forecasts? → |
| ↑ ← The Week 3 – 4 forecast was updated Friday, May 1, 2020. At this point, we have forecasts for 29 days of the 31 days in May and the fit looks pretty good. | |
And Precipitation
 |  |  |  |
The new monthly forecast is to the right. Does it appear to be reflective of the four parts of the month for which we have forecasts? → |
| ↑ ←The Week 3 – 4 forecast was updated on Friday, May 1, 2020. At this point, we have forecasts for 29 days of the 31 days in May and the fit looks pretty good. | |
Here is the new Week 3 – 4 Discussion
Prognostic Discussion for Week 3-4 Temperature and Experimental Precipitation Outlooks NWS Climate Prediction Center College Park MD 300PM EDT Fri May 01 2020
Week 3-4 Forecast Discussion Valid Sat May 16 2020-Fri May 29 2020
The MJO is in RMM Phase 4 over the eastern Indian Ocean/western Maritime Continent and there are several other tropical waves including an equatorial Rossby wave colocated with the active MJO convection and a Kelvin wave that just recently passed the Maritime Continent. Unfortunately, these modes of variability are unlikely to enhance predictability on Weeks 3-4 timescales. The MJO’s impacts over the CONUS are statistically weak and insignificant during May, most likely due to the climatological reduction in the meridional baroclinicity throughout the Northern Hemisphere that occurs as the general circulation spins down on its way into its summer configuration. Basically, as the northwest temperature gradient weakens, the MJO’s ability to induce Rossby waves that traverse the hemisphere also weakens. Therefore, today’s forecast is based heavily on dynamical guidance, with the caveat that predictability is inherently low this time of year.
Our three calibrated dynamical models, the CFS, ECMWF, and JMA, all suggest a lower-amplitude pattern over North America during Weeks 3-4 than exists right now and likely to continue through early May. There is good model agreement regarding above normal heights over Alaska. Broadly, the 500-hPa height pattern over North America is expected to feature positive anomalies over the Western U.S. and negative anomalies over the Great Lakes and Northeast. This translates to good agreement in above normal temperatures throughout Alaska and the Western CONUS, especially over the Southwest during Week 3. A slight tilt towards below normal temperatures over the Great Lakes and Northeast is also forecast, although these probabilities are capped at 55-60% over Michigan and northern New York. The ECMWF is the most aggressively cold model and extends the area of below normal temperatures nearly to the Gulf Coast, but there isn’t enough support from other tools to justify such a forecast.
This week’s precipitation forecast is unusual because of such good agreement among the ECMWF, JMA, and SubX models. A slight tilt towards above normal precipitation is forecast throughout the Southeast, a signal which is equally strong in the models during both Weeks 3 and 4. There are hints, especially in the JMA, that the above normal rainfall could creep northward into the Plains or Midwest, but those hints aren’t strong enough to alter the forecast. We are also forecasting below normal precipitation throughout the Northwest and most of Alaska. It is possible that with this kind of pattern, parts of Northern California could find themselves especially warm and dry during the second half of May.
Positive sea surface temperature anomalies continue from last week, and support increased chances of above normal temperatures throughout the Hawaiian Islands. Model guidance supports slightly elevated probabilities of below normal precipitation for Hawaii given the generally above normal heights throughout the region.
Drought Forecast.
We presented this graphic yesterday but with the long explanation. Tonight we present it again but with the short explanation. Sometimes the short explanation is easier to follow.
And with respect to drought, this was also issued on April 30, 2020.

This map shows the updated May part of what has been previously forecast for the three-month period.
It shows mostly improvement for the drought for the Gulf Coast but a shift in the forecast for degradation in the Northwest to parts of the Great Plains.
Here is the discussion issued with the new drought forecast. There is a long format and a short format and tonight we are providing the short-format discussion.
Latest Seasonal Assessment – As the rainy season draws to a close for the western contiguous U.S., the most likely outcome is for current drought to persist. There is also the potential for new drought development in the Pacific Northwest and Northern Intermountain Region, the Sierras in California, and northwestern Nevada. This is associated with well below normal precipitation since the beginning of the Water Year (Oct 1, 2019) and the expectation of warm, dry conditions in MJJ. Drought removal is favored in eastern Colorado, with the expectation of a continuing wet April and a favorably wet MJJ climatology. For the areas of drought near the Gulf Coast, nearly all official precipitation outlooks from one week to one season in advance favor at least a one-category improvement in drought conditions, resulting in drought removal for most areas. In contrast with the West, the state of Florida is nearing the end of its dry season, which typically transitions to its wet season in May and very early June. Elsewhere across the Lower 48 states, no broad-scale areas of drought are expected to develop. In Hawaii, the rainy season is nearing its end, which will make it much more difficult to mitigate any remaining drought. Therefore drought persistence is the most likely outcome. There is no drought at the current time in either Alaska or Puerto Rico, and there are no convincing indications to the contrary for the May-July season.
Meatpacking Antitrust

A somewhat related topics is food production around the World. Tonight we look at Argentina.


Water Supply Issues

It is also useful to look at the last seven days.

Here is a side by side comparison
 | |
This is an up to date map of snow depth. It is up-to-date when published but it does not auto-update but you can obtain updates Here.

We show a different version of this later but not it becomes really important as it


Current Drought Conditions
Now we take a look at Thursday’s U.S. Drought Monitor Report.
The U.S. Drought Monitor is a comprehensive way of understanding the drought situation for the U.S. It is issued every Thursday and reflects the conditions as of the prior Tuesday. Drought is defined as a moisture deficit bad enough to have social, environmental or economic effects. Thus, more factors than recent precipitation are considered and more information on how it is done is found at the end of this report.
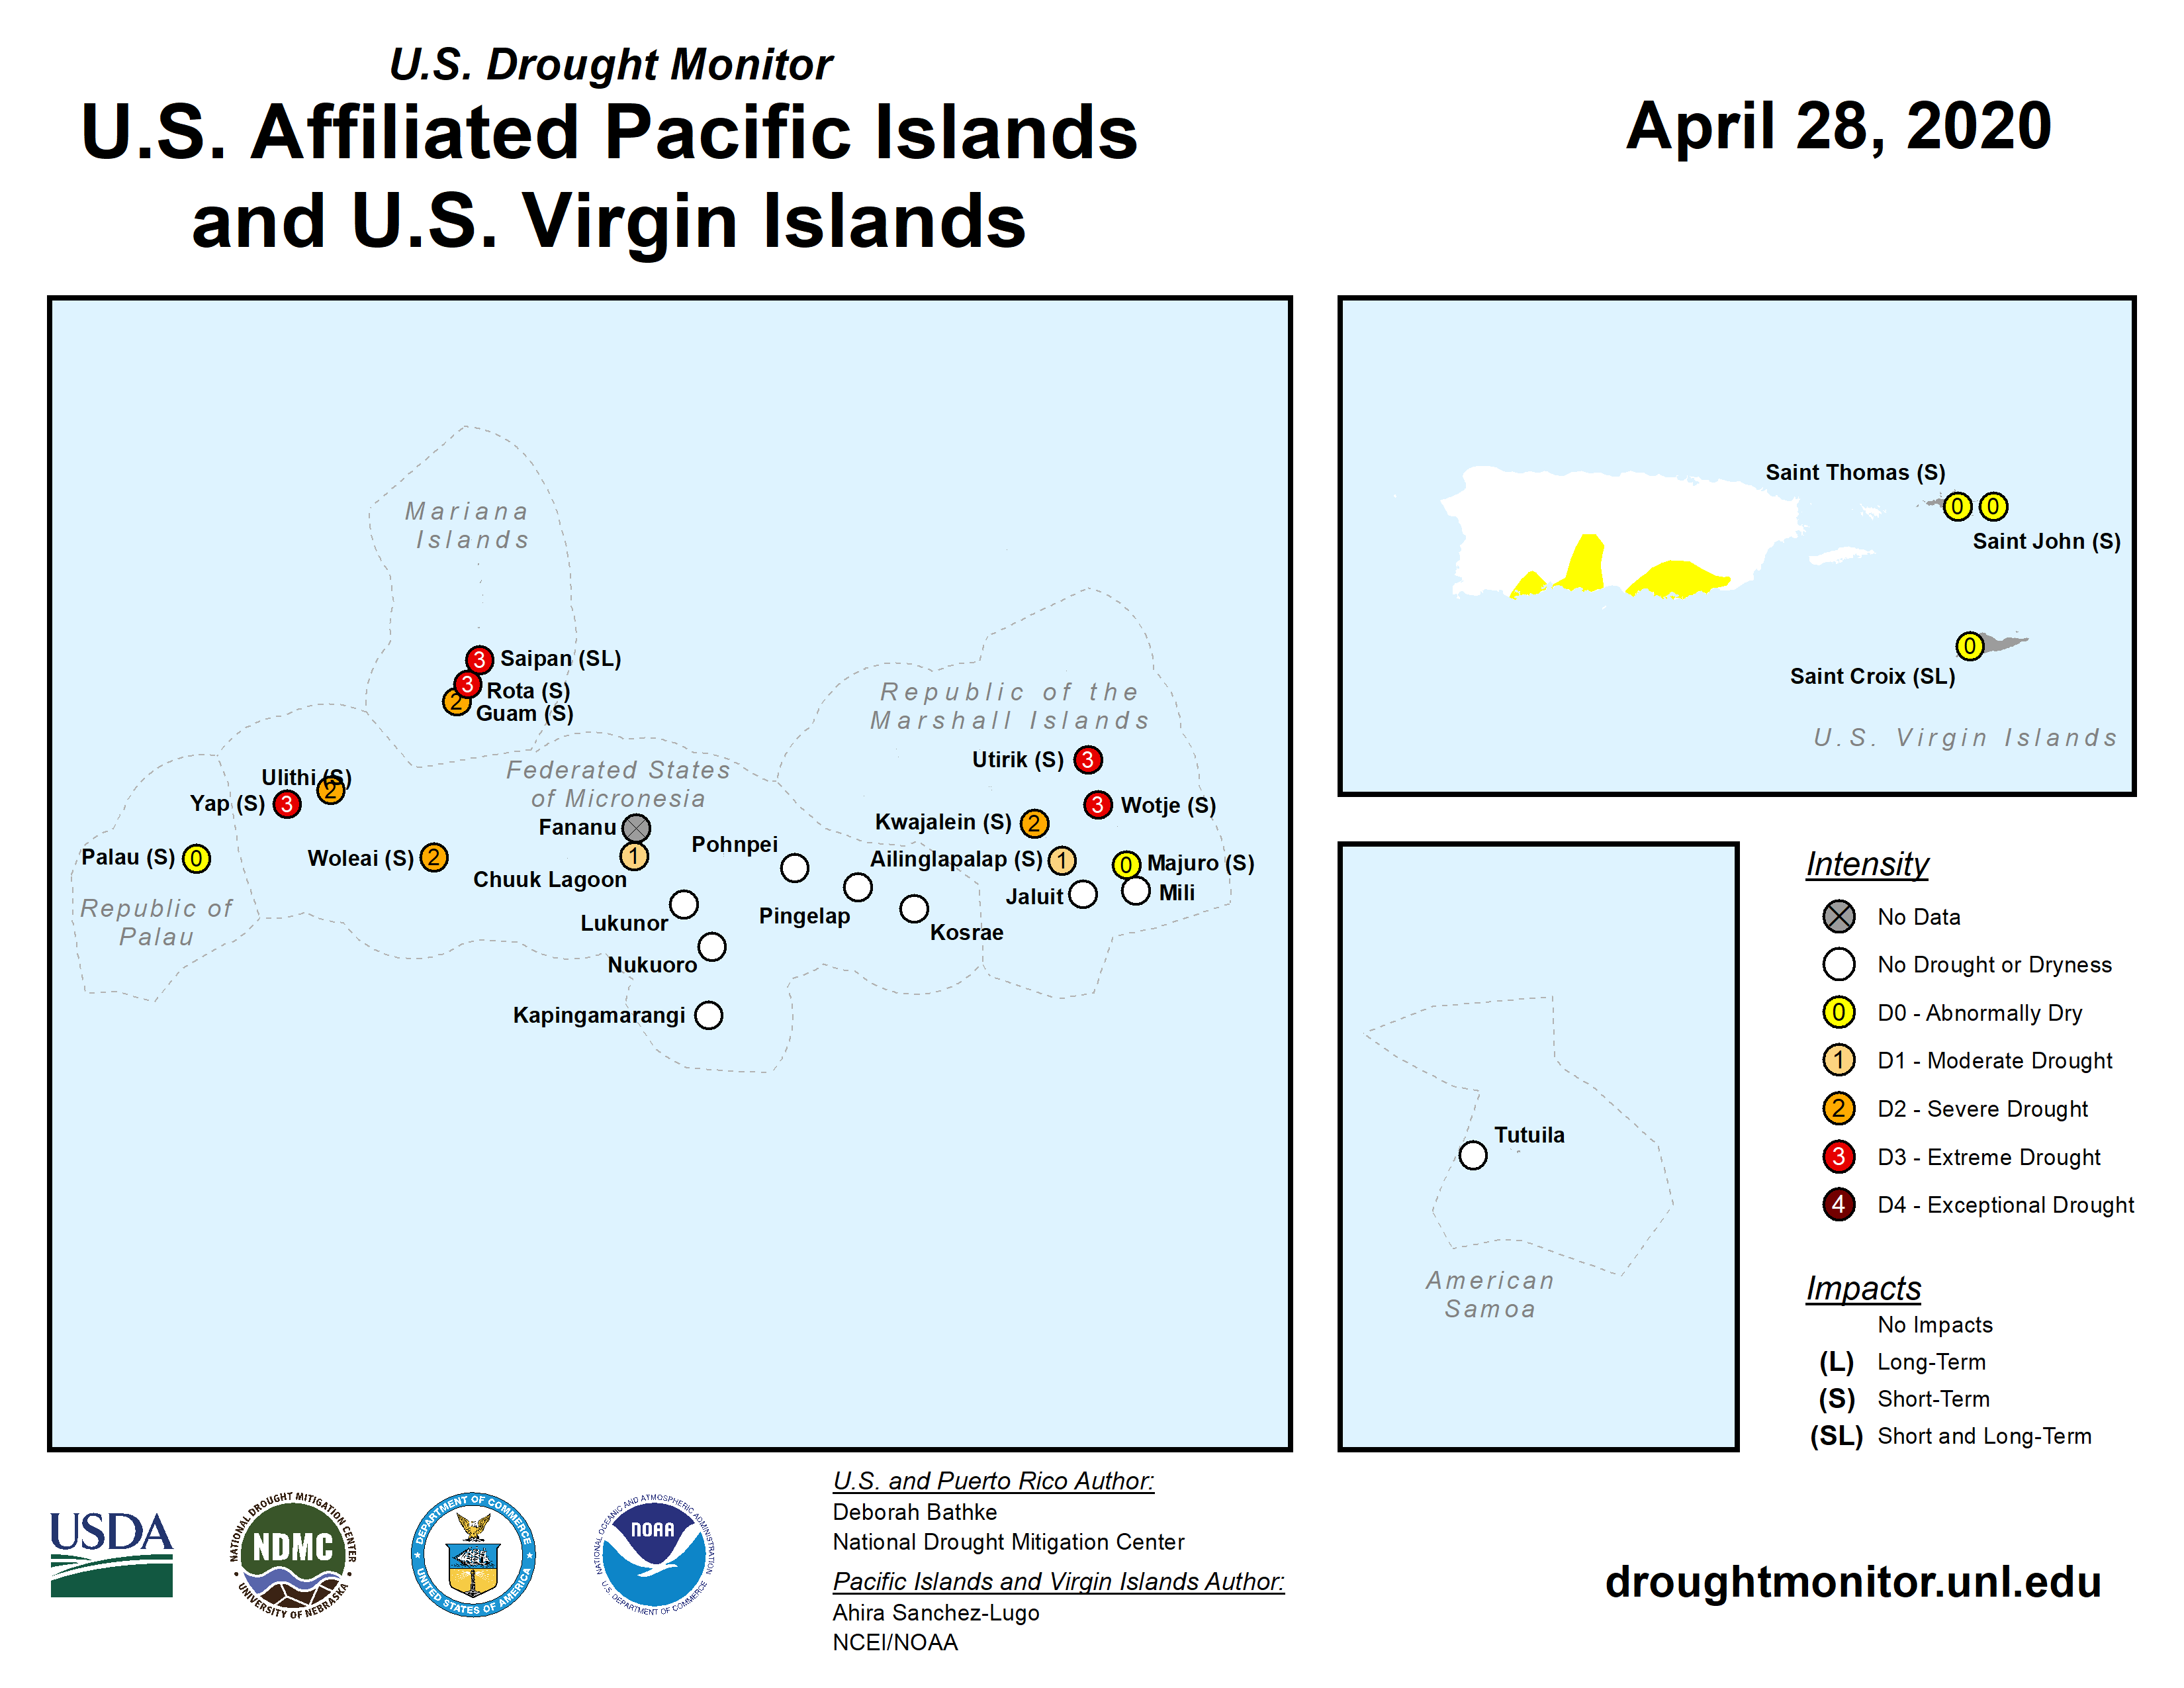
U.S. Affiliated Pacific Islands and the U.S. Virgin Islands.
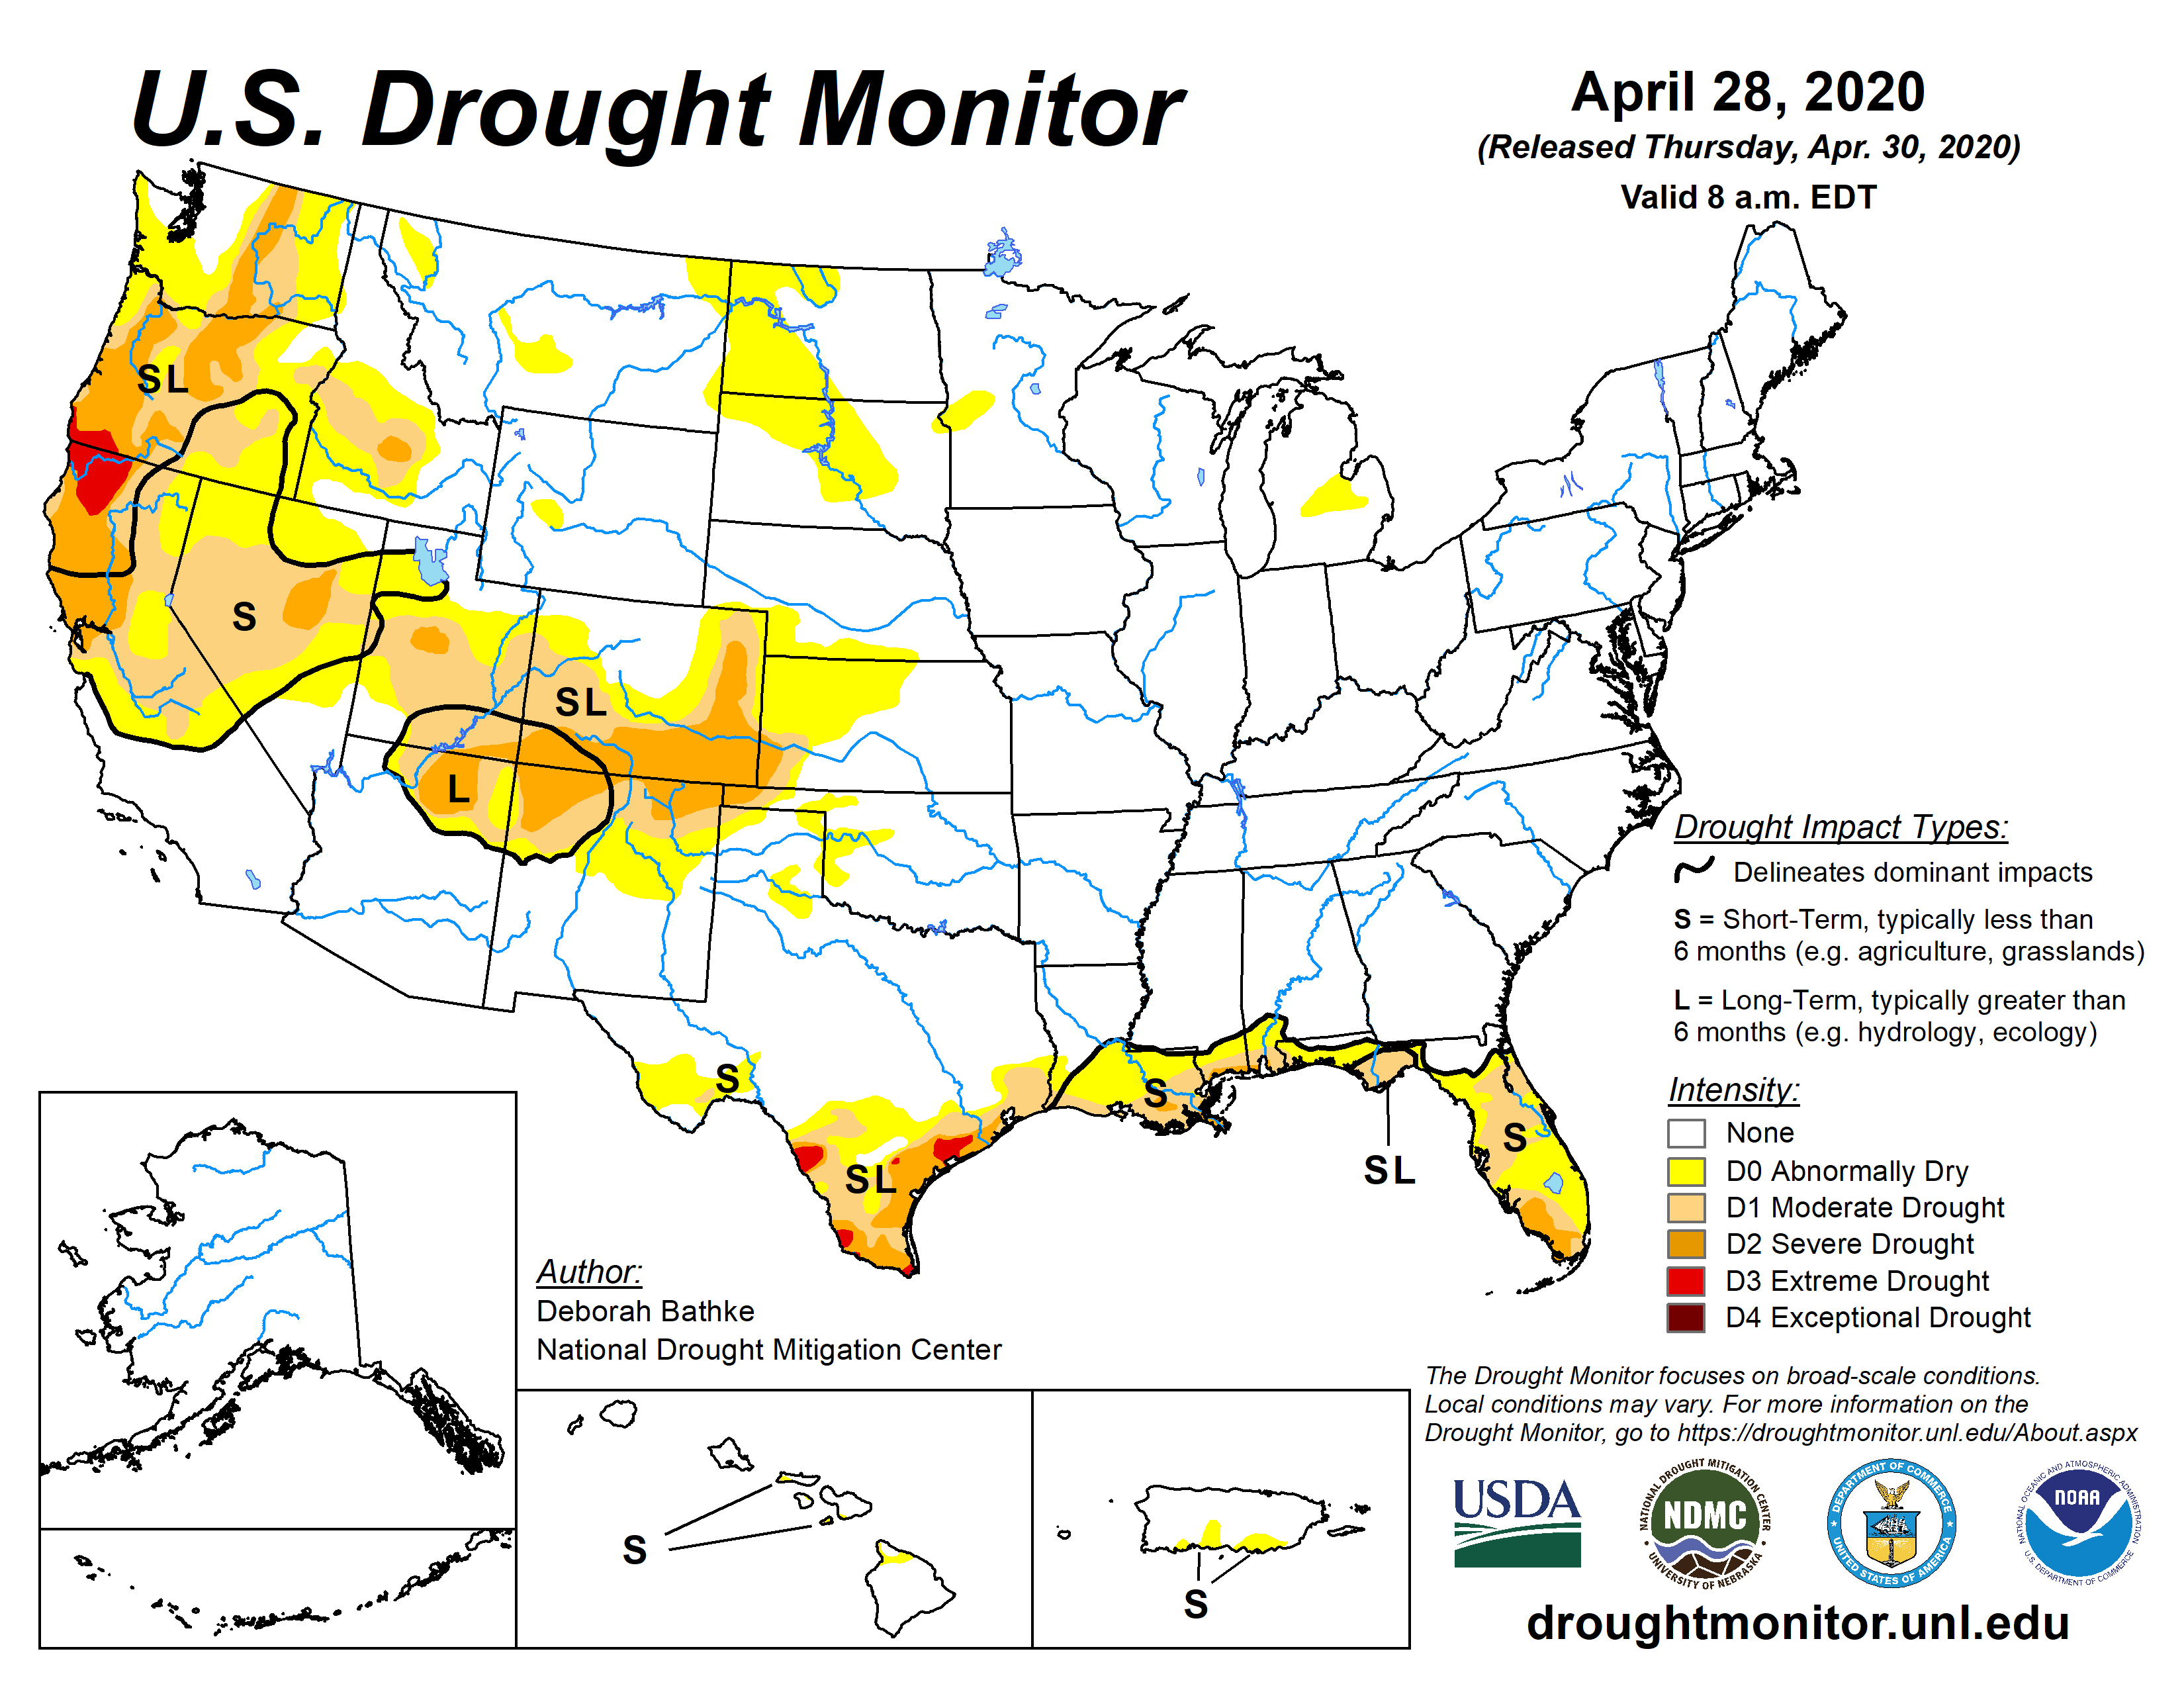
And this shows the U.S. including Alaska, Puerto Rico, and Hawaii.
Below is the map for just CONUS.
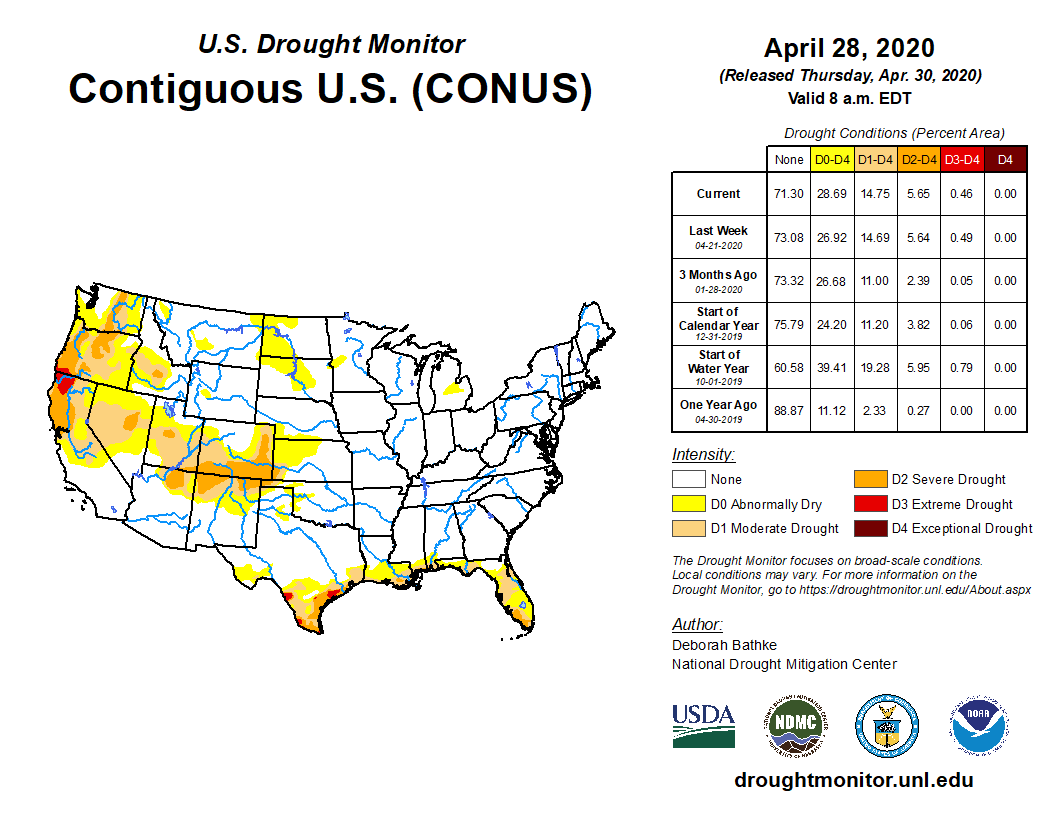 |
 |
| Last Week | This Week |
| |

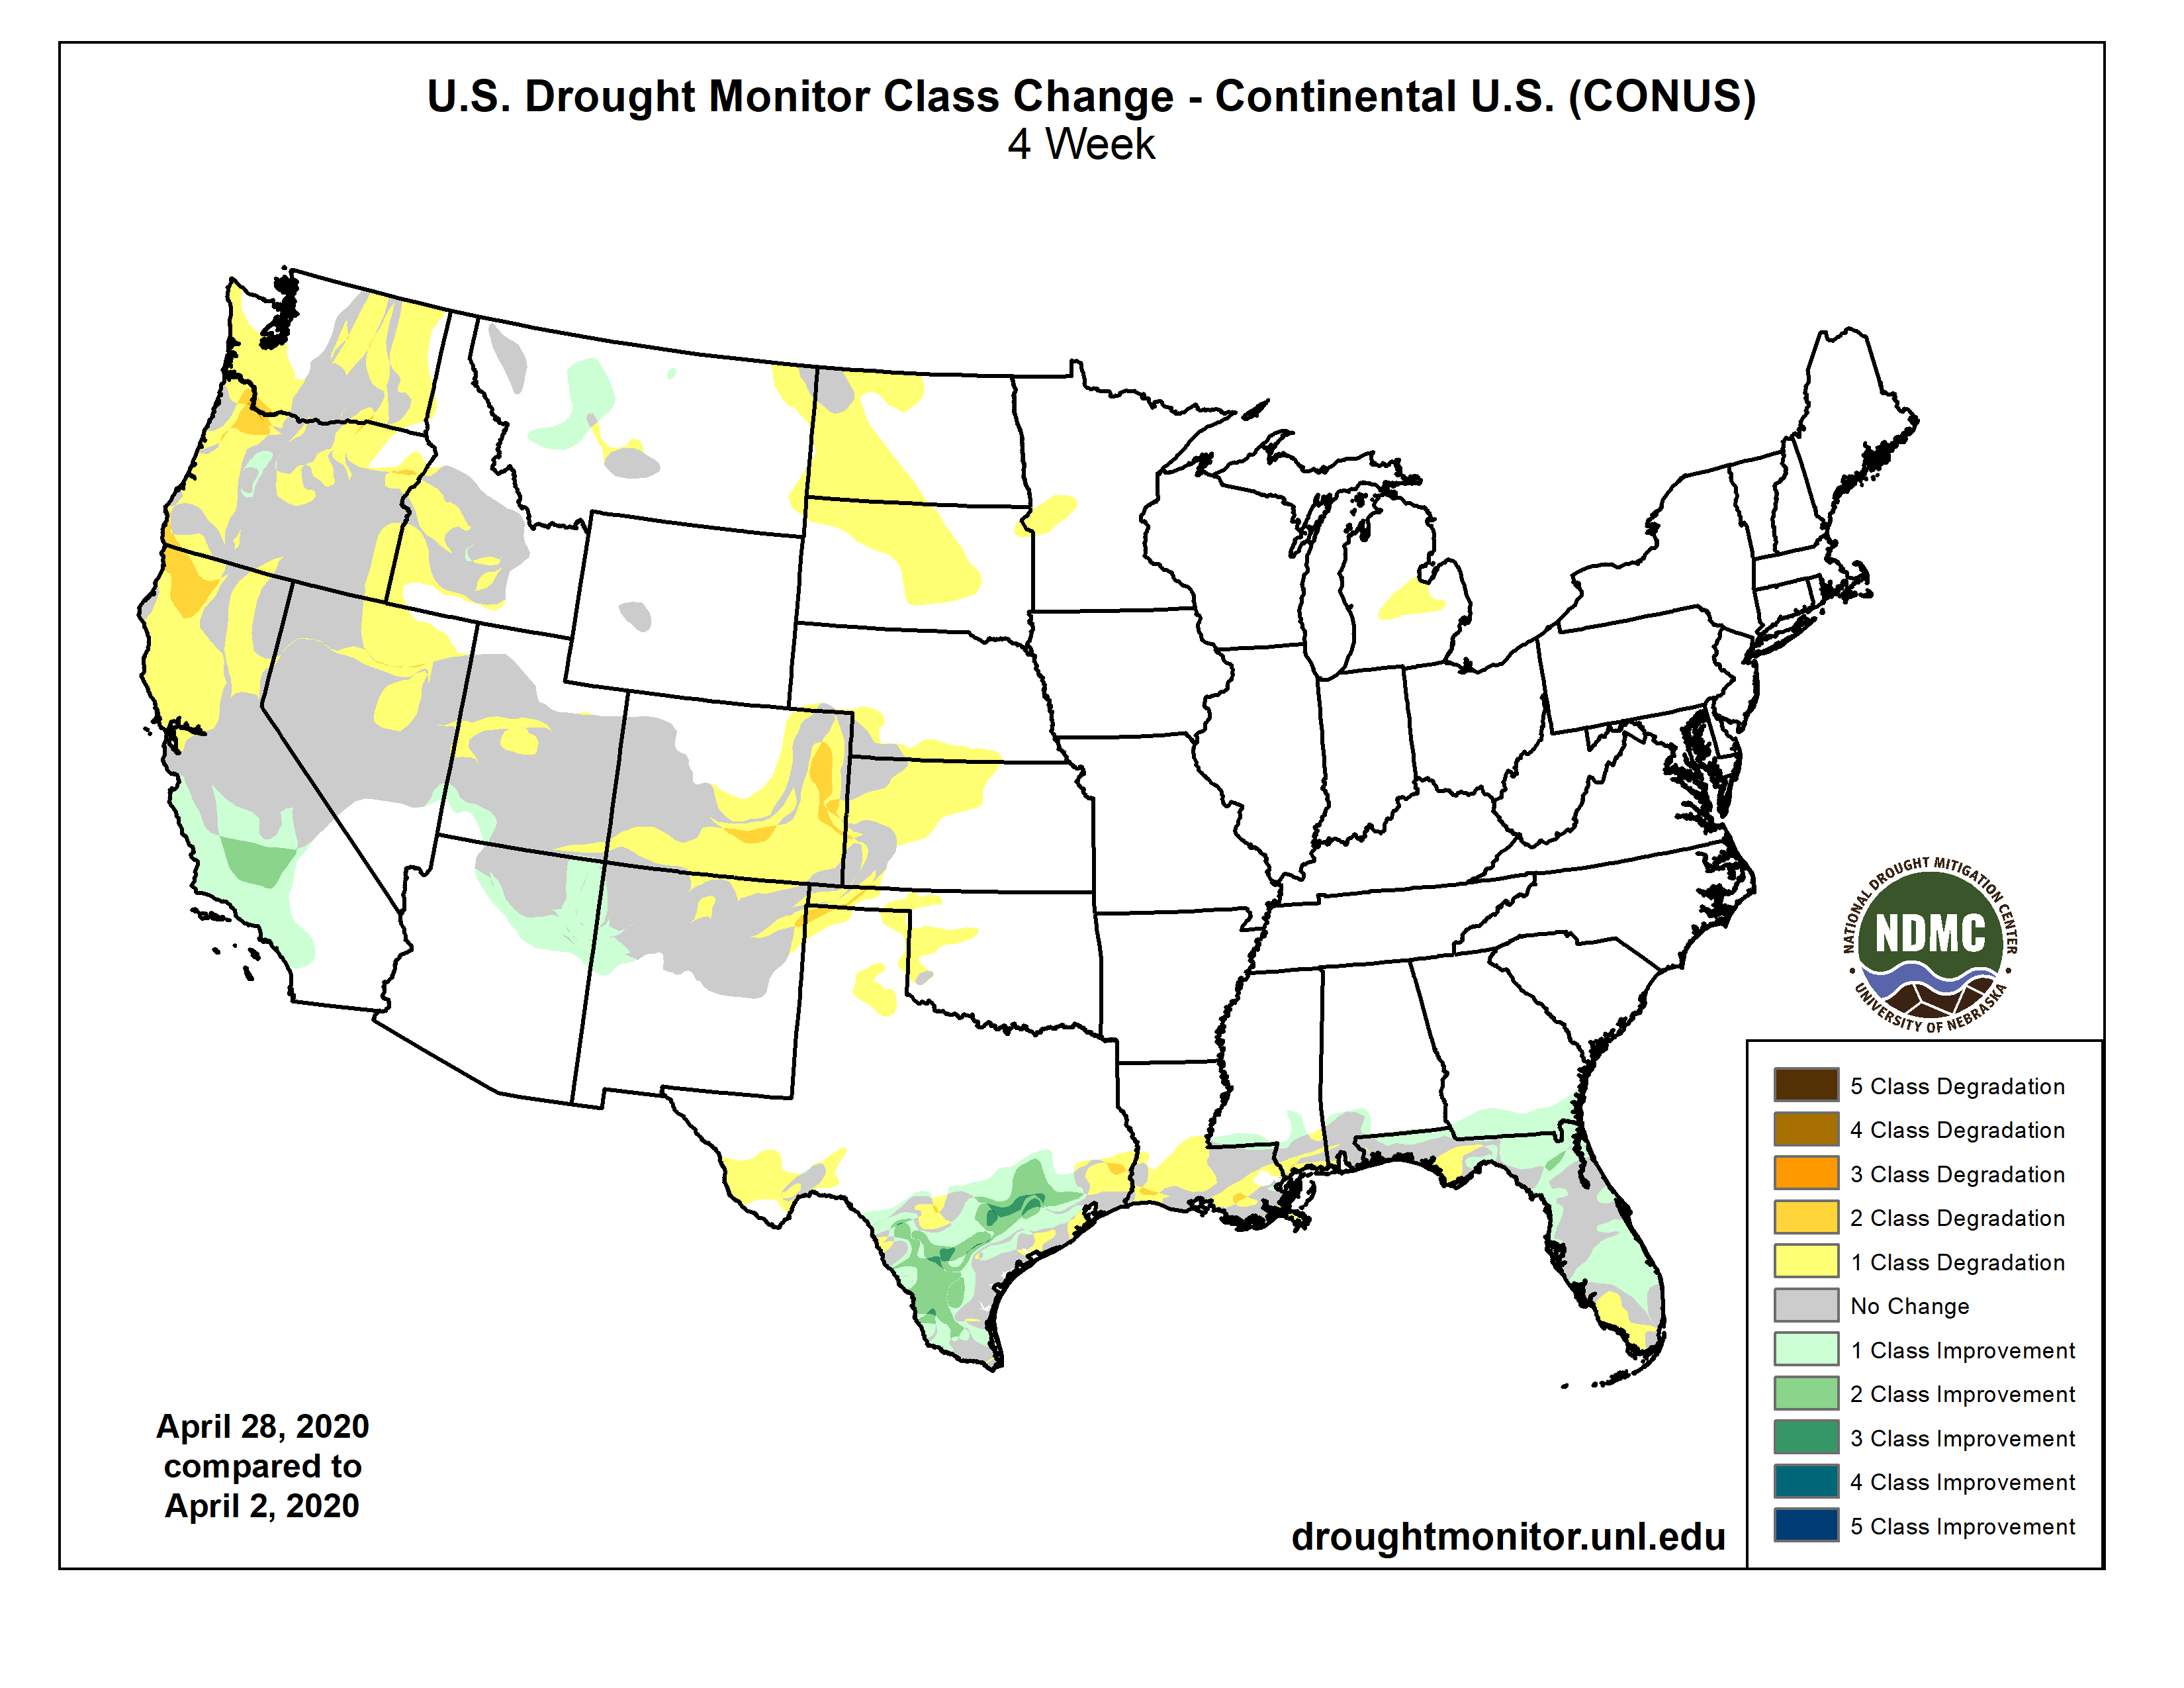
Some might find this animation of twelve weeks of change useful;

The graphic below shows the one-week change in drought intensity. Yellow is bad. Green is good.
|

Now we show the week to week change information by region. The yellow is where the level of drought has been raised. The green is where the level of drought has been lowered.
 |
Quite similar to last week in terms of where it was dry. |
 |
| No Change |
 |
No Change |
 |
Spotty Changes |
 |
Improvement in Florida and just north of their border. |
 |
| Mostly degradation and at about the same latitude. |
Here is the Discussion that was issued with the Drought Report. The Regional Headings can be clicked on to obtain maps and statistics.
This Week’s Drought Summary
An active pattern of storms brought cold, wet weather to the Northeast, rain and locally severe thunderstorms to parts of the South, lower Midwest, and Southeast. Drought areas along the western Gulf Coast missed the heaviest rains, while those in the eastern half fared better. A ridge of high pressure over the West kept conditions warm and dry.
Northeast
A series of weather systems brought cold, wet weather to the Northeast, keeping the region free of abnormal dryness and drought. A dip in the jet stream allowed an influx of cold air into New England and the Mid-Atlantic, setting record daily low temperatures and bringing snowfall to the northern tier and high elevations in the region. The week ended with mean temperatures ranging from 3 to 10 degrees below normal and precipitation totals ranging from less than 0.3 inches (less than 50% of normal) across the northern part of the region to more than 2 inches (greater than 200% of normal) across the southern part.
Southeast
The Southeast saw locally heavy rainfall and thunderstorms with parts of Georgia, Alabama, and Florida receiving upwards of 5 inches of rain. Average temperatures generally ranged 1 to 3 degrees below normal, with the exception of Florida, which saw temperatures of 2 to 5 degrees above normal. The rain helped improve the abnormally dry (D0) areas near the border of Alabama, Georgia, and Florida. In the Florida Panhandle, the rain finally was enough to help reduce moisture deficits and improve streamflow, resulting in the removal of the area of severe drought (D2) that had been in place since mid-February. Other improvements in Florida include a broad 1-category improvement across the northern and central part of the state as excess rain over the last two weeks erased deficits, replenished soil moisture and streamflow, and improved vegetation health. Southeast Florida saw small reductions in moderate and severe drought (D1 and D2) where more than 1.5 inches of rain fell and where precipitation, streamflow, and vegetation health indicators no longer supported the depiction.
Midwest
The western half of the region saw warmer than normal average temperatures, with departures ranging from 1 degree above normal in eastern Iowa to 8 degrees above normal in western Iowa. In the eastern half, temperatures were 1 to 7 degrees below normal, with the greatest departures generally occurring in the Upper Great Lakes area. Precipitation occurred across much of the region with weekly totals generally between 0.5 and 1.75 inches. A band of 3 to 4 inches of rainfall stretched from southwest Missouri to central Illinois. The only change in the region to this week’s map was a small reduction in abnormal dryness (D0) in Minnesota.
High Plains
Temperatures across the High Plains were generally warmer than normal last week with departures of 2 to 6 inches above normal. Much of the region received less than 0.5 inches of precipitation. Exceptions included parts of eastern North Dakota, South Dakota, and Nebraska, with totals of more than 1 inch, and eastern Kansas, with amounts of more than 2 inches – nearly 200% of normal. The warm, dry conditions led to an expansion of abnormal dryness (D0) in the Dakotas, southwest Nebraska, northwest Kansas, and eastern Colorado. Additionally, moderate and severe drought (D1 and D2) expanded over Colorado’s eastern plains. This area has failed to receive the timely spring rains needed, resulting in reductions in soil moisture, streamflow, and vegetation health. Across the entire High Plains region, local drought experts are discussing the emerging dryness and closely monitoring the situation as planting begins and the need for moisture increases.
South
Locally heavy rain and thunderstorms fell across the eastern half of the southern region. The largest totals (4 inches or more) were recorded in Louisiana and Mississippi. Temperatures were near to below normal, with the largest departures (5 degrees below normal) recorded in Tennessee. For the most part, the rain either missed the drought areas near the coast or wasn’t enough to warrant improvements in conditions, instead preventing degradations. The western half of the region generally saw little or no rain again this week. Weekly average temperatures ranged from 2 to 8 degrees above normal, with locations in south Texas setting daily record highs with temperatures reaching triple digits. The warm, dry weather continued to deplete moisture supplies, stress vegetation, and deteriorate drought conditions across parts of the Texas Gulf Coast, with expansions to moderate (D1), severe (D2) and extreme (D3) drought. Texas also saw improvements as localized rain improved soil moisture, vegetation health, and streamflow.
West
Most of the western U.S. received little to no rain, except for small pockets of the Pacific Northwest and the Southwest. Temperatures were generally above normal, with record-setting heat across parts of the Southwest and daily highs of 10 to 20 degrees above normal. The heat and dry weather led to deteriorating conditions across several states. In Oregon, severe drought (D2) expanded near Portland and in the north-central part of the state in response to drying soils, vegetation stress, and streamflow and groundwater declines. Precipitation for the water year ranks as the third driest in the Portland station’s 89-year period of record. In northern California, moderate drought (D1) expanded. While the state coordination committee noted that reservoir levels are acceptable, precipitation deficits are less 50% of normal for the water year, streamflow values are low, and rangeland grasses have been affected by the lack of moisture and heat. Likewise, parts of central Nevada also saw expansions to D1 and the introduction of D2 in response to increasing moisture deficits, declining streamflow and groundwater levels, and vegetation stress. The only improvements on this week’s map included minor reductions in D1 in Oregon and D0 in Washington in response to locally heavy rainfall.
Alaska, Hawaii, and Puerto Rico
In Alaska, no changes were made this week and the state continues to be free of abnormal dryness/drought. In Puerto Rico, an area of abnormal dryness (D0) was added to the southern part of the island where precipitation deficits occur out to 60 days and are accompanied by low streamflow, groundwater declines, and soil moisture deficits. In Hawaii, D0 expanded on the Big Island and moderate drought (D1) was introduced based on rainfall deficits and vegetation stress.
Pacific Islands
The weather conditions across the U.S.-Affiliated Pacific Islands (USAPI) during this USDM week (4/22/20-4/28/20) consisted of convergence associated with a near-equatorial trough across Palau and southwestern Yap State, and trade-wind surface troughs and differential trade-wind speeds over the central Federated States of Micronesia (FSM) to the southern and central Marshall Islands (RMI). These were all manifestations of the climatological Inter-Tropical Convergence Zone (ITCZ), although the ITCZ was most strongly manifested meteorologically from central to eastern Micronesia. Differential trade-wind speeds refers to trade winds with a higher wind speed overtaking, or converging upon, trade winds with lower wind speeds and is also referred to as a trade-wind surge. The convection associated with trade-wind convergence across central to eastern Micronesia was enhanced by upper-level divergence associated with an upper-level trough which lingered for several days from Yap State northeastward. In addition, trade-wind disturbances moved through the ITCZ and a circulation moved across southwest Yap State to southern Palau. The circulation intensified late in the week over southern Palau to the point of being designated Invest 94W. A dry trade-wind pattern dominated the Marianas and northern portions of Yap State and the RMI, although weak disturbances moving in the trade-wind flow brought showers to Guam late in the period. South of the equator, the Samoan Islands were bracketed by surface troughs to the northeast and southwest with drier and more stable air dominating the islands. A moist and unstable air mass moved over the territory late in the period.
Satellite-based estimates of 7-day precipitation (QPE) showed bands of precipitation stretching from Indonesia eastward across the Pacific between the equator and 10 degrees N latitude (the ITCZ), and from Indonesia southeastward past (south) of the Samoan Islands (the South Pacific Convergence Zone, or SPCZ). A continuous band of 1+ inches of rainfall was indicated from Palau, across the FSM, to the RMI and eastward, with embedded areas of 4+ inches. Little to no precipitation registered on the satellite QPE across the Yap archipelago, the Marianas, and the northern RMI. A large mass of 2+ inches of precipitation was detected by the QPE southwest of, and just to the northeast of, the Samoan Islands, with a band stretching across American Samoa.
For a second consecutive week, Palau had 5.48 inches of rain this week. Monthly precipitation totals are at 9.59 inches, which is above the 8 inches of rain to meet most water needs. Beneficial rains and local information stating that vegetation is green resulted in one category drought improvement (abnormally dry conditions).
Guam was the only location to have a little over the weekly threshold of 1 inch, while Saipan and Rota had less than an inch of rain at 0.21 inch and 0.62 inch, respectively. Precipitation totals for the month for all three locations were below the 4-inches threshold to meet most water needs at 2.44 inches (Guam), 1.20 inches (Rota) and 0.50 inch (Saipan). Sapian’s April rainfall total of 0.50 inch is the driest in the station’s 40-year record and Rota ranked as the second driest April in the location’s 25-year record. For this week, severe drought was unchanged for Guam, Saipan continued in extreme drought, while Rota’s drought classification deteriorated to extreme drought.
The locations in western Federated States of Micronesia continued to be dry, receiving less than 1 inch of rain. Yap had the least amount of rain at 0.17 inch for the week, resulting in a monthly rainfall total of 2.80 inches. April 2020 marked Yap’s fourth consecutive month with precipitation totals below 4 inches of rain, securing another week of extreme drought. Ulithi and Woleai had only 0.50 inch and 0.72 inch of rain this week, leaving them in severe drought.
Chuuk Lagoon had 1.31 inch of rain. Although the monthly rainfall total is at 7.71 inches, which is close to the 8 inches threshold to meet most water needs, moderate drought was unchanged this week.
Lukunor had 5.04 inches of rain this week, resulting in a monthly total of 9.28 inches. Since the last three weeks have been wet, drought classification was changed to drought free conditions.
Pohnpei, Kosrae, Kapingamarangi, Nukuoro, and Pingelap had over 2 inches of rain, with some of those stations having close to or over 8 inches of rain. These stations all remain drought free.
Most of the Marshall Islands had a wet week, receiving over 2 inches of rain. Jaluit and Mili had 2.25 inches and 3.75 inches, respectively, and continue to be drought free.
Majuro had over 4 inches of rain this week, resulting in 12.01 inches for the monthly total. Reservoir levels have improved, however, were at 74% as of April 27, which is below the critical level of 80%. For that reason, abnormally dry conditions persist this week.
This week marks the second consecutive wet week for Ailinglapalap, with precipitation totals over 3 inches during both weeks. The monthly total for April is slightly below 8 inches and the previous two months had less than 4 inches of rain, so for this week moderate drought remains.
Similarly, Kwajalein had over 3 inches of rain this week, resulting in a monthly total of 7.53. However, the previous month rainfall total was only 1.54 inch and local reports have stated that water supply in the island is still low. For this reason, severe drought remains unchanged.
Utirik had only 0.18 inch of rain this week, while Wotje had over 2 inches of rain. Since monthly precipitations were below 4 inches, extreme drought persists in these locations.
This week Siufaga Ridge had over 1 inch of rain, while Pago Pago and Toa Ridge had 0.53 inch and 0.81 inch of rain this week, respectively. Tutuila remains in drought free status since the monthly rainfall for Pago Pago, Siufaga Ridge, and Toa Ridge is close to or over three times the monthly threshold of 4 inches to meet most water needs.
Virgin Islands
Dry conditions continued to affect the USVI this week. Precipitation totals were less than 0.1 inch at St. Thomas and St. Croix, while St. John had the most rainfall at 0.51 inch. St. Thomas Cyril E. King airport’s month-to-date rainfall total of 0.37 inch is 15.6% of normal precipitation, while the year-to-date is close to normal (104.2% of normal). Similarly, St. Croix Henry E. Rohlsen airport’s month-to-date rainfall was only 0.45 inch or 24.4% of normal precipitation; however, the year-to-date rainfall total is close to normal at 111.0%. For this week, both stations remain in abnormally dry conditions.
St. John’s monthly rainfall total is 0.56 inch or 19.9% of normal precipitation and the SPI value for one month is -1.08. The 3, 6, 9, and 12 month SPI indicate drought free conditions. For this reason, abnormally dry conditions also remain unchanged for St. John.
Looking Ahead
The National Weather Service Weather Prediction Center forecast for the remainder of the week calls for continued wet conditions across much of the eastern U.S., with the highest values (more than 2 inches) expected over the Mid-Atlantic. Temperatures in the eastern half of the country are expected to be near to above normal, with departures of 1 to 8 degrees, over the weekend. For the western half of the country, areas expected to receive an inch or more of precipitation include parts of the Pacific Northwest, northern Rockies, and Central Plains. In the Southwest, dry weather with temperatures 10 to 15 degrees above normal is expected to continue. Moving into next week, the Climate Prediction Center 6-10 day outlook (valid May 5-9) favors below-normal temperatures for the much of eastern half of the country. Above-normal temperatures are expected throughout the West, the southern Plains, along the Gulf Coast, and throughout Florida. The greatest probabilities for above-normal precipitation are expected from northern Texas to the Middle Mississippi Valley and along the Mid-Atlantic and New England coasts.
And shifting to the Alaska and CONUS Intermediate-Term Weather Forecast (it is somewhat redundant with the Visual Consistency Analysis presented earlier but if I remove it, I may forget to put it back in next week).
 |
|
|
|
And then Precipitation
|
|
|
Some may find the below way of looking at things useful and I hope these graphics are not too small to read. I did not make them so you could click on them individually but you can click on the whole graphic and it may enlarge. But I think you get the picture. It has been a rapid onset and demise. When you read these graphics, remember that the older graphics are not the drought conditions that existed then but the change from then until now.

Let’s focus on the change between March 31, 2020 and April 28, 2020, i.e. one month.
Focusing on the Intermountain West

Drought Forecasts
These two forecasts (Monthly and Season) are issued by the same agency but to obtain them you need to access two different links here and here.
Here is the Three-Month Forecast which was issued on March 19, 2020

Here is the Monthly Drought Outlook which was updated on April 30, 2020. (We discussed this in the Special Topics Section of tonight’s Report).

Floods
Floods remain a concern.

| Last Week | Current Week |
| |


Wildfires
Our usual graphic is not updating so we have deleted it. Bu updates from this source can be found here.
Current Wildfire Risk. This is a new model that updates daily by NOAA (but not automatically in this article) to show the short-term risk.

Click here to update. Red is high risk, blue is low risk. This graphic updates daily but you have to click on the link provided to get the updates More information can be found here.
This explains the model a bit.

The below graphics are monthly risk estimates for Wildland Fire Potential. They update monthly.

Looking out another month.


Surface soil conditions
 |
 |
Subsurface Soil Conditions
 |
 |
Crop and Animal Husbandry Progress. USDA Executive Briefings can be found here (there was an Executive Briefing this week and we presented it). NASS reports can be found here. Foreign Intelligence reports can be found here.
There were a lot of NASS reports this week and we did not have time to prepare them for publication. This shows the major reports scheduled. Most are NASS Reports. We reported on one on the International Reports.
It is the time that NOAA starts showing crop progress.

 |
 |
| Crop | Production Stage | Better or Worse than Last Year, 5- year Average, and considering crop condition. (Better than last year may not be good enough given the very slow start last year). |
| Corn | Planted and Emerged | Good |
| Soybeans | Planted | Good |
| Cotton | Planted | Slightly Good |
| Rice | Planted and Emerged | Similar to last year but much slower than five-year average. |
| Sorghum | Planted | OK |
| Peanuts | Planted | OK |
| Sugar Beets | Planted | Improved over last year but below five-year average. |
| Winter Wheat | Headed | Improved over last year but below five-year average. |
| Oats | Planted and Emerged | Improved over last year but slower than five-year average. |
| Spring Wheat | Planted and Emerged | Improved over last year but slower than five-year average. |
| Barley | Planted and Emerged | Improved over last year but slower than five-year average. |
International

A map helps and is not always available but fortunately, it was available this week.

Major Sources of Information
In the box are shown the major resources we use. We will not be using them all each week but the reader is welcome to refer to these resources.
Major Sources of Information Used in this Weekly Report
|
Background Information


The sequence of drought occurrence and impacts for commonly accepted drought types. All droughts originate from a deficiency of precipitation or meteorological drought but other types of drought and impacts cascade from this deficiency. (Source: NDMC)
Source: National Drought Mitigation Center, University of Nebraska-Lincoln
.


