Written by Sig Silber
We offer our first modest insight into the question of the impact of weather on COVID-19. It is not a game-changer by any means. So to talk about something more pleasant, tonight we focus on the NASS Executive Briefing on Hogs and Pigs. We have a video on pigs enjoying swimming. We presented February State Rankings re temperature and precipitation last month. Now we present the data for the Winter Season. We provide some maps on the Arctic Sea Ice situation which is better than in recent years. We focus on the flood risk which is substantial. Of course, we have our full set of regular weekly reports that focus on the latest NIDIS Drought Report. We provide a 28-day weather forecast where the first 14 days update daily.

Please share this article – Go to the very top of the page, right-hand side, for social media buttons. Please feel free to send this article to anyone who you think might benefit from reading it.
Directory
Readers can scan through this article or jump to where they want to go via the links to the right. Directory links are under construction. Check back for completion. |
|
Ongoing Topic – Weather and COVID-19
Although the research is far from definitive, several studies in China find that higher temperatures do decrease Covid-19 incidence. One, a modeling study posted to the preprint site medRxiv on Tuesday, “confirmed that transmission rate decreased with the increase of temperature, leading to further decrease of infection rate and outbreak scale,” scientists at China Medical University wrote. One reason may be that this coronavirus, like that which caused the SARS epidemic in the early 2000s, can’t survive on surfaces as long in warmer weather.
LINK to original source
Preliminary evidence that higher temperatures are associated with lower incidence of COVID-19, for cases reported globally up to 29th February 2020 Melanie Bannister-Tyrrell1*, Anne Meyer2*, Céline Faverjon2, Angus Cameron2* Contributed equally Affiliations 1 Ausvet, 5 Shuffrey Street, Fremantle, Western Australia, Australia 2 Ausvet Europe, 3 Rue Camille Jordan, Lyon, FranceCorresponding author information Dr Melanie Bannister-TyrrellEmail:[email protected] Abstract Seasonal variation in COVID-19 incidence could impact the trajectory of the pandemic. Using global line-list data on COVID-19 cases reported until 29th February 2020 and global gridded temperature data, and after adjusting for surveillance capacity and time since first imported case, higher average temperature was strongly associated with lower COVID-19 incidence for temperatures of 1°C and higher. However, temperature explained a relatively modest amount of the total variation in COVID-19 incidence. These preliminary findings support stringent containment efforts in Europe and elsewhere. Keywords COVID-19; SARS-CoV-2; coronavirus; pandemic; temperature; seasonality Conflict of interest None Funding statement No specific funding was awarded for this research
Special Topic for this Week
Pigs and Hogs


Pigs can swim

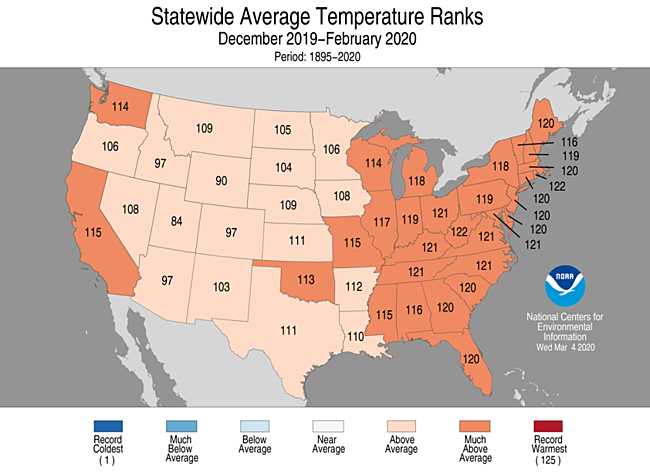
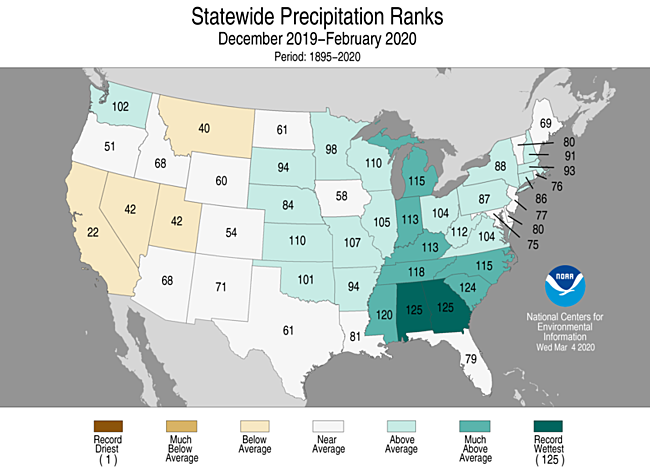
Winter State Rankings for Temperature and Precipitation


Arctic Sea Ice


Flood Risk


Current U.S. Snowpack

Water Supply Issues

It is useful to look at the last seven days.

Here is a side by side comparison
|  |

The above has a lot of detail but is not up to date. Here is an up to date map of snow depth.

Current Drought Conditions
Now we take a look at Thursday’s U.S. Drought Monitor Report.
The U.S. Drought Monitor is a comprehensive way of understanding the drought situation for the U.S. It is issued every Thursday and reflects the conditions as of the prior Tuesday. Drought is defined as a moisture deficit bad enough to have social, environmental or economic effects. Thus, more factors than recent precipitation are considered and more information on how it is done is found at the end of this report.
U.S. Affiliated Pacific Islands and the U.S. Virgin Islands.

And this shows the U.S. including Alaska, Puerto Rico, and Hawaii.

Below is the map for just CONUS.
 |
 |
| Last Week | This Week |
| |

Some might find this animation of twelve weeks of change useful;

The graphic below shows the one-week change in drought intensity. Yellow is bad. Green is good.
|

Now we show the week to week change information by region. The yellow is where the level of drought has been raised. The green is where the level of drought has been lowered.
 |
No Change other than a small area of degradation in Northwest North Dakota |
 |
| No Change |
 |
Improvement from North Jersey to Rhode Island reversing the degradation from the prior week. |
 |
Degradation right along the Gulf Coast. Improvement north of the degradation. On balance it is improvement. |
 |
| Degradation in South Florida and South Alabama more or less the Gulf States. Very similar to last week and the prior week. |
 |
| Overall improvement. You can see some degradation right along the coastline. But much of California has improved and Northeast Utah has improved. |
Here is the Discussion that was issued with the Drought Report. The Regional Headings can be clicked on to obtain maps and statistics.
This Week’s Drought Summary
Storms delivered much-needed precipitation to California’s key watershed areas before soaking an area from the southeastern Plains into the Ohio and Tennessee Valleys with as much as 2 to 4 inches of rain. Some of the rain overlapped existing drought areas in southern Texas, providing substantial relief. Widespread precipitation also fell across the remainder of the West, except in the northern Rockies. Significant precipitation was also noted in Iowa and environs, while wind-driven snow blanketed parts of northeastern Colorado and western Nebraska. In contrast, warm, dry weather dominated the lower Southeast, including Florida, boosting irrigation demands and further reducing topsoil moisture. Weekly temperatures averaged more than 10°F above normal in many areas from the central Gulf Coast into the Southeast, contributing to further introduction or intensification of abnormal dryness (D0) and moderate to severe drought (D1 to D2).
Northeast
The newly added area of abnormal dryness (D0), stretching from the Delaware River Valley to southern New England, received two rounds of heavy precipitation. From March 19-24, precipitation totaled at least 2 inches in many locations within last week’s D0 area, including Providence, Rhode Island (2.67 inches); Newark, New Jersey (2.25 inches); and Bridgeport, Connecticut (2.19 inches). As a result, the D0 area was significantly reduced in size and split into two pieces. Despite the recent precipitation much of the Northeast remains in a “snow drought,” with season-to-date totals through March 24 including 15.1 inches (37% of normal) in Boston; 11.8 inches (36%) in Providence; and 4.8 inches (19%) in New York’s Central Park.
Southeast
The Southeast remains a tale of two landscapes: wet to the north in recent weeks, except in some locations across the coastal plain and along the Atlantic Coast, but dry along the Gulf Coast and in Florida. The dryness extends back several months in parts of Florida, where moderate to severe drought (D1 to D2) was introduced or expanded. The new D1 area, highlighted by dry soils, low streamflow, and increasing fire danger, encompasses part of interior southern Florida, south of Lake Okeechobee. During the first 24 days of March, no measurable rain fell in many Florida locations, including Tampa, Lakeland, and Sarasota-Bradenton. Those values are 2 to 3 inches below normal – and have been accompanied by temperatures averaging 4 to 6°F above normal. March 1-24 rainfall totaled just 0.02 inch in Orlando, Fort Myers, and Daytona Beach, Florida. According to the U.S. Department of Agriculture, topsoil moisture in Florida was 51% very short to short on March 22, up from 38% a week earlier.
South
Heavy rain across interior southern Texas provided significant drought relief. According to the U.S. Department of Agriculture, statewide topsoil moisture rated very short to short stood at 19% in Texas on March 22, down from 40% the previous week. On the same date, 49% of the winter wheat in Texas was rated in good to excellent condition. In southern Texas, a small patch of exceptional drought (D4) persisted along and near the Rio Grande, but rain resulted in a general reduction in coverage of moderate to extreme drought (D1 to D3) in many other areas. Cotulla, Texas, in La Salle County, received 2.98 inches of rain from March 18-22. Closer to the Gulf Coast, however, March 1-24 totals included 0.22 inch in Corpus Christi and 0.01 inch in Rockport. Farther north near the coast, there was some expansion of moderate to severe drought (D1 to D2) in southeastern Texas. Meanwhile, there was no change in the drought depiction across Oklahoma’s panhandle, but the small area of abnormal dryness (D0) and moderate drought (D1) in southwestern Oklahoma was split into two pieces and reduced in size and intensity. Elsewhere, dryness persisted along and near the central Gulf Coast. D1 persisted across southeastern Louisiana, while D0 was slightly expanded.
Midwest
The Midwest has been completely free of drought early-November 2019 and has experienced no dryness (D0) since January 7, 2020. It was a wet week across the region, with rain changing to snow in Iowa and portions of neighboring states. In Sioux City, Iowa, March 19-20 featured precipitation totaling 1.60 inches and 3.8 inches of snow. Meanwhile, heavy rain fell from Missouri into the Ohio Valley.
High Plains
Dryness (D0) and moderate to severe drought (D1 to D2) remains mostly confined to the southwestern part of the region, although a spot of D0 was introduced in northwestern North Dakota. On March 19, a spring storm delivered wind-driven snow to parts of northeastern Colorado and western Nebraska. Denver, Colorado, reported 6.0 inches of snow on that date, along with a peak northerly wind gust to 49 mph. Some snow fell in the region’s mountainous areas, but there was little overall change in the drought depiction, except for some removal of moderate drought (D1) in northwestern Colorado.
West
It was an active drought-monitoring period in the West, although northern sections of the region received little or no precipitation. During the 10-day period ending March 24, the average water equivalency of the Sierra Nevada snowpack rose from 10 to 14 inches, according to the California Department of Water Resources, representing an improvement from just over one-third of the mid-March normal to about one-half of the late-March normal. Meanwhile, several rounds of heavy precipitation also struck southern California and the Desert Southwest, resulting in modest reductions in drought severity. While the late-season precipitation has reduced irrigation demands and has provided a nice boost in soil moisture and snowpack, the moisture is generally too late for drought-stressed rangeland that has already lost forage yield potential due to winter drought. Farther north, drought slightly expanded in northwestern California and western Oregon, as below-normal seasonal precipitation was reflected by dry soils, sub-par snowpack, and unusually low streamflow. Patches of dryness and drought also stretched from the eastern slopes of the Cascades onto the northern High Plains.
Alaska, Hawaii, and Puerto Rico
Neither dryness nor drought exists in Alaska and Puerto Rico. Meanwhile in Hawaii, extremely heavy rain fell on Kauai from March 16-18. During that 3-day period, rainfall totaled 8.46 inches in Lihue, Kauai. Elsewhere on Kauai, 72-hour rainfall amounts (ending at daybreak on March 18) reached 29.05 inches on famously wet Mount Waialeale; 14.27 inches in Hanalei; and 11.77 inches in Wailua. Much of Mount Waialeale’s total – 22.10 inches – fell in a 24-hour period on March 16-17. Elsewhere, March 16-18 rainfall totaled 3.03 inches in Honolulu, Oahu, and 4.91 inches in Hilo, on the Big Island. In Hawaiian areas affected by dryness (D0) and moderate to severe drought (D1 to D2) – encompassing just over one-tenth of the state but limited to parts of Maui and Hawaii Counties – assessments continue to determine how much of a positive impact the mid-March rainfall is having on streamflow and pasture conditions.
Pacific Islands
Synoptic Summary:
The weather conditions across the U.S.-Affiliated Pacific Islands (USAPI) during this USDM week (3/18/20-3/24/20) consisted of a dry trade-wind regime across northern portions of Micronesia and convection associated with the Inter-Tropical Convergence Zone (ITCZ) in southern portions. The dry trade-wind regime is associated with the North Pacific Subtropical High which normally shifts southward during this time of year, with the ITCZ normally also shifting more toward the equator. The ITCZ took the form of a near-equatorial surface trough across southern portions of central to western Micronesia and trade-wind convergence across southern portions of central to eastern Micronesia. A weak circulation enhanced precipitation within the near-equatorial trough as it slowly moved from southwest Chuuk State, across southern Yap State, to Palau. South of the equator, a high pressure ridge axis kept dry weather across the Samoan Islands for much of the week, while a surface trough to the southwest moved closer to American Samoa as the week progressed.
Satellite-based estimates of 7-day precipitation (QPE) showed a large band of 2+ inches of rain across southern Micronesia, with a band of 4+ inches stretching from Palau across the Federated States of Micronesia (FSM). Areas of 8+ inches were indicated over parts of Yap and Chuuk States. Little to no precipitation was detected by this product over the Marianas and northern Marshall Islands (RMI). The satellite QPE showed areas of 2+ inches of rain south of the Samoan Islands, with a tongue of 0.5-1.0 inch reaching over American Samoa.
Palau:
In the Republic of Palau, the last 3 weeks have been dry (less than the 2-inch weekly minimum needed to meet most water needs) at Koror, with 1.97 inches recorded this week (just barely below the weekly minimum) and 3.47 inches of rain so far this month. Based on data through March 24, this month ranks as the 9th driest March for Koror. D0-S continued for Palau.
Marianas:
Dry conditions continued in the Marianas, with rainfall totals well under the weekly minimum (1 inch). A tenth of an inch or less was recorded at Saipan (0.10 inch in the manual gauge), the Guam airport (0.09), the Rota airport (0.08), Tinian (0.04), and the automated stations at Saipan (0.04 at the NPS station and at the airport ASOS station). Tinian reported 0.17 inch. Based on data through March 24, with 0.55 inch of rainfall, this month ranks as the driest March in the 1957-2020 record at Guam, with March 1965 recording 0.59 inch. The KBDI (Keetch-Byram Drought Index) at Guam was well past 700, indicating an extreme fire risk. With 0.55 inch of rain so far (through March 23), this month ranked as the 3rd driest March on record at Saipan (manual gauge). D2-S continued on Saipan and D1-S continued on Guam and Rota.
Federated States of Micronesia:
In the FSM, Fananu has been missing for several months, so this station could not be analyzed. Some stations in Yap and Chuuk States, especially the southern areas, had a wet week (more than the 2-inch weekly minimum), while the rest of the stations were dry (less than 2 inches). Twelve (12.02) inches of rain fell at Nukuoro this week, filling catchments and prompting the USDM status to improve from D1-S to D0-S. The D0-S reflects lingering agricultural impacts from the recent severe dryness. Over 6 inches (6.16) was reported at Kapingamarangi, bringing the March total to 12.62 inches and continuing the D-Nothing status. Woleai was the other wet station this week, recording 2.24 inches, but with the monthly total (5.16 inches) still below monthly minimums, D1-S continued. Even with a wet week, this March ranked as the 13th driest March at Woleai (based on data through the 24th), and the last 3 months ranked as the 5th driest January-March.
A tenth to a quarter inch of precipitation was observed at stations in the Yap archipelago, including the Yap Weather Service Office (0.11 inch), Rumung (0.10), and North Fanif (0.16), so D2-S continued for Yap. Pingelap reported a tenth of an inch (0.10) for the week and 3.80 inches for the month, which ranks as the third driest March so far. Nearby Mwoakilloa recorded 0.63 inch for the week and only 2.35 inches for the month. Chuuk had 0.63 inch of rain this week. D0-S continued for Chuuk and Pingelap. Lukonor recorded 0.42 inch for the week and 5.27 inches for the month so far. But January-March (so far) ranked as the third driest, so D1-S continued at Lukonor. D1-S continued for Ulithi, where 0.62 inch was reported this week and March (so far) ranked as the third driest. This week was dry at Kosrae (1.85 inches) and Pohnpei (1.78 inches), but previous weeks and months were wet, so D-Nothing continued.
Marshall Islands:
In the RMI, Kwajalein had no missing data for the week, Ailinglapalap, Mili, and Wotje were missing one day, and Majuro, Jaluit, and Utirik were missing 2 days. Based on data received so far, it was a wet week at Mili with 2.26 inches of rain. But the rest of the stations recorded far less than the weekly minimum needed to meet most water needs (which is 2 inches). Weekly rainfall amounts ranged from zero at Utirik and Wotje to 0.91 inch at Jaluit. The USDM status at Mili was improved this week to D-Nothing from the D0-S of last week due to 2.26 inches of rain this week, 2.92 inches last week, 3.58 inches 2 weeks before that, and 6.86 inches so far in March. Otherwise, the status at the rest of the stations was the same as last week, with D0-S continuing at Ailinglapalap, Majuro, and Jaluit; D1-S continuing at Kwajalein; D2-S at Utirik; and D3-S at Wotje. There were reports of water shortages on Ebeye Island in the Kwajalein atoll, and the Majuro reservoir stood at 27.342 million gallons on March 23, which is 76% of maximum and below the level of concern for drought. Wotje has recorded no measurable rain this month; only two other Marches have had zero inches – 1990 and 1994.
American Samoa:
In American Samoa, Pago Pago (1.18 inches) and the automated station at Toa Ridge (2.04 inches) recorded more than the weekly minimum rainfall of 1 inch, while half an inch was measured at the automated station at Siufaga Ridge (0.54). With February very wet, March already meeting the 4-inch monthly minimum for most water needs, and February-March (through March 24) ranking as the 6th wettest February-March on record, D-Nothing continued at Tutuila.
Virgin Islands
Synoptic Summary:
The weather pattern across the USVI during this USDM week (3/18/20-3/24/20) consisted of moisture fed into the islands by a surface trough, and by a northeasterly trade-wind flow which was created by surface high pressure over the western Atlantic. During the last half of the week, mid- to upper-level troughs, and a TUTT (Tropical Upper Tropospheric Trough) to the northwest, created instability which enhanced showers over the region.
St. Croix:
Heavy rains fell across St. Croix this week, with the UVI station reporting 4.42 inches, the Rohlsen Airport station recording 2.62 inches, the CoCoRaHS stations at Christiansted 1.8 ESE and Christiansted 4.1 ESE receiving 3.00 and 2.45 inches, respectively, and the station at East Hill measuring 2.14 inches. With 3.64 inches for the month so far, Rohlsen is 311% of normal. The steady decline of the Adventure 28 well observations of the last several weeks has been arrested, with the groundwater measurements leveling off this week. The Standardized Precipitation Index (SPI) values for the Rohlsen/Hamilton Airport and East Hill stations have improved, but they are still at drought (D1) or abnormally dry (D0) levels at the 6- to 12-month time scales. The St. Croix USDM status was improved to D0-L this week, with the improvement reflecting the abundant recent rain, and the D0-L reflecting the lingering long-term dryness.
St. Thomas:
On St. Thomas, the Cyril E King AP station reported 1.30 inches of rain for this week, with a month-to-date total of 2.51 inches which is 237% of normal. The year-to-date total is 7.46 inches with a departure of +2.59 inches or 153% of normal. The Anna’s Retreat 2.5 ESE CoCoRaHS station reported 0.92 inch of rain for the week and 1.92 inches for the month. The St. Thomas USGS Grade School 3 well has been going up and down during the last 4 months, but has been rising the past 2 weeks, and is higher than a year ago. The SPI values for King were near normal to wet at all time scales The USDM status for St. Thomas continued at D-Nothing this week.
St. John:
On St. John, the station at Windswept Beach reported 0.94 inch of rain for the week (through March 23) with 2.33 inches for the month so far and 10.26 inches for the year (which is 159% of the long-term average). The St. John USGS Susannaberg DPW 3 well level has been steadily dropping since the end of January 2020, but is still above where it was at the end of 2019. The SPI values for Windswept Beach were near normal to wet at all time scales. The USDM status for St. John continued at D-Nothing on this week’s map.
Looking Ahead
In the West, showers will gradually diminish as the week progresses. By late Friday, a significant spring storm system will begin to intensify across the central Plains. The storm will move northeastward, reaching the northern Atlantic Coast on Monday. As a result, storm-total precipitation could reach 1 to 3 inches across large sections of the Midwest and Northeast. Accumulating snow may occur from the central High Plains (e.g. northeastern Colorado) into parts of the upper Great Lakes region, as well as northern New England. In contrast, mostly dry weather should prevail during the next 5 days across the southern High Plains and the southern Atlantic region, including Florida.
The NWS 6- to 10-day outlook for March 31 – April 4 calls for the likelihood of near- or below-normal temperatures in much of the eastern one-half of the U.S. and across the nation’s northern tier, except Maine. Warmer-than-normal weather can be expected in Maine, along with Florida, the Gulf Coast region, and an area stretching from California to the High Plains. Meanwhile, near- or below-normal precipitation across large sections of the country should contrast with wetter-than-normal conditions along the Canadian border from the northernmost Rockies into the upper Great Lakes region, and across the South from Texas to the southern Atlantic Coast.
And shifting to the Alaska and CONUS Intermediate-Term Weather Forecast
 |
|
|
|


And then Precipitation
|
|
|


Here is the discussion that was released with the Week 3 – 4 forecast today. We do this because we believe that when considering the economic impacts of weather one needs to look ahead more than 14 days.
Week 3-4 Forecast Discussion Valid Sat Apr 11 2020-Fri Apr 24 2020
The CPC velocity potential-based and RMM-based MJO indices both indicate an active signal, with the enhanced phase moving over the eastern Indian Ocean. While there has been a robust intraseasonal projection in the wind fields, until recently the convective pattern has not exhibited robust anomalies consistent with MJO activity. The GEFS forecasts robust MJO activity over the next two weeks, while the ECMWF weakens the signal over the Pacific and resumes the fast eastward propagation in the wind field that has been observed since early March. Due to the lack of a robust convective response, the ECMWF solution is favored, and therefore the MJO is not anticipated to play a substantial role in the evolution of the midlatitude pattern during the Week-34 period. More weight is given in this outlook to dynamical model consensus and long term trends rather than statistical model guidance based on MJO activity. Additionally, abnormally warm SSTs across the equatorial Pacific are generating a warm ENSO response in the statistical guidance.
Dynamical model 500hPa height anomaly forecasts during Week-34 show a fairly consistent evolution from the forecast state during Week-2. While a generally positive AO structure is favored to continue, anomalous ridging over the North Pacific and western North America allows the potential for height falls across eastern Canada and parts of the Northeast. This pattern change favors warming across Alaska and parts of the Northwest, while increasing the potential for late season cold air outbreaks across parts of the northern tier of the CONUS. Troughing over the North Atlantic would limit the potential for blocking. Additionally, the CFS and Subseasonal Experiment (SubX) multi-model ensemble suggest the potential for weakness in the height field across the Southwest with an active southern stream, while most of the guidance maintains ridging across Florida or parts of the Southeast.
Based on the anticipated height pattern, above-normal temperatures are favored across Alaska and the Northwest, with below-normal temperatures favored across the northern Great Plains, Great Lakes, and Northeast. This forecast is weighted more towards the dynamical model solutions, particularly the ECMWF, rather than the multiple linear regression (MLR) statistical tool, which has substantial contributions from the MJO and ENSO components. A fairly tight temperature gradient is possible across the East, with above-normal temperatures more likely along the Gulf Coast due to ridging in the vicinity of Florida.
Consistent with the potential for a mean frontal boundary in the vicinity of the sharp north-south temperature gradient over the East, above-median precipitation is favored across the lower Mississippi Valley, Ohio Valley, and much of the Southeast. Dynamical models differ on the exact location for the focus of heavy precipitation, with the CFS solution centering the largest anomalies over the lower Mississippi Valley, the ECMWF over the Deep South, and the more suppressed JMA over the Gulf of Mexico and Florida. Further west, below-median precipitation is favored for the Rio Grande Valley based on long term trends and dynamical model forecasts, though coverage was reduced in comparison to the model forecasts due to the potential for an active southern stream. The potential for weakness in the height field over the Southwest favors above-median precipitation for California and the Great Basin, although the forecast anomalies are fairly small amid a rapidly drying climatology. Dynamical model forecasts were mixed across mainland Alaska, but there was fairly good agreement favoring below-median precipitation across the southern coast and Panhandle regions.
The latest SubX guidance indicates near normal temperatures in the vicinity of Hawaii. Enhanced ITCZ convection across the North Pacific and a pattern favoring moisture entrainment favors above-median precipitation for Hawaii, with model consensus resulting in the highest probabilities across the northwestern islands.
Some may find the below way of looking at things useful and I hope these graphics are not too small to read. I did not make them so you could click on them individually but you can click on the whole graphic and it may enlarge. But I think you get the picture. It has been a rapid onset and demise. When you read these graphics, remember that the older graphics are not the drought conditions that existed then but the change from then until now.

Let’s focus on the change between February 25, 2020 and March 24, 2020, i.e. one month.

Focusing on the Intermountain West

Drought Forecasts
These two forecasts (Monthly and Season) are issued by the same agency but to obtain them you need to access two different links here and here.
Here is the Three-Month Forecast which was issued on March 19, 2020

Here is the Monthly Drought Outlook which was updated on February 29, 2020 and it will be updated on March 30, 2020 and we will report on it then.

Floods
Floods remain a concern.

| Last Week | Current Week |
| |


Wildfires
Our usual graphic is not updating so we have deleted it. Bu updates from this source can be found here.
Current Wildfire Risk. This is a new model that updates daily by NOAA (but not automatically in this article) to show the short-term risk.

Click here to update. Red is high risk, blue is low risk. This graphic updates daily but you have to click on the link provided to get the updates More information can be found here.
This explains the model a bit.

The below graphics will update automatically on February 1 or so. So ignore the commentary for the time being. We will update it shortly.

Looking out another month.


Crop and Animal Husbandry Progress. USDA Executive Briefings can be found here (there was no Executive Briefing this week). NASS reports can be found here. Foreign Intelligence reports can be found here.
There were a lot of NASS reports this week and we did not have time to prepare them for publication. This shows the major reports scheduled. Most are NASS Reports. We report on some of them.
International

A map helps and is not always available and fortunately, it was available this week.

Major Sources of Information
In the box are shown the major resources we use. We will not be using them all each week but the reader is welcome to refer to these resources.
Major Sources of Information Used in this Weekly Report
|
Background Information


The sequence of drought occurrence and impacts for commonly accepted drought types. All droughts originate from a deficiency of precipitation or meteorological drought but other types of drought and impacts cascade from this deficiency. (Source: NDMC)
Source: National Drought Mitigation Center, University of Nebraska-Lincoln


