Written by Sig Silber
Here is the February 20, 2020, NOAA 15-month forecast for CONUS and Alaska including the Early Outlook for March 2020 and forecasts out through May 2021. A major change is forecast within the three-month period with April and May being quite a bit different than March. The overall theme is ENSO Neutral. Tomorrow night we will compare the NOAA forecast to the JAMSTEC forecast.

Please share this article – Go to the very top of the page, right-hand side for social media buttons. Please feel free to share this report with anyone you feel will find it useful.
A. Focus on the NOAA Update
A note about terminology; the deviations from climatology/normal are color-coded but also labeled “A” for more than (above) normal and “B” for less than (below) normal. The area designated EC means Equal Chances of being more or less than normal. In my comments For the shorter-term maps, NOAA uses “N” instead of “EC” as they believe they can be more definitive with respect to shorter timeframes. So the words “warm”, “cool”, “wet”, “dry” should be generally interpreted as being relative to climatology/normal for that location and time of year.
First, we will take a look at the NOAA Early Outlook for March, 2020. It is called the Early Outlook because it will be updated at the end of February. Only the March Outlook will be updated at that time.
Temperature

Precipitation

We have nothing to compare these maps with as NOAA does not in their Update provide a forecast for each of the subsequent two months separate from their three-month forecast. Thus I do not have forecast maps for March from the previous NOAA Report to compare against. And the current month is not over so we can not really compare the forecast for next month against the actual for this month. It is probably best to just try to understand what NOAA is trying to convey about March*. For Temperature, it is mostly warm in the extreme Southwest and northern Alaska. There is a very large cool anomaly stretching from the Rockies to the Atlantic Ocean but not including the Northern Tier or Florida. With respect to precipitation, northern and western Alaska is wet but the Panhandle is dry. The southern part of the Gulf Coast states are wet, the Upper Mississippi States are dry and the West Coast is dry including most of Arizona. In general, the probabilities associated with the anomalies are fairly low indicating low confidence that there is going to be a lot of deviation from climatology in March.
* compared to normal/climatology for the indicated time of the year.
Visual Consistency Testing.
It is useful to see how the month forecast fits with the set of shorter forecasts that we have. The first map covers mostly February (so only two of the three maps are really useful for this purpose) and the third map only extends the coverage through the first twenty days of March. The Seasonal Outlook was issued late this month since the third Thursday fell on February 20, 2020. I think the latest it can be is the 21st of a month. Twenty days of shorter forecasts is still not a solid basis for doing this visual consistency testing but it is what we have to work with and it is more than usual. It may tell us how the last eleven days of the month should differ from the first twenty days for the full-month forecast to be accurate.
First Temperature
 |  |  |
| The new monthly forecast is to the right. Does it appear to be reflective of the parts of the month for which we have forecasts? |
| The full month forecast does not fit that well with the 8 – 14 Day and Week 3 – 4 forecasts which only covers twenty days of March as of when we published this article. We have to assume that the last eleven days are forecast to be cool in the area where the large cool anomaly is shown. We will also revisit this question at the end of February when the March forecast is updated. |
And then Precipitation
 |  |  |
| The new monthly forecast is to the right. Does it appear to be reflective of the parts of the month for which we have forecasts? |
| The full month forecast does seem to fit fairly well with the 8 – 14 Day and Week 3 – 4 forecasts which only covers twenty days of March as of when we published this article. We will also revisit this question at the end of February when the March forecast is updated. |

Now we consider the three-month Outlook.
Notice that the three-month periods are abbreviated e.g. March/April/May is shown as MAM. You will see such abbreviations often in this report.
Prior Temperature Outlook for MAM 2020

New Temperature Outlook for MAM 2020

Prior Precipitation Outlook for MAM 2020

New Precipitation Outlook for MAM 2020

Now let us focus on the long-term situation.
First Temperature
Prior 14 Month Temperature Outlook: MAM 2020 – FMA 2021

New 14 Month Temperature Outlook: AMJ 2020 – MAM 2021

To compare maps from one release to another, one needs to remember that the new release drops one three-month period and adds a later one. So to make the comparisons one has to shift the new maps to the right one position and that makes the map on the right drop down to become the left-most map in the next level. I do not have a computer software tool for doing that for you so you have to do it mentally. When I do the comparison, I print the two sets of maps and put them side by side and number the same three-month maps 1, 2, 3,…..,11 in both sets of maps to make it easier for me to easily compare the same three-month period in the new with the previous forecast. One uses the same procedure to compare the precipitation maps. Based on this procedure, I conclude that:
Now Precipitation
Prior 14 Month Precipitation Outlook: MAM 2020 – FMA 2021

New 14 Month Precipitation Outlook: AMJ 2020 – MAM 2021

If you want larger versions of each map (temperature and precipitation) you can find them here. And then each of those maps can be clicked on to further enlarge them.
Sometimes it is useful to compare the three-month outlook to the forecast for the first of the three months. It shows how much the pattern changes over the three-month period.

One can mentally subtract the First-Month Outlook from the Three-month Outlook and create the Outlook for the last two months in the three-month period.
*The concept is that the probabilities of a deviation from climatology in the First Month and the combined Month Two and Three forecast that one derives must average out to the probabilities shown in the three-month maps.
Below is the NOAA Discussion (slightly reorganized) released by NOAA on February 20, 2020. Headings that are “Initial Cap” only rather than all caps were added by the Author of this Update Report for clarity. Also, we have organized the sequence of the sections of NOAA Discussion to first present the Atmospheric and Oceanic Conditions and then the Initial Month (March), the new NOAA Summary for MAM, and finally the remainder of the 15-Month Forecast.
CURRENT ATMOSPHERIC AND OCEANIC CONDITIONS
ENSO-neutral conditions persist across the tropical Pacific Ocean. The Oceanic Nino Index (ONI) was at 0.6 degrees C for Nov-Dec-Jan of 2019-2020. The weekly Nino 3.4 index value peaked at +0.8 degrees C during the fall, but this was largely related to the Madden-Julian Oscillation (MJO). The current weekly values for Nino3.4 is 0.1 degrees C, which is slightly lower than most values for the past 3 months, and likely an short-term dip as intraseasonal variability has resulted in a slight increase in trade winds near 140W. Subsurface waters are warmer than normal from about 170E to 140W down to 150 meters, with the only reservoir of colder than average waters west of 170E and centered at approximately 150 meters below the surface. OLR anomalies show enhanced precipitation right along the Date Line, with suppressed convection over the Maritime Continent. From about 160W to the eastern Pacific, anomalies in OLR are very small.
According to the National Snow and Ice Data center, ice extent was below average over parts of the Bering Sea, the Sea of Okhotsk, and the East Greenland Sea at the end of January. Sea surface temperatures along the southwest coast of Alaska were also below normal in the latest pentads, but those are highly variable this time of year.
PROGNOSTIC DISCUSSION OF SST FORECASTS
The CPC SST consolidation forecast, which includes three statistical forecasts along with the CFS model, predicts a continuation of ENSO-neutral conditions through the early spring before the CFS and statistical models slightly diverge. The North American Multi-Model Ensemble (NMME) ensemble mean forecast for the Nino-3.4 SST anomaly is near +0.5 degrees C through March, then a slow decline through the neutral region to near -0.5 degrees C by Sep 2020, though the spread of the ensemble means by Sep 2020 ranges from -1.2 to +0.3 degrees C, so uncertainties are large.
30-DAY OUTLOOK DISCUSSION FOR MARCH 2020
The March temperature and precipitation outlooks depict limited forecast coverage and only modestly elevated probabilities from that expected from climatology due to above-average uncertainty – a result of a number of factors. This is true for both monthly mean temperatures and monthly total precipitation amounts and for both above- and below-normal tercile categories.
In the Tropics, the MJO, although active, is being affected by other subseasonal coherent tropical variability (i.e., atmospheric Kelvin wave and Equatorial Rossby wave activity), so forecasts of its evolution by common guidance (e.g., RMM index) are non-canonical and varied in nature. Constructive and destructive interference of these other tropical modes can make it difficult to have high forecast confidence and fully interpret observed and forecast amplitude and eastward propagation of the main MJO envelope. Most RMM forecasts, however, do indicate varying degrees of forecast amplitude and eastward propagation over the next few weeks across the Pacific Ocean into the Western Hemisphere. In fact, at the current time, a strong enhanced convective anomaly has been in place across the west-central Pacific Ocean along the equator. The March temperature and precipitation outlooks do utilize some MJO predictive information from both lagged and conterminous composite as well as a multi-linear regression forecast tool that targets temperature and precipitation contributions from the MJO.
Week 3-4 dynamical model guidance from both the CFS and ECMWF monthly prediction systems are also utilized to aid prediction during the first half of March as well as monthly integrations from the CFS for the entire month of March. The monthly NMME forecasts are not considered due to considerably outdated initial conditions used for their March predictions. The higher than average uncertainty (potential and strength of any teleconnection from the MJO and weak signals from both statistical forecast tools and dynamical model guidance results in a large region of “Equal Chances” (EC) across the forecast domain for both temperature and precipitation.
Temperature
Above-normal monthly mean temperatures are favored for parts of northern and western Alaska due to strong long term positive temperature trends primarily linked to reduced sea ice coverage in nearby waters. Some signals from dynamical model guidance support favored above-normal temperatures for California, Nevada and parts of neighboring states at only modest probability departures from the region’s climatological odds. Both the MJO and dynamical model guidance serve as the forecast basis for elevated odds of below-normal temperatures for the central and southern Plains, Ohio Valley, Southeast and mid-Atlantic regions.
Precipitation
For precipitation, prospects of a pattern favoring below-normal temperatures across parts of the eastern CONUS also favors below-normal precipitation for parts of the central and northern Mississippi Valley, Ohio Valley and Great Lakes. The most likely region of enhanced odds for above-normal precipitation resides along the Gulf and south Atlantic coasts. Forecast ridging and a potential northward shifted storm track favors below-normal precipitation for Arizona and the West Coast as well as the Alaska Panhandle. Consensus of dynamical model guidance favors above-normal monthly total precipitation amounts for northern and western Alaska during March 2020.
SUMMARY OF THE OUTLOOK FOR NON-TECHNICAL USERS (the focus here is on MAM the first three months)
ENSO-neutral conditions continue across the equatorial Pacific Ocean, as represented in current oceanic and atmospheric observations. The official CPC ENSO forecast indicates that ENSO-neutral is most likely through the Northern Hemisphere spring 2020 (~60 percent chance) and summer 2020 (~50 percent chance).
Temperature
The March-April-May (MAM) 2020 temperature outlook favors above normal temperatures from central and southern portions of the West, across the southern tier of the CONUS, northward to Great Lakes, and to the East Coast states. Increased chances for below normal temperatures during MAM are forecast across the northern Great Plains. Equal chances (EC) of above, near, or below normal temperatures are indicated across the remainder of the CONUS. Above normal temperatures are favored throughout much of Alaska, with the highest odds from the Seward Peninsula to about Point Lay.
Precipitation
The MAM 2020 precipitation outlook indicates enhanced probabilities of above normal seasonal total precipitation amounts from the Mississippi Valley to the East Coast. West of the Mississippi Valley, above normal seasonal total precipitation amounts are favored from the Northern Rockies to the Central Plains. Below normal seasonal precipitation amounts are favored across southwestern Oregon, California, southern Nevada, Arizona, New Mexico, and parts of West Texas. Equal chances (EC) are forecast among areas where seasonal precipitation amounts are expected to be similar to climatological probabilities. In Alaska, there are elevated probabilities of above normal seasonal total precipitation amounts from about the Alaska Range northward to the Arctic Coast. Elevated odds for below normal seasonal total precipitation amounts are confined to the southernmost portions of the Alaska Panhandle, while EC are indicated for southern coastal areas and Aleutians.
BASIS AND SUMMARY OF THE CURRENT LONG-LEAD OUTLOOKS
PROGNOSTIC TOOLS USED FOR U.S. TEMPERATURE AND PRECIPITATION OUTLOOKS
The temperature and precipitation outlooks for MAM 2020 were based on dynamical model guidance. Statistical tools that include global SST anomaly patterns, a canonical correlation analysis that uses the evolution of SST and sea-level pressure as predictors, and trends . Additionally, statistically calibrated combinations (consolidations, and consolidations via bridging techniques) of those tools were used throughout the forecast period. Long-term climate trends were considered for all leads but were relied on more heavily from autumn 2020 through the next winter 2020-21. Implied soil moisture conditions, corresponding with predicted precipitation patterns were also considered during Summer 2020.
PROGNOSTIC DISCUSSION OF OUTLOOKS – MAM 2020 TO MAM 2021
TEMPERATURE
The temperature outlook for MAM 2020 relied on dynamical model guidance and the consolidation of SST-CA, CCA, NMME, and trends . The resultant outlook is slightly cooler than the consolidation of those tools as intraseasonal variability is likely to tilt much of March toward below normal temperatures. Shorter-term vartiability and trends favor below normal temperatures for the Northern Plains. Those intraseasonal variations are likely to reverse later in the first 3 months, which would also coincide with some stronger trends for above normal temperatures in the Northern Plains, so odds for below normal temperatures are modest, with more increased uncertainty south and east of where the early cold is predicted. Trends and most dynamical models favor above normal temperatures from the Mid-Atlantic, to the Gulf Coast and westward to the Four Corners and Pacific Coast states. Progressively earlier ice melt out in the spring heavily favors above normal temperatures, but this outlook has lower probabilities than recent trends would support, as the sea ice is near normal along the west coast of Alaska.
Through late spring and early summer 2020, trends favor above normal temperatures across the Southwest, peaking in JJA. Equal chances are indicated across the Northern and Central Plains as trends are weakest in this area Additionally, the late spring precipitation outlooks favor above normal precipitation, which, during the warm season, is negatively correlated with temperatures in the following months, especially across the Great Plains and Midwest.
For the remaining seasons, ASO 2020 through MAM 2021, the seasonal outlooks were heavily tilted toward historical climate trends , as incorporated into the statistical consolidation tool (which does not include the NMME guidance).
PRECIPITATION
The precipitation outlook for MAM 2020 favors above normal seasonal total precipitation from the Mississippi Valley to the East Coast, with the highest probabilities from the Tennessee Valley to the Ohio River Valley. Trends and dynamical model output with a largely progressive pattern favor wetness for the aforementioned region. The potential for a dry March limits the odds for above normal precipitation for the Great Lakes, but the March signal is likely related to the intraseasonal cold signal, and likely to reverse throughout the period. Persistent ridging along the West Coast during March favors below normal precipitation for the southwest, as April and May are largely dry months, while that signal weakens in California where April remains wet. Models again favor below normal precipitation for Oregon, but then little to no signal for Washington, so EC is indicated there. Ridging over the eastern Pacific is likely to steer storms into mainland Alaska, favoring above normal precipitation for interior Alaska and drier than normal conditions for the southern Alaska Panhandle.
Through late spring, below normal precipitation is favored from the Pacific Northwest to the Four Corners region, aligning with the northward progression of the trend signal. The northern Plains and east of the Mississippi are favored to remain wetter than normal, consistent with model guidance and potential for persistent early wetness to feedback into later months. By the end of the summer, the precipitation outlooks largely resemble trends , which would be the dominant mode represented through next autumn if the ENSO neutral conditions persist as the NMME models indicate. For next winter, trends dominate the predicted patterns.
New Seasonal Drought Forecast

You can see that drought it expected to expand along the West Coast and also the Rio Grande Valley. We discussed this last night in our Weather Impacts on Economic Activity Report which can be accessed here.
ENSO Considerations
Since the ENSO phase is not likely to change very much and since NOAA does not make it clear which forecasts for the NOAA Phase they rely on, we have decided to greatly abbreviate our coverage of that topic for the time being but it is discussed well in the NOAA Discussion so you can read their thoughts on the matter there.
Here is the NOAA Proprietary ENSO Model which they pretty much do not use although I think it is mentioned in the discussion as having played a role this month.

The below is probably the probabilistic forecast NOAA used.

But there was an update on WEDNESDAY February 19 so that adds confusion to understanding what information NOAA used in making their forecast.

Let’s take a look at the subsurface along the Equator. First I show the graphics for early- and mid-January.
| January 3, 2020 | January 13, 2020 |
 |  |
Here is the new version

Let’s look at the Australian BOM Nino 3.4 Forecast

And the JAMSTEC evaluation
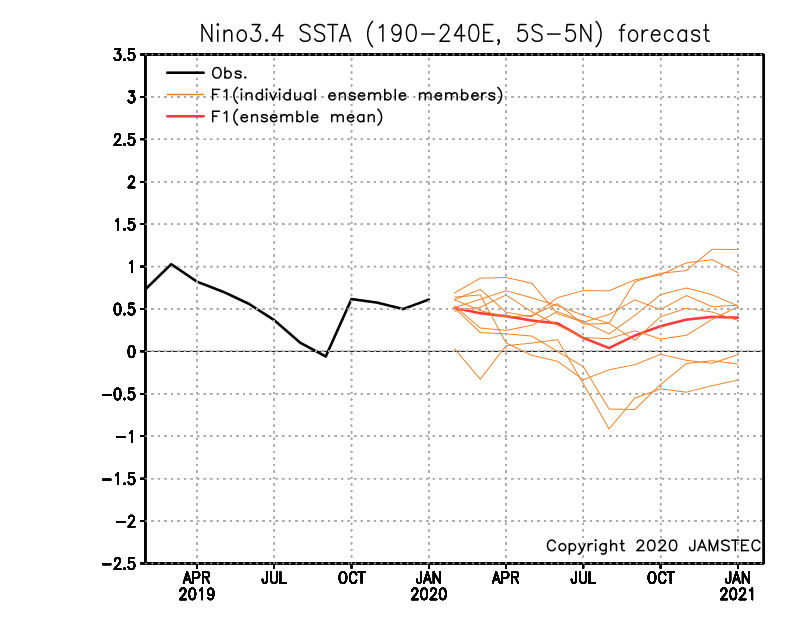
* Things have gotten a lot more complicated with JAMSTEC. They have upgraded their SINTEX I Model to SINTEX II and beyond. This is the first time I have seen that. The above is the older SINTEX I forecast. The SINTEX II forecast is substantially closer to true Zero on the Nino 3.4 scale. I am waiting a month or two before switching over to the new and improved model. It is called “avoiding the bleeding edge”.
Here is the short JAMSTEC discussion. We will discuss it a bit more on Sunday. For our purposes tonight I have only highlighted the comments that apply to Alaska and CONUS.
Feb. 17, 2020 Prediction from 1st Feb., 2020 ENSO forecast:
As predicted earlier, the El Nino Modoki-like state has been observed. The SINTEX-F predicts that the tropical Pacific will return to a neutral-state from summer.
Indian Ocean forecast:
The strong positive Indian Ocean Dipole disappeared. Now, the whole tropical Indian Ocean is warmer-than-normal. The model predicts the evolution of another moderately positive Indian Ocean Dipole from boreal summer. There is a large uncertainty in the prediction at present due to the large spread in the prediction plumes of the dipole mode index.
As predicted earlier, the Ningaloo Nino off the west coast of Australia disappeared.
The strong negative Indian Ocean Subtropical Dipole reached the peak in December 2019, and then started to decay in January 2020. The model predicts that it will persist until late austral summer.
Regional forecast:
On a seasonal scale, the SINTEX-F predicts that most part of the globe will experience a warmer-than-normal condition in boreal spring, except for eastern U.S.A and eastern Brazil. In boreal summer, almost all part of the globe will still experience a hotter-than-normal condition, except for northwestern Russia.
As regards to the seasonally averaged rainfall in boreal spring, a drier-than-normal condition is predicted for western U.S.A., northern Brazil, most part of Southeast Asia, Indonesia, Philippines, and northern Australia. In contrast, eastern U.S.A., eastern Brazil, East Africa will experience a wetter-than-normal condition. In boreal summer, a wetter-than-normal condition is predicted for southern part of West Africa, some parts of Southeast Asia, Philippines. In contrast, northern Brazil, eastern Australia, around Guinea, northeastern China, and Indonesia will experience a drier-than-normal condition. Some of them will be partly due to the expected positive Indian Ocean Dipole.
The model predicts most part of Japan will experience warmer-than-normal condition in the coming spring as a seasonal average. In summer, most part of Japan (except for northern part) will be slightly warmer and drier-than-normal.
B. Conclusion
There were a number of fairly minor changes to the three-month forecast and we did not have a prior one month forecast to compare to but March is forecast to be considerably different than April and May. This month the thinking is that the MJO might become a bit more active and impact March.
The rest of the forecast is pretty much canonical ENSO Neutral plus long-term trends which in some circles is called Global Warming.
.


