Written by Sig Silber
The current economic impacts of weather are complicated. This week our featured Special Topics include the Thursday ENSO Update, the January state rankings based on temperature and precipitation, the development of probably a temporary snow drought condition in the Sierra Nevada juxtaposed with flooding from the Mississippi River east. Mud season may be starting early. And of course, we have our full set of regular weekly reports (including some recent crop reports) and, since we are now publishing on Fridays, our intermediate-term weather forecast covers 28 days and the first 14 days of the forecast updates automatically daily – so you can check it each day.

Please share this article – Go to the very top of the page, right-hand side, for social media buttons. Please feel free to send this article to anyone who you think might benefit from reading it.
Directory
Readers can scan through this article or jump to where they want to go via the links to the right. Directory links are under construction. Check back for completion. |
|
Special Topics for this Week
ENSO Update


State Rankings
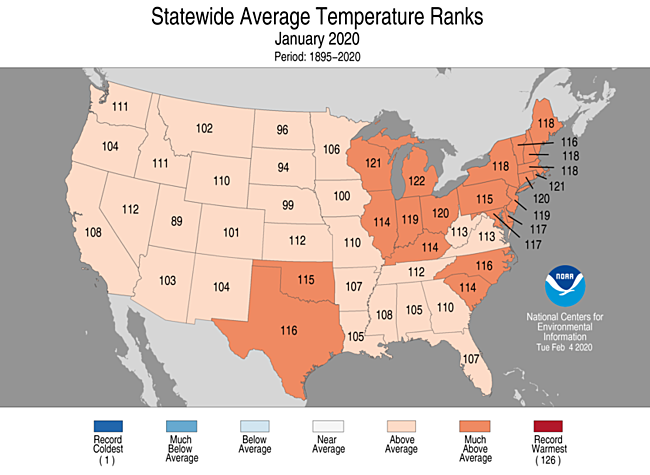

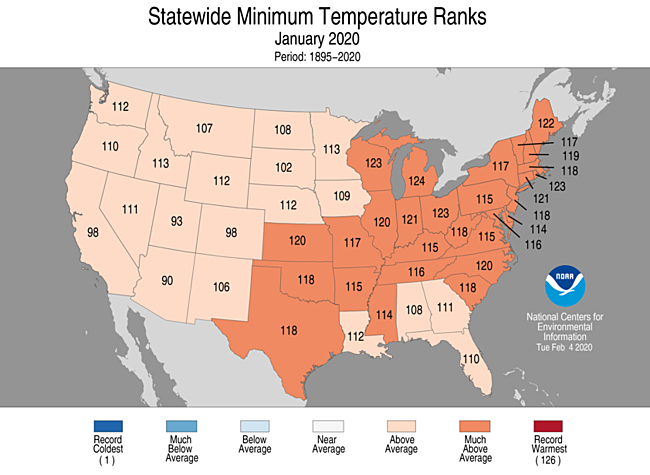
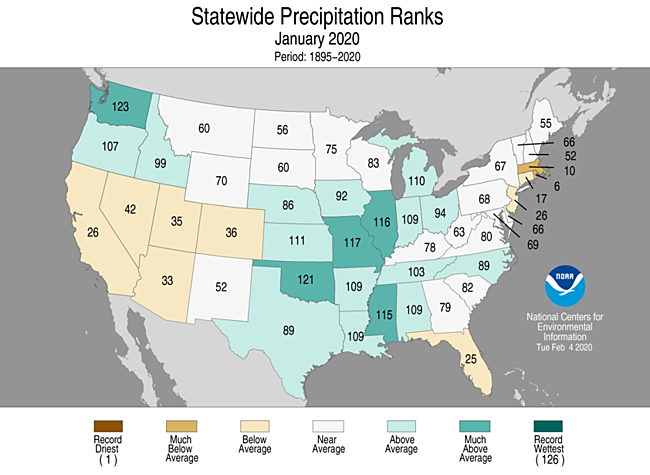
Sometimes Climate Divisions sheds additional light on the subject.

Snow Drought


looking at California

But some places are too wet.


Current Drought Conditions
Now we take a look at Thursday’s U.S. Drought Monitor Report.
The U.S. Drought Monitor is a comprehensive way of understanding the drought situation for the U.S. It is issued every Thursday and reflects the conditions as of the prior Tuesday. Drought is defined as a moisture deficit bad enough to have social, environmental or economic effects. Thus, more factors than recent precipitation are considered and more information on how it is done is found at the end of this report.
United States and Puerto Rico
U.S. Affiliated Pacific Islands and the U.S. Virgin Islands.

And this shows the U.S. including Alaska, Puerto Rico, and Hawaii.

Below is the map for just CONUS.
 |
 |
| Last Week | This Week |
| |

Some might find this animation of twelve weeks of change useful;

The graphic below shows the one-week change in drought intensity. Yellow is bad. Green is good.
|

Now we show the week to week change information by region. The yellow is where the level of drought has been raised. The green is where the level of drought has been lowered.
 |
Improvement in Colorado and Wyoming. A bit of degradation in western Kansas |
 |
| No Change |
 |
Slight improvement in the Delmarva Peninsula |
 |
Dry in Southern Texas but wetter to the north, west, and east. |
 |
| Almost all improvement with most occurring along the Mid-Atlantic Coast. |
 |
| Dry from Oregon down to Nevada and much of California and wet to the east especially to the north. |
Here is the Discussion that was issued with the Drought Report. The Regional Headings can be clicked on to obtain maps and statistics.
This Week’s Drought Summary
This Week’s Drought Summary
Heavy precipitation affected large parts of the Nation last week, with heavy snow in the central Rockies bringing some relief to the dry areas there. The broadest area of heavy precipitation stretched from the Middle Atlantic States southwestward into the Lower Mississippi Valley and the Southeast. At least 2 inches fell from the Ohio River to near the Gulf and southern Atlantic Coasts, with 7 to 10 inches measured across the much of the interior Southeast. On the other side of the 48 states, heavy precipitation covered parts of the Northwest. Near the coast in Washington and northern Oregon, most locations recorded at least 4 inches of precipitation, with isolated amounts to 10 inches in higher elevations. Just to the east, along the Cascade Range from central Oregon northward, a broad swath received at least 5 inches of precipitation, and most of a strip through central Washington reported 10 to locally 15 inches. Well inland, in the central and northern Rockies, precipitation was largely elevation-dependent,. The more elevated regions observed 2 to 5 inches, with lesser amounts in adjacent areas of lower elevation. Heavier amounts more broadly covered central Idaho and adjacent areas in Washington and Oregon, with totals of 4 to locally 8 inches common. It was another week of above-normal temperatures in the East and part of the interior Northwest, while subnormal readings were recorded in the central Rockies where the heavy snowfall dominated the week. Temperatures were 10 to 15 degrees F warmer than normal in the east-central States and part of the interior Southeast, and most sites east of the Mississippi River were at least 4 degrees F above normal. Many locations across the Country averaged 2 to as much as 5 degrees F above normal since mid-November 2019, especially east of the Mississippi River and the interior Rockies and Far West.
Northeast
Between 1.5 and 3.0 inches of rain fell on D0 area on the Delmarva Peninsula, wiping out the abnormal dryness that had been there, and leaving the Northeast free from any Drought Monitor designation. The last 60 days brought somewhat below normal precipitation to several areas across northern Pennsylvania, New York, and New England, but given the time of year and lack of observed impacts, D0 does not seem warranted at this time.
Southeast
The heaviest precipitation fell away from the Gulf and Atlantic Coasts, but relatively moderate amounts were sufficient to remove the D0 area along the Carolinas Coast, though some mild moisture deficits remain in a few spots. Farther south, moderate to heavy rains eliminated D0 in both southern Georgia and southwestern Alabama, as well as the western sides of the D0 and D1 areas along the Florida Panhandle, where streamflows increased. East of the Apalachicola River, dryness and drought remained in eastern sections of the Florida Panhandle. The area of moderate drought recorded 5 to 8 inches below normal rainfall in the last 3 months. In addition, abnormal dryness was expanded into much of the northern Florida Peninsula where the last 30 days brought only 0.5 to 1.0 inch of rain (among the driest 5 percent of historic occurrences there).
South
Abundant rainfall eliminated D0 in relatively small parts of southeastern Louisiana and southernmost Mississippi, but most areas of dryness along the central Gulf Coast missed the bulk of the precipitation, keeping most of the D0 area unchanged. Farther west, moderate to heavy precipitation (1 to locally 4 inches) eliminated almost all dryness across western Louisiana and southwestern Arkansas, and induced improvement across the D0 to D2 conditions in eastern Texas as well. In addition, moderate rains in north-central Texas as well as the Red River Valley removed D0 from those regions, but left moderate drought largely intact across southwestern Oklahoma. But farther south, most areas of dryness and drought across central and southern Texas received little if any precipitation, prompting areas of drought intensification and expansion. Severe drought now covers large portions of central and southwestern Texas, and the D3 along parts of the Rio Grande Valley expanded into neighboring counties. Over the last 90 days, precipitation deficits reached 5 to 7 inches across interior eastern Texas, and less than 25 percent of normal has fallen around the areas of extreme drought in southwestern Texas.
Midwest
Heavy precipitation (over 2 inches) was restricted to the Ohio Valley, with most of the region recording a few tenths of an inch, if any. Still, longer-term surplus moisture covers most of the region, and no areas of abnormal dryness or drought have been identified.
High Plains
Most of the region saw little to no precipitation this past week, leaving the Drought Monitor unchanged in south-central Kansas, and prompting some limited expansion of the D0 to D2 conditions in western Kansas and eastern Colorado. Farther west, most lowland areas received only light precipitation, but heavy snows blanketed the higher elevations from central Colorado into western Wyoming. Snowpack is now near to above normal for this time of year in western Wyoming, and considerably above normal from central Wyoming southward through most of the higher elevations in central Colorado. This prompted removal of the D0 area that had covered southwestern Wyoming. More limited improvement was noted in the D0 and D1 areas in central and western Colorado, where dryness is more entrenched.
West
Moderate to heavy precipitation in the Northwest and parts of the northern Intermountain West boosted snowpack enough improve drought designations in parts of the region. In Idaho, D0 was retracted to cover only the central part of the state, with some D1 remaining across the interior where snowpack remained unfavorably low (10th to 20th percentile historically for this time of year). A bit of abnormal dryness was also pulled out south-central New Mexico and northwestern Utah, but an unremarkable week kept dry conditions essentially unchanged across the rest of the Four Corners States outside Colorado. Across Nevada and California, however, dryness and drought intensification prevailed. On the 60-day time scale, markedly low precipitation totals (among the driest 5 percent of historical occurrences) covered most of a swath across central sections of California and Nevada, and 30-day amounts were less remarkable but still significantly below normal across most of the 2 states, outside the far northern and southern tiers. Since mid-December, less than half or normal precipitation has fallen from central and southern Nevada westward across most of California, with less than 25 percent of normal observed in the southern Sierra Nevada and adjacent central valleys. Central and southern sections of coastal California accumulated 3 to 8 inches less precipitation than normal during this period while deficits of 5 to 12 inches piled up in the Sierra Nevada. Precipitation summed over the past 6 months is notably below normal over most of both states. In particular, central and southern parts of the Sierra Nevada accumulated a deficit of 9 to locally near 20 inches of precipitation (about half of normal), and snowpack is less than 60 percent of normal for the date in the central and southern Sierra Nevada. The confluence of all these factors led to the introduction of moderate drought in the central and southern Sierra Nevada, and the adjacent central valleys. The state had been drought free since the first few days of December. Farther east, D0 was broadly expanded to cover part of northeastern California and a broad swath across much of interior Nevada. The last 6 months brought less than half of normal precipitation to this region, but with lower normals than farther west, accumulated deficits were less dramatic (generally 3 to locally 6 inches).
Alaska, Hawaii, and Puerto Rico
Moderate to heavy rain erased the southern tier of the dry region analyzed last week, but most sites received considerably less, keeping D0 intact farther north.. 60-day rainfall is at most 75 percent of normal in the abnormally dry area
The drought areas in Maui and the Big Island reported substantial rainfall this past week, but impacts have not tangibly improved at this time, so the depiction remains unchanged from last week
Generally light precipitation fell on the dry areas in Alaska, keeping the D0 area unchanged.
Pacific Islands
This week in American Samoa, over 8 inches of rain was recorded, which continued the recent wet and drought-free conditions.
Recent dryness on Palau gave way to over two inches of rain this week. Despite the wet week, short-term moderate drought continues here.
No changes were made to the U.S. Drought Monitor depiction in the Federated States of Micronesia this week. On Yap, only 0.13 inches of rain fell this week (with two days of missing data), and an overall dry trend since Christmas resumed after 3.88 inches of rain fell last week. Therefore, short-term abnormal dryness continued there. Only 0.17 inches of rain fell in Ulithi this week, but given the 9.24 inches of rain that fell in January, abnormal dryness has not developed. On Woleai, 1.82 inches of rain fell, a welcome change after only 0.12 inches last week, but still below the weekly minimum, and short-term abnormal dryness continued there. No data was available for Fananu this week, so no drought monitor category was assigned there. This week was drier on Chuuk, with only 0.35 inches of rain falling (with one day’s worth of data missing). Given the wet conditions in January and particularly December, though, no abnormal dryness or drought is taking place there. Only 0.07 inches of rain fell on Lukunor this week (with one day missing), so short-term abnormal dryness continued there. No rain fell on Nukuoro this week, marking the second consecutive week in which less than two inches of rain fell. However, 17.63 inches of rain fell in January, so the dry last couple weeks have not degraded conditions to abnormal dryness. This week on Kapingamarangi, 1.05 inches of rain fell, marking the eighth week out of the last nine during which less than two inches of rain fell, and short-term abnormal dryness continued there. Only 0.56 inches of rain fell this week on Pohnpei, but since conditions were wet the last few weeks, abnormal dryness has not developed. Only 0.3 inches of rain fell this week on Pingelap, though over three inches of rain fell each of the previous two weeks, so drought-free conditions continued there. On Kosrae, 0.38 inches of rain were recorded this week, with three days of data missing, and drought-free conditions continued.
Short-term drought or abnormal dryness continued on Saipan, Rota, and Guam this week. Only 0.12 inches of rain fell on Saipan, after only 2.8, 1.2 and 1.16 inches fell during November, December, and January, respectively, and abnormal dryness degraded to short-term moderate drought there. On Rota, after only 0.39 inches of rain fell this week, short-term dryness continued. On Guam, short-term dryness continued after 0.11 inches of rain fell.
No changes were made to the U.S. Drought Monitor depiction in the Republic of the Marshall Islands this week. Short-term moderate drought continued on Kwajalein, where only 0.17 inches of rain fell this week. Short-term abnormal dryness continued on Ailinglapalap this week, where no rain was recorded this week (with one day’s data missing). On Jaluit, short-term abnormal dryness persisted, as only 0.02 inches of rain were measured (with one day of missing data). On Utirik, 0.47 inches of rain fell, with 2 days missing from the record this week, and short-term moderate drought continued. On Wotje, no rain was recorded (with one day missing) this week, and short-term abnormal dryness continued. Short-term abnormal dryness continued this week on Majuro, where only 0.07 inches of rain was recorded (with two days missing). No rain was recorded on Mili this week (with one day of missing data), but due to a very wet October-January period, abnormal dryness has not developed there.
Virgin Islands
No changes were made to the U.S. Drought Monitor depiction in the U.S. Virgin Islands this week. Groundwater has been making a slight recovery on St. Croix over the last month and a half, though moderate long-term drought continues there due to 6-12 month rainfall deficits. Neutral or wet conditions at most precipitation time scales continued on St. Thomas and St. John this week.
Looking Ahead
During the next 5 days (February 13 to 17), the pattern is expected to be similar to last week, but with less extreme precipitation amounts. Still, over an inch is expected in a swath from southeast Louisiana to the upper Ohio River Valley, with a stripe of 1.5 to 2.5 inches expected from east-central Mississippi through northwest Alabama, central Tennessee, and southeast Kentucky. This, however, will be enough to exacerbate and already-soggy situation there. To the west, precipitation should again be orographically dependent. The higher elevations from central Colorado northwestward through the northern Intermountain West are expecting 1 to locally near 3 inches of precipitation, with the higher amounts most prevalent in the lower Idaho Panhandle. Farther west, moderate to heavy precipitation is expected along both the Pacific Coast and Cascade Mountains from central Oregon northward. Between 1.5 and 4.0 inches will douse many areas along the coast, and a strip through the middle of the Cascades can expect 2 to 5 inches. Meanwhile, nearly all areas of dryness and drought from the southern half of the Plains to the Pacific Coast will see less than 0.2 inch, with most sites recording little or none. Areas from the northern Plains and western Great Lakes southward into the middle Mississippi Valley should average colder than normal during this period, and subnormal daytime highs are expected along most of the northern tier of states. Across most of the western, southern, and eastern parts of the country, daytime highs should average near normal but nighttime lows are expected to remain above normal.
In the extended range forecast for the ensuing 5 days (February 17 to 21), odds favor surplus precipitation across the southern half of the Plains and from the Mississippi Valley eastward to the Atlantic Coast. Florida is an exception, with slightly enhanced chances for subnormal precipitation noted on northern and central parts of the Panhandle. Wetter than normal weather is also favored in much of the Pacific Northwest and Idaho, but enhanced chances for subnormal precipitation exist in the dry areas from Wyoming and the western Four Corners region to the Pacific Coast. The largest tilt of the odds toward dryness will be centered across California. Meanwhile, the mild winter is expected to continue from the lower Mississippi River, lower Ohio Valley, and eastern Great Lakes to the Atlantic Seaboard, except northern New England. Meanwhile, colder than normal conditions seem more likely through the southern half of the Plains, and most of the Rockies and Intermountain West. Wetter than normal weather is favored across the south-central and southeastern parts of Alaska, with odds tilting toward colder than normal weather in south-central parts of the state.
And shifting to the Alaska and CONUS Intermediate-Term Weather Forecast
 |
|
|
|


And then Precipitation
|
|
|


Here is the discussion that was released with the Week 3 – 4 forecast today.
Week 3-4 Forecast Discussion Valid Sat Feb 29 2020-Fri Mar 13 2020
The incipient global tropical convective pattern is complex, with areas of enhanced convection observed both over the eastern Indian Ocean and near the Date Line. The latest RMM-based MJO index, which serves as a predictor for the Week 3-4 multiple linear regression (MLR) statistical forecast, has responded to the latter convective signal, with a West Pacific (Phase-6) projection. Despite this signal, however, the future evolution of the MJO signal is uncertain, so lagged teleconnections to the extratropics are difficult to discern at this time. A pronounced westerly wind burst is ongoing near the Date Line, and this feature may generate an oceanic Kelvin wave that allows warm water to move eastward over the next month or so. While this activity is unlikely to play a substantial role in the global circulation during the Week 3-4 period, it may play a role in the broader Boreal Spring time frame.
Dynamical model 500mb height anomaly forecasts for Week 3-4 do not show a substantial change from the persistent positive AO structure observed since the beginning of the calendar year. The CFS, ECMWF, and JMA all show pronounced ridging over the North Pacific, particularly south of the Aleutians, with below-average heights over the Arctic and extending over Greenland and to some extent over Canada. This pattern suggests that the CONUS would be vulnerable to cold air intrusions, but the positive NAO feature over the North Atlantic would make such outbreaks transient in the East. All three dynamical model systems depict a weakness in the height field over the Southwest, which may provide a conduit for Pacific flow into the U.S., particularly across California. While the CFS shows near- to below-normal heights across most of the CONUS, the ECMWF and JMA maintain a Southeast ridge, which may impact where the focus for enhanced precipitation lies.
The Week 3-4 temperature outlook is based primarily on a blend of the CFS, ECMWF, and JMA solutions, with the statistical contribution fairly weak due to competing (and uncertain) signals from the MJO and long term trends. In a pattern shift, above-normal temperatures are forecast across Alaska as ridging builds to the south. Below-normal temperatures are favored across much of the northern tier of the CONUS, with a southward extension to the Central Plains due to the potential for cold air intrusions from Canada. Dynamical models also favor increased chances for below-normal temperatures across New England. Below-normal temperatures are also slightly favored along the West Coast, which may be due to SST influences. With high uncertainty and a transient pattern favored during the period, equal chances for above- and below-normal temperatures are maintained across much of the rest of the CONUS, while above-normal heights favor above-normal temperatures for the Florida Peninsula.
The area of highest confidence in the precipitation outlook is Alaska, where dynamical models strongly favor enhanced precipitation across the western half of the State and along the North Slope. Below-median precipitation is forecast for the Alaska Panhandle and Pacific Northwest, while Pacific moisture may result in enhanced precipitation for central and southern California and parts of the Great Basin. Further east, the possibility for cold continental airmass intrusions into the central U.S. favor below-median precipitation for the Plains, Great Lakes, and New England. Across the Southeast, a mean frontal boundary is anticipated to set up, with dynamical models favoring the Tennessee Valley (JMA), Appalachians (ECMWF), or the Southeast Coastal Plain (CFS) for enhanced moisture. Based on these
Some may find the below way of looking at things useful and I hope these graphics are not too small to read. I did not make them so you could click on them individually but you can click on the whole graphic and it may enlarge. But I think you get the picture. It has been a rapid onset and demise. When you read these graphics, remember that the older graphics are not the drought conditions that existed then but the change from then until now.

Let’s focus on the change between January 14, 2020, and February 11, 2020, i.e. one month.

Focusing on the Intermountain West

Drought Forecasts
These two forecasts (Monthly and Season) are issued by the same agency but to obtain them you need to access two different links here and here.
Here is the Monthly Drought Outlook which was updated on January 31, 2020.

Here is the Three-Month Forecast which was issued on January 16, 2020

Floods
Floods remain a concern.

| Last Week | Current Week |
| |


Wildfires
Some of the graphics we have been using are not working so we refer you here. The link is to the National Interagency Fire Center. Some of the links may not work because the agencies are doing improvement during the period of low fire activity.
Current Wildfire Risk. This is a new model that updates daily by NOAA (but not automatically in this article) to show the short-term risk.

Click here to update. Red is high risk, blue is low risk. This graphic updates daily but you have to click on the link provided to get the updates More information can be found here.
This explains the model a bit.

The below graphics had not yet updated last week but now they have so we have added the relevant commentary.

Looking out another month.


Crop and Animal Husbandry Progress (We have a few reports this week)


International

A map helps and is not always available and fortunately, it was available this week.

Major Sources of Information
In the box are shown the major resources we use. We will not be using them all each week but the reader is welcome to refer to these resources.
Major Sources of Information Used in this Weekly Report
|
Background Information


The sequence of drought occurrence and impacts for commonly accepted drought types. All droughts originate from a deficiency of precipitation or meteorological drought but other types of drought and impacts cascade from this deficiency. (Source: NDMC)
Source: National Drought Mitigation Center, University of Nebraska-Lincoln


