Written by Sig Silber
The relatively poor Summer harvest is almost complete and we have some late-season reports. We provide the lastest NOAA ENSO Update leading up to the NOAA Seasonal Outlook Update next Thursday. Also included are the State Rankings for November with respect to temperature and precipitation. And of course, we have our full set of regular weekly reports and, since we are now publishing on Fridays, our intermediate-term forecast covers 28 days and the first 14 days of the forecast update daily. The drought situation is reported which right now is minimal.

Please share this article – Go to the very top of the page, right-hand side, for social media buttons. Please feel free to send this article to anyone who you think might benefit from reading it.
Directory
Readers can scan through this article or jump to where they want to go via the links to the right. Directory links are under construction. Check back for completion. |
|
ENSO Update: NOAA Issues this on the Second Thursday of every month. There is nothing much to report but we will do so anyway for good order sake. NOAA will issue their Seasonal Update next Thursday and we will add some detail then. But this is what they reported on Thursday.

Here is the current forecast of probabilities.

when you compare the prior forecast to this forecast.

JAMSTEC is already out with their forecast and NOAA does not seem to pay attention to their proprietary Model so here is the JAMSTEC forecast

here is the view from Australia.

So it should be interesting when NOAA releases their seasonal forecast and when we compare it with the JAMSTEC forecast.
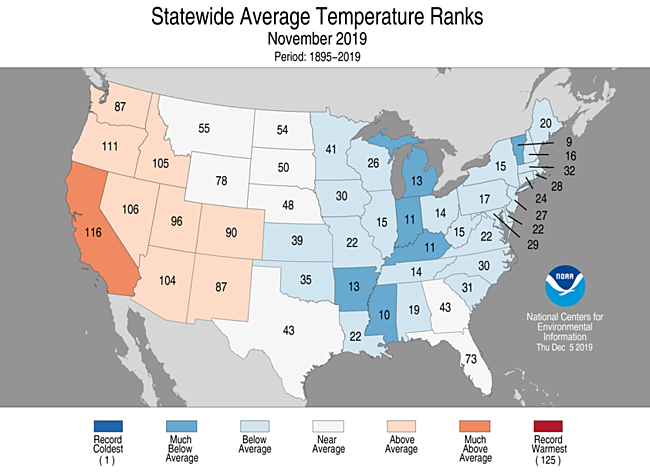
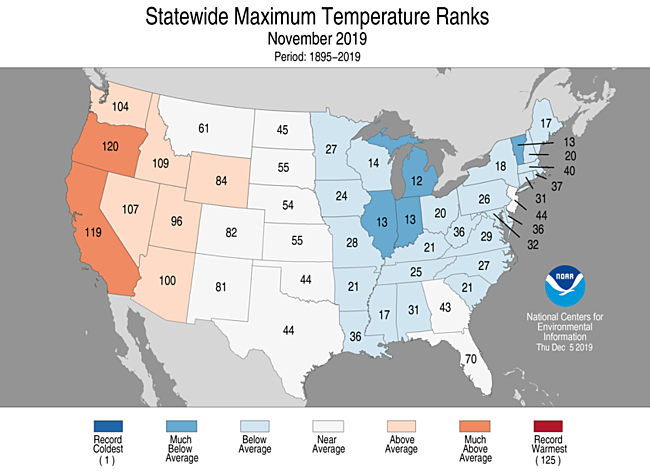
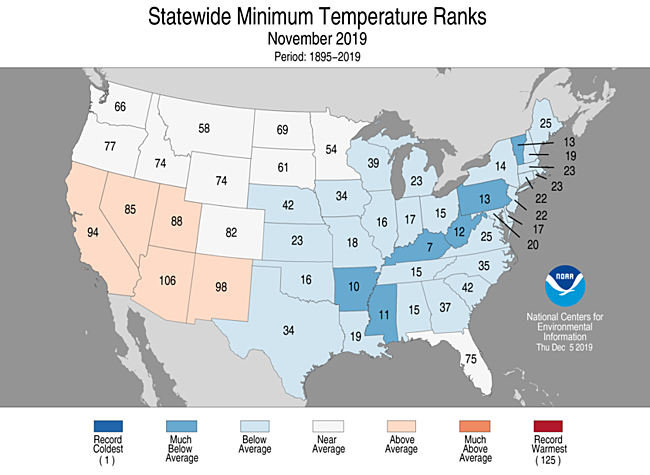
November State Rankings
First Temperature and notice the West Coast and the Mississippi and Ohio Rivers.
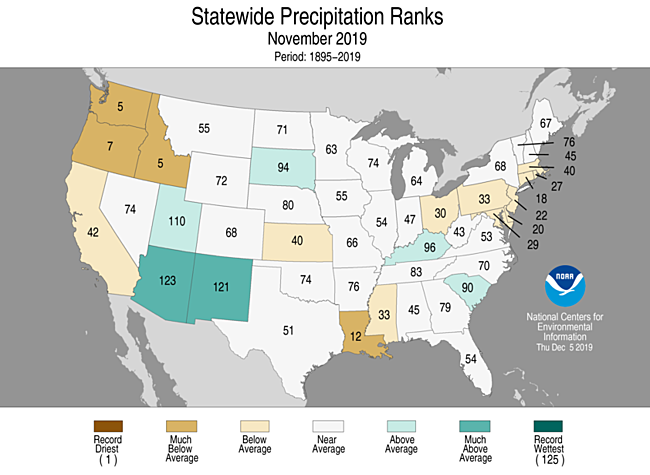
Now precipitation which was fairly normal.
Sometimes looking at Climate Divisions provides a more detailed view.

Harvest Information
And let us talk about corn a bit.

Sunflowers

Cotton

Recent trend


Let’s take a look at Citrus


And shifting to the Alaska and CONUS Intermediate-Term Weather Forecast
 |
|
|
|


And then Precipitation
|
|
|


Here is the discussion that was released with the Week 3 – 4 forecast today.
Week 3-4 Forecast Discussion Valid Sat Dec 28 2019-Fri Jan 10 2020
ENSO-neutral conditions continue across the equatorial Pacific. The primary anomalous tropical convective signal is a tripole of enhanced (suppressed) convection over the western Indian Ocean (Maritime Continent) associated with the positive phase of the Indian Ocean Dipole (IOD), and enhanced convection over the western Pacific. The IOD is helping to generate a Phase-2 projection of the MJO on the RMM-based index, which is causing a strong response in the Week 3-4 statistical guidance, but future evolution of the MJO is highly uncertain. Therefore, while there is a potential for tropical convection to teleconnect to the midlatitude pattern, the extent of this connection is uncertain, especially given the lack of clear forecasts for continued MJO propagation. Lagged impacts from an Indian Ocean MJO typically favor troughing over western North America, and ridging over eastern North America.
500-hPa height anomaly forecasts from the ECMWF and CFS depict very different evolutions from Week-2 into the Week 3-4 period. During Week-2, dynamical model consensus places a mean ridge between Hawaii and the Aleutians, a trough just offshore of the West Coast, and a ridge over the central U.S. The CFS depicts a stronger trough and progresses the feature eastward during Week 3-4, allowing Arctic air to plunge into Canada and possibly the northern tier of the U.S. The ECWMF in contrast flattens the pattern, with the contiguous U.S. dominated by mild Pacific flow. The JMA and Canadian models more closely resemble the ECMWF solution.
The divergent height anomaly patterns between the CFS and ECMWF result in considerable differences in their temperature forecasts, with the CFS showing a potential for cold air outbreaks over the Northern Tier, and the ECMWF maintaining above-normal temperatures across the northern and central CONUS. The ECMWF also persists troughing south of Alaska, which would favor below-normal temperatures, while the other guidance brings temperatures back to near or above normal. Statistical guidance based on the robust Phase-2 projection on the RMM index favors conditions more similar to the ECMWF and JMA, with above-normal temperatures favored across the eastern half of the CONUS. Therefore, the autoblend of dynamical and statistical model guidance places the highest probabilities for above-normal temperatures across the central U.S., with above-normal temperatures also favored for the East. Probabilities stay very near 50 percent in the autoblend from the Rockies westward, including Alaska. Therefore, equal chances for above- and below-normal temperatures are maintained for most of Alaska (except above favored for southeastern Alaska and the Panhandle) and the western U.S., while above-normal temperatures are favored for the eastern two-thirds of the CONUS.
In contrast to the complex temperature forecast, the precipitation guidance from the dynamical models was surprisingly consistent. Almost all of the operational and experimental (Sub-X) model guidance depicts below-average precipitation across California and Oregon, with much of the guidance extending the below-average precipitation signal to the central U.S. The ECMWF and JMA both show a potential for above-average precipitation across the Gulf Coast states and Southeast, although this wet signal is washed out in the autoblend due to strong trends in the MLR statistical tool. The official outlook shows enhanced chances for above-average precipitation across far southeastern Alaska and the Alaska Panhandle consistent with anticipated southerly flow, with below-average precipitation favored across California and Oregon and much of the Intermountain West. A slight tilt towards below-average precipitation extends to the northern Plains. Based on the ECMWF and JMA guidance as well as the multi-model ensemble from Sub-X, an area of favored above-average precipitation extends from eastern Texas through the Southeast.
Weekly sea surface temperature (SST) anomalies remain above average but have decreased in the past couple of weeks in the vicinity of Hawaii. Dynamical models generally depict above-average height anomalies during the Week 3-4 period, with the CFS and ECMWF both depicting suppressed rainfall. Therefore, above-average temperatures remain favored, albeit with reduced probabilities, and below-average precipitation is favored, with confidence increasing towards the northwest.


Current Drought Conditions
Now we take a look at Thursday’s U.S. Drought Monitor Report.
The U.S. Drought Monitor is a comprehensive way of understanding the drought situation for the U.S. It is issued every Thursday and reflects the conditions as of the prior Tuesday. Drought is defined as a moisture deficit bad enough to have social, environmental or economic effects. Thus, more factors than recent precipitation are considered and more information on how it is done is found at the end of this report.

U.S. Affiliated Pacific Islands and the U.S. Virgin Islands.

Below is the map for just CONUS.
 |
 |
| Last Week | This Week |
| |

Some might find this animation of twelve weeks of change useful;

The graphic below shows the one-week change in drought intensity. Yellow is bad. Green is good.
|

Now we show the week to week change information by region. The yellow is where the level of drought has been raised. The green is where the level of drought has been lowered.
 |
Some degradation in Kansas |
 |
| No Change |
 |
| Some very slight improvement |
 |
| More degradation than improvement |
 |
| Slight degradation to the south with improvement in Virginia. |
 |
| A lot of action here with a lot of improvement in California and Nevada and also Arizona but with degradation in Washington State, Oregon, and Idaho and to some extent neighboring states |
Here is the Discussion that was issued with the Drought Report. The Regional Headings can be clicked on to obtain maps and statistics.
This Week’s Drought Summary
The U.S. Drought Monitor week saw another round of winter storms, bringing snow to the mountainous areas of the West, northern Plains, upper Midwest, and Northeast while lower elevations of the West and parts of the South, Southeast, lower Midwest, and Mid-Atlantic regions saw rain. This week’s precipitation in the Southwest left many areas with accumulations that exceeded 300 percent of normal over the past 14-day period, leading to continued improvements in short-term dryness. Once again, precipitation in the Northwest was below normal. Many locations have received less than 25 percent of normal over the last 14 days, resulting in the expansion of abnormally dry conditions. Meanwhile, another dry week in the Southern Plains and below-normal rainfall in the South and Southeast led to expansions in pockets of abnormal dryness and drought.
Northeast
This week’s rainfall helped alleviate the impacts of a dry autumn in the Northeast. Lingering abnormal dryness (D0) was removed from New Jersey. An area of D0 remains over the Delmarva Peninsula where rainfall deficits, low streamflow, dry soils, and reduced groundwater remain.
Southeast
Rainfall in the Southeast was predominantly below normal last week. While deficits continue to build, they were not enough to warrant degradations in most areas. Exceptions were minor expansions in abnormal dryness (D0) in eastern Alabama and Florida where streamflow has declined and vegetation shows stress.
South
The South once again saw a mixture of degradations and improvements. Improvements were limited to central Texas, where last week’s rainfall, in excess of 300 percent of normal, resulted in a general one-category improvement. Meanwhile, the eastern and southern parts of the state continued to dry out with expansions to areas of abnormal dryness (D0) and moderate (D1) and severe (D2) drought. The heavy black line separating drought impact designations was shifted eastward in south Texas to reflect that this area is also experiencing dryness at longer (more than 6 months) time scales. Eastern Oklahoma also saw degradations with an expansion of D0 as dryness, extending back to September, continued. This dryness comes at a vital time in winter crop cycles, and a continued lack of moisture may cause impacts later. Other degradations include the expansion of D0 and/or D1 in southwest Arkansas, Louisiana, and southwest Mississippi.
Midwest
The Midwest remains free of abnormal dryness and drought.
High Plains
Last week’s weather brought continued dryness to the abnormally dry and drought areas of south-central Nebraska, Kansas and eastern Colorado. In Kansas, where moisture deficits have been present for more than three months, abnormal dryness (D0), moderate drought (D1), and severe drought (D2) were expanded to reflect the increasing dryness and its impact on winter wheat. The map was unchanged this week for the remainder of the region.
West
Another week of above-normal rainfall and mountain snow led to continued improvements in the Southwest. In California and Nevada, rainfall over the last three weeks has helped to make up for the slow start to the water year, resulting in the removal of the abnormal dryness (D0) depiction across most of the state. Pockets of D0 remain in areas that missed the heaviest precipitation or where station data indicate below-normal snow. In the Four Corners states, the map depiction strives to balance the effect of the recent precipitation with the failure of the monsoon. Changes include a broad 1-category improvement across southern and western Arizona, western Utah, and western New Mexico. The heavy black line separating drought impact designations was expanded to delineate areas that are experiencing both short- (less than 6 months) and long-term (greater than 6 months) deficits. For example, the designation across southern and western Arizona is “L”, indicating that deficits are only present at longer time scales and in indicators such groundwater and root zone soil moisture, whereas the designation in eastern Colorado is “S”, indicating more seasonal deficits and impacts to indicators such as surface soil moisture and streamflow.
Alaska, Hawaii, and Puerto Rico
In Alaska, precipitation was below normal for the week over the long-term drought areas of the southeast where year-to-date deficits in excess of 20 inches remain. While precipitation was above normal for the Kenai Peninsula, longer deficits are still present and snow remains below normal.
In Puerto Rico, no changes were made given the degradations that were introduced last week. Note that deficits continue to build in the eastern part of the island, where deficits of about 4 to 13 inches have occurred over the last 90 days.
In Hawaii, rainfall helped improve conditions on Kauai and the northwest coastal slopes of Molokai. Rainfall in the eastern part of the state was not enough to warrant improvements, and vegetation conditions continue to decline. This week’s map saw the following degradations: an expansion of moderate drought (D1) on Lanai; an expansion of extreme drought (D3) and the introduction of exceptional drought (D4) on Maui; and an expansion of moderate drought (D1) and severe drought (D2) on the Big Island.
Pacific Islands
The weather pattern across Micronesia during this USDM week (12/04/19-12/10/19) consisted of a monsoon trough which developed across Palau and the Federated States of Micronesia (FSM), stretching into the southern Marshall Islands (RMI) at one point. The monsoon trough migrated southward as the week progressed, ending the week mostly across just southern Palau. Weak tropical disturbances moved within the trough during the week. Surface troughs and low-level convergence were associated with some of the disturbances. An upper-level low and its associated trough over the northern RMI moved westward north of the FSM as the week progressed. South of the equator, the week began with a surface trough/area of low-level convergence northeast of the Samoan Islands and high pressure to the south; the trough migrated over American Samoa as the week progressed.
Satellite-based estimates of 7-day precipitation (QPE) showed areas of 2+ inches of rain stretching from northwestern Yap State southeastward across the equator to east of the Samoan Islands. In the Micronesia region, the 2+ inch areas occurred northwest to southeast across Yap to Chuuk States, then southwest to northeast across southern Pohnpei State to the eastern RMI. In general, less than an inch of rain was indicated outside these areas. South of the equator, the 2+ inch areas were mostly north to east of the Samoan Islands, although spotty tendrils of 2+ inches touched American Samoa.
Drought-free conditions persisted this week at Palau as they had 3.81 inches of rain this drought week.
Rainfall totals for the week were less than half an inch across the Mariana Islands. Guam had only 0.23 inch, Rota 0.34 inch, and Saipan’s ASOS station had 0.28 inch (ASOS) and 0.29 inch at the NPS station. Although precipitation totals were less than the weekly 1-inch threshold to meet most water needs, drought-free conditions remain as the previous weeks and months were wet.
This was a dry week for the Federated States of Micronesia, with most stations receiving less than their 2-inches weekly threshold to meet most water needs. The stations in Yap, Pohnpei, Kosrae, and Nukuoro had the least rainfall, receiving less than 1 inch of rain; however, drought free conditions remain for these stations since this was the first week of dry conditions after very wet conditions the previous weeks. Kapingamarangi had 1.40 inches of rain this week and remained in drought free status since it has been extremely wet the last few weeks. Lukunoch and Woleai had less than 2-inch of rain this week. Since monthly precipitation totals since September 2019 have been less than the monthly threshold of 8 inches to meet most water needs, abnormally dry conditions persisted in Lukunoch and Woleai. Chuuk Lagoon was the only station that had a wet week, with 2.82 inches of rain. Drought free conditions persisted in Chuuk Lagoon.
Rainfall varied across the Marshall Islands this week. Majuro and Mili had the highest rainfall totals at 7.05 and 6.52 inches of rain, which is more than triple the weekly threshold minimum of 2 inches to meet most water needs. Jaluit was the other station that had more than 2-inches of rain. Ailinglapalap and Kwajalein had less than 2-inches of rain at 1.45 and 1.44 inches, respectively. Utirik and Wotje were the only stations that had less than half an inch of rain during the week. However, since this was the first or second week with low precipitation totals for these two locations, drought-free conditions were unchanged.
With 3.13 inches of rain for the week, drought free conditions continue in Tuituilla this week.
Virgin Islands
The Cyril E. King Airport had only 0.33 inch of rain during this drought week (December 4-10, 2019). The airport’s month-to-date precipitation of 0.82 inch is 77.4% of normal rainfall. The CoCoRaHS station at Anna’s Retreat 2.5 ESE had slightly higher rainfall totals at 0.64 inch of rain for the week and 0.83 inch for the month-to-date. The Cyril E. King Airport’s year-to-date rainfall was 33.02 inches or 88.2% of normal rainfall. SPI values for 1 and 3 months were -0.83 and -0.98, typically representing moderate drought, while SPI values for 6, 9, and 12 months indicated no drought development. St. Thomas drought classification was changed to short-term abnormally dry conditions (D0-S).
According to data from the Henry E. Rohlsen airport, only 0.11 inch of rain fell during this drought week. The month-to-date rainfall was 0.61 inch or 54.5% of normal rainfall. However, the CoCoRaHS station at Christiansted 1.8 ESE reported for the week 1.02 inches of rain and 1.47 inches for the month-to-date. The year-to-date rainfall total at the airport is 22.72 inches or 61.7% of normal rainfall. Meanwhile, the East Hill COOP station had 26.28 inches of rain for the year-to-date, which is 75% of normal rain. SPI values at 1, 6, and 9 months indicate moderate drought, while 3 and 12 months indicate extreme and severe drought, respectively. For this week, St. Croix’s drought classification remained as in moderate drought (D1-SL).
According to data provided by a volunteer observer, St. John had only 0.06 inch of rain during this drought week. The month-to-date rainfall total (as of December 9, 2019) was 0.75 inch. The year-to-date value of 34.71 inches of rain is 78.0% of normal. SPI values for 1 and 3 months were -1.12 and -1.34, respectively, typically representing moderate to severe drought conditions. While the 9 and 12 months indicate abnormally dry to moderate drought conditions. St. John’s drought designation was changed to moderate drought this week.
Looking Ahead
The National Weather Service Weather Prediction Center forecast for the remainder of the week calls for moderate to heavy mountain snows extending from the Pacific Northwest to the north-central Great Basin and Rockies. Meanwhile, parts of the northern High Plains, Upper Mississippi Valley, and upper Great Lakes are expected to see snow. As this storm moves eastward over the weekend, the Southeast, Tennessee Valley, and Mid-Atlantic will see rain, while mixed precipitation is expected in the Northeast. Dry conditions are expected in the Southwest, Southern Plains, and lower Mississippi River Basin.
Moving into next week, the Climate Prediction Center 6 to 10 day outlook (valid December 16-20) favors above-normal temperatures for the central and northern coast of California; parts of the Pacific Northwest, Southwest, and Central Plains regions; and the Florida Peninsula. Areas with increased chances for below-normal temperatures include parts of the Ohio and Tennessee Valleys and the Northeast region. Precipitation is likely to be above normal over the Pacific Northwest, parts of northern California, and from the Southern Plains, across the Southeast, and into the Mid-Atlantic region.
Some may find the below way of looking at things useful and I hope these graphics are not too small to read. I did not make them so you could click on them individually but you can click on the whole graphic and it may enlarge. But I think you get the picture. It has been a rapid onset and demise. When you read these graphics, remember that the older graphics are not the drought conditions that existed then but the change from then until now.

Let’s focus on the change between November 12, 2019 and December 10, 2019 i.e. one month.

Focusing on the Intermountain West

Drought Forecasts
These two forecasts (Monthly and Season) are issued by the same agency but to obtain them you need to access two different links here and here.
Here is the Monthly Drought Outlook which was updated on November 30, 2019.

Here is the Three-Month Forecast which was issued on November 21, 2019

Floods
Floods remain a concern but only in a limited area.

| Last Week | Current Week |
| |

Let’s see if this animation works. It shows the pattern for August and September.

Wildfires

Current Wildfire Risk. This is a new model that updates daily to show the short-term risk.

Click here to update. Red is high risk, blue is low risk. This graphic updates daily but you have to click on the link provided to get the updates More information can be found here.
This explains the model a bit.


Looking out another month.


Crop Progress
Recently, we looked at the individual crop progress reports graphically from this source and we have reviewed this Executive Summary Report which provides projections of the ultimate harvest. It is important to make the distinction between crop progress which we report in this section of our article weekly and forecasts of what the result for the crop will ultimately be and we review that information as the NASS forecasts are released. Once a month they issue a briefing document on the overall situation (that was this week and we have started to report on that) and they also release more targeted information from time to time.
Now, we will look at the season to date information summary. This is a crop progress report, not a forecast.

| Crop | Crop Progress | Crop Condition |
| Corn | Slow Harvested | NA |
| Soybeans | OK(Harvested) | NA |
| Spring Wheat | Slow (Harvested) | NA |
| Winter Wheat | OK(Emerged) | Bad |
| Cotton | Good (Harvested) | NA |
| Sorghum | Good (Harvested) | NA |
| Rice | Good (Harvested) | NA |
| Barley | Slow (Harvested) | NA |
| Peanuts | Good(Harvested) | NA |
| Sugarbeets | OK(Harvested) | NA |
| Sunflowers | Very Slow(Harvested) | NA |
We no longer have enough information on crop conditions to take the above table and show it the way we have been doing as a matrix.
The degree-day deficit graphic is also not available as the growing season winds down. The data is available but the nice graph was not in any of the usual sources that I use to prepare this article.
International

A map helps and is not always available and unfortunately, it was not available this week.

Major Sources of Information
In the box are shown the major resources we use. We will not be using them all each week but the reader is welcome to refer to these resources.
Major Sources of Information Used in this Weekly Report
|
Background Information


The sequence of drought occurrence and impacts for commonly accepted drought types. All droughts originate from a deficiency of precipitation or meteorological drought but other types of drought and impacts cascade from this deficiency. (Source: NDMC)
Source: National Drought Mitigation Center, University of Nebraska-Lincoln


