Written by Sig Silber
Updated at 9:45 p.m. EDT to reflect the new Week 3 – 4 Forecast
We cover a lot of ground tonight. We have a new ENSO Update, the State Temperature and Precipitation rankings for last month, some reservoir level reports, and a new crop production forecast which is not horrible but also certainly not good news. Each week we report on the current status of the crop and once a month or as the data comes in, we report on the forecast of the final seasonal results. Of course, we present the weekly drought report. And we have many other regular drought related indices we report on including wildfires and floods. We also provide a shortened version of the Intermediate-term weather forecast.

Please share this article – Go to the very top of the page, right-hand side, for social media buttons. Please feel free to send this article to anyone who you think might benefit from reading it.
New Format: Each week our Thursday night article will cover the Drought Monitor Report issued by NOAA in conjunction with the University of Nebraska – Lincoln and a summary of U.S. crop conditions. It provides a link to the Severe Weather Report (this will take two clicks since that report gets republished each day and so you click here to get to the Directory and then click again on the version of the Severe Weather Report closest to the top of the list. Soon, we may have a link to a full weather report, not just severe weather. Each week, this article will have a different special feature. Examples of special features might be: A. a more detailed look at crop progress (We focus tonight on the new NASS forecast) B. a review of the prior month’s weather. (tonight we looked at August) C. a review of the prior month’s International Weather D. Current conditions of rivers and reservoirs.(we look at that a bit) E. Economic Impacts other than crop-related (storm impacts including flooding and drought impacts including wildfires) F. Other. |
ENSO News (Is it news when it is expect?) Note. We remove the links to the figures in this report because it is difficult to include them and we show most of those graphics in our regular Monday Report.
CPC/IRI ENSO Update Published: September 12, 2019
El Niño/Southern Oscillation (ENSO) Diagnostic Discussion issued jointly by the Climate Prediction Center/NCEP/NWS and the International Research Institute for Climate and Society
ENSO Alert System Status: Not Active
Synopsis:
ENSO-neutral is favored during the Northern Hemisphere fall 2019 (~75% chance) and is expected to continue through Northern Hemisphere spring 2020 (55-60% chance).
During August, ENSO-neutral continued as reflected by the near-average sea surface temperatures (SST) across most of the central and eastern equatorial Pacific Ocean. The latest weekly Niño-3 and Niño-3.4 values were -0.2°C and 0.0°C, respectively, with the westernmost Niño-4 region remaining above average (0.5°C) and the easternmost Niño-1+2 region remaining below average (-0.6°C). Upper-ocean subsurface temperature anomalies (averaged across 180°-100°W) decreased slightly during the month , with below-average temperatures strengthening in the east-central equatorial Pacific. Suppressed tropical convection continued over parts of Indonesia, while near-average convection was evident near the Date Line. Low-level and upper-level wind anomalies were near average over most of the tropical Pacific Ocean. Overall, oceanic and atmospheric conditions were consistent with ENSO-neutral.
The majority of models in the IRI/CPC plume continue to favor ENSO-neutral (Niño-3.4 index between -0.5°C and +0.5°C) through the Northern Hemisphere spring. However, the statistical model* averages appear to favor Niño-3.4 values that are at the ElNiño thresholds (+0.5°C) during the fall and winter. Forecasters are leaning toward the dynamical model average, which is also supported by the current tendency of the ocean toward cooler conditions. In summary, ENSO-neutral is favored during the Northern Hemisphere fall 2019 (~75% chance) and is expected to continue through Northern Hemisphere spring 2020 (55-60% chance; click the CPC/IRI consensus forecast for the chance of each outcome for each 3-month period).
This discussion is a consolidated effort of the National Oceanic and Atmospheric Administration (NOAA), NOAA’s National Weather Service, and their funded institutions. Oceanic and atmospheric conditions are updated weekly on the Climate Prediction Center web site (El Niño/La Niña Current Conditions and Expert Discussions). Forecasts are also updated monthly in the Forecast Forum section of CPC’s Climate Diagnostics Bulletin. Additional perspectives and analysis are also available in an ENSO blog.
The next ENSO Diagnostics Discussion is scheduled for 10 October 2019. To receive an e-mail notification when the monthly ENSO Diagnostic Discussions are released, please send an e-mail message to: [email protected].


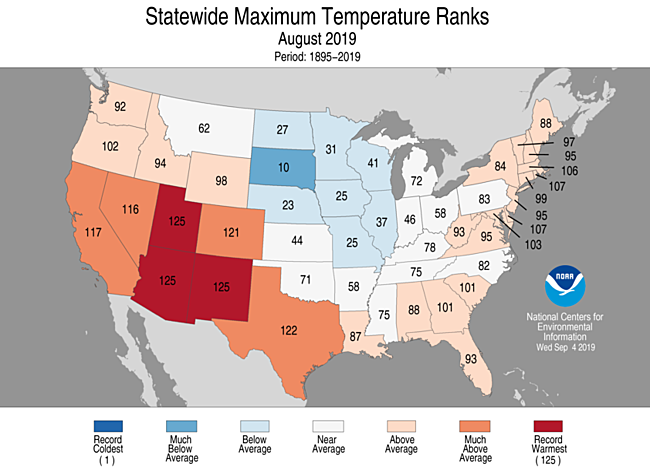
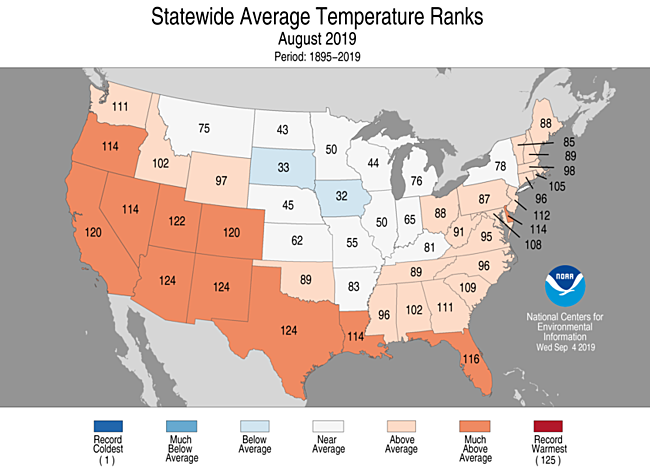
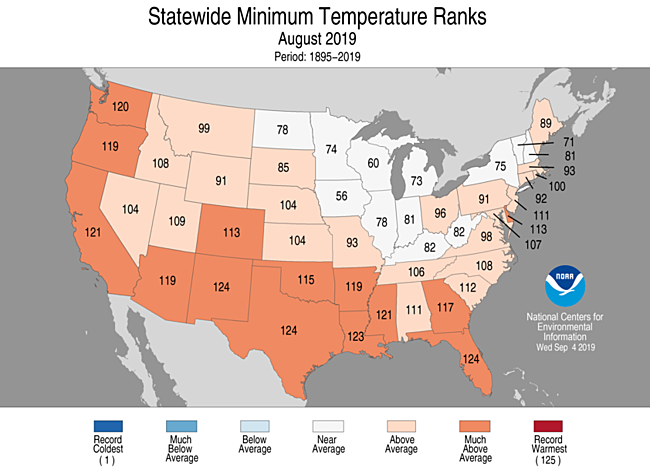
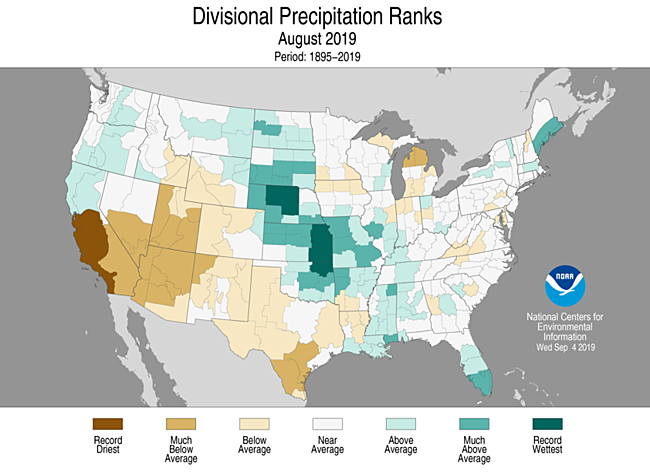
A Review of August State Rankings i.e. where they stand relative to the 125 year history.
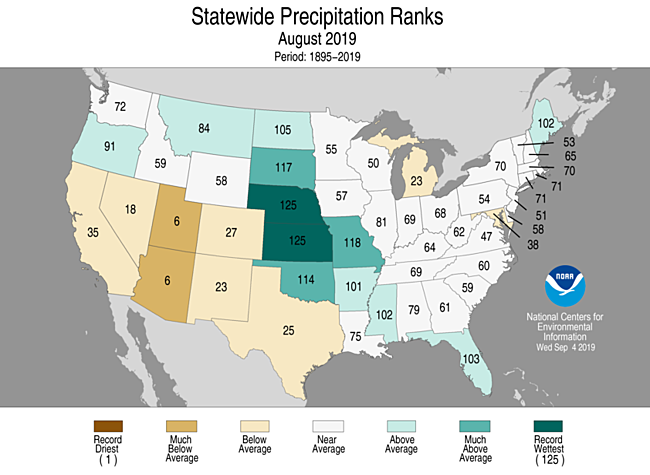
Now let us look at precipitation.
Sometimes Climate Divisions are a good way of looking at things.
Looking at Reservoirs


A new crop forecast came out today and we did not notice that it was available until late in the day so we have not reviewed it but thought we should share it anyway as it will be reported in publications that focus on agriculture and perhaps elsewhere also. We will comment more next week.


And shifting to the Alaska and CONUS Weather Forecast
First Temperature
|
|
|
|


And then Precipitation
|
|
|


Here is the discussion released with the new Week 3 – 4 Forecast.
Week 3-4 Forecast Discussion Valid Sat Sep 28 2019-Fri Oct 11 2019
Today’s forecast is especially tricky for a couple of reasons. First, aside from tropical Kelvin and equatorial Rossby wave activity, there is no large-scale variability on Week 3-4 timescales to anchor the atmospheric state. Second, the forecast period falls in a climatologically active part of hurricane season. Hurricane formation and potential track are difficult to predict 3-4 weeks in advance. Atlantic and eastern Pacific hurricanes can directly influence weather over the forecast area and any hurricane can indirectly influence the forecast area by re-curving poleward and perturbing the mid-latitude wave guide.
Most of our model guidance predicts a time-mean amplified pattern over North America during the Week 3-4 period. Both the CFS and the ECMWF forecast an anomalous trough just south of the Aleutians, but the trough is about 100m deeper in the CFS (-120m vs -20m). The rest of the Rossby wave over North America is of similar amplitude between the models, although the ECMWF positions the wave slightly further north than the CFS. As one might expect from the height pattern, the CFS predicts colder temperatures over Alaska than the ECMWF does. Both models predict anomalous warmth over the western CONUS and near to below normal temperatures in the eastern CONUS, but the CFS positions the most anomalous cold air over the Southeast whereas the ECMWF positions it over the Great Lakes region.
In-line with our calibrated model guidance along with our statistical MLR tool, our forecast favors above normal temperatures for most of the western and southern parts of the country and below normal temperatures throughout the mid-west and northern New England. Our forecast probabilities of above normal temperatures over Alaska are around 60%.
The precipitation outlook features below normal precipitation along the northern part of the CONUS and throughout the Plains, based on an amplified ridge forecast near the West Coast. Above normal precipitation is also forecast along coastal parts of Alaska due a southerly flow over anomalously warm waters. Above normal precipitation is also forecast throughout the coastal Southeast due to the potential for tropical cyclone activity.
SSTs are forecast to remain above normal around Hawaii, which should lead to above normal temperature and precipitation.


Current Drought Conditions
Now we take a look at Thursday’s U.S. Drought Monitor Report.
The U.S. Drought Monitor is a comprehensive way of understanding the drought situation for the U.S. It is issued every Thursday and reflects the conditions as of the prior Tuesday. Drought is defined as a moisture deficit bad enough to have social, environmental or economic effects. Thus, more factors than recent precipitation are considered and more information on how it is done is found at the end of this report.

U.S. Affiliated Pacific Islands and the U.S. Virgin Islands.

Below is the map for just CONUS.
 |
 |
| Last Week | This Week |
| |

Some might find this animation of twelve weeks of change useful;

The graphic below shows the one-week change in drought intensity. Yellow is bad. Green is good.
https://docs.google.com/vi |

Now we show the week to week change information by region. The yellow is where the level of drought has been raised. The green is where the level of drought has been lowered.
 |
| Deterioration in Colorado |
 |
| Mixed with improvement to the west and north and deterioration to the east and south. Kentucky was probably the state with the most deterioration. |
 |
| Deterioration in Maryland and West Virginia |
 |
| Some deterioration in Tennessee. A lot of deterioration in Oklahoma, Louisiana, Arkansas and most importantly Texas except extreme south Texas and West Texas. |
 |
| Except the area impacted by Dorian, there has been deterioration. Not much change in Florida other than western Florida. |
 |
| Arizona is the focus of the deterioration but there was some in New Mexico, Colorado, Utah, and Nevada. There was improvement in Oregon and Washington and also western Montana. |

Here is the Discussion that was issued with the Drought Report.
This Week’s Drought Summary
Northeast
Light showers dropped 0.5-1.5 inches of rain across northern sections of New York, Vermont, New Hampshire, and Maine. Although offshore in the Atlantic Ocean, Dorian came close enough to far eastern Maine that 1.5-4 inches of rain accumulated. Elsewhere, it was mostly dry across the Northeast. The small D0 areas in upstate New York and New England remained unchanged as this week’s light rain were not enough for removal, but great enough (including last week’s higher rainfall) to prevent expansion. Farther south, however, conditions have recently been drier in the mid-Atlantic and central Appalachians with slightly above-normal temperatures (1-3 degs F). As a result, between 50-75% of normal precipitation has fallen during the past 60-days, accumulating deficits of 2-4 inches. For the week ending Sep. 8, 33, 63 and 74% of the topsoil moisture in West Virginia, Maryland, and Delaware, respectively, was rated short to very short, according to the USDA. Therefore, D0 was added to the Delmarva Peninsula, and expanded in southern West Virginia.
Southeast
With a weakened Hurricane Dorian lurking just off the Carolina coasts and tracking northeastward, a sharp gradient of precipitation amounts was produced. 10-15 inches of rain was dumped on some coastal locations in South Carolina (e.g. Pawleys Island 15.21″; Georgetown 13.38″; North Myrtle Beach 10.44″) and North Carolina (Wilmington coop 13.07″; Smith Creek 11.36″; Wilmington NWS 10.80″; Kingston 8.68″), but totals rapidly declined to the west, with no rain at all in central sections of the Carolinas. Several tornadoes were spawned in the eastern Carolinas, and a severe storm surge on Ocracoke Island required numerous rescues. With that stated, D0 and D1 was removed from northeastern South Carolina and southeastern North Carolina (some 2 cat improvements, D1 to nothing), and some D0 was erased in southeastern South Carolina. Further inland, however, a week of no rain, above-normal temperatures, and windy conditions increased 60-day deficits and evapotranspiration rates. The D1 and D2 areas corresponded to 2-month deficits of 3-6 inches, while newly added D0 areas were generally 50-70% of normal for the same time period. USDA statewide short to very short topsoil moisture percentages have also increased across parts of the Southeast: Virginia (77), Georgia (64), Alabama (53), South Carolina (50), and North Carolina (33). USGS 7-day averaged stream flow have also declined across central sections of Alabama and Georgia, with numerous sites in the lower tenth percentile (much below normal), while western and central South Carolina, Florida Panhandle, and southern Virginia were in the 10-24th percentile (below normal). USDA/NASS pastures for the week ending Sep. 8 were rated very poor to poor in Virginia (50%), North Carolina (26%), South Carolina (22%), Georgia (25%), and Alabama (20%).
South
Mostly dry and warm weather enveloped much of the South, contributing to a rapid decline in short-term moisture conditions across most of Texas, southwest and southeast Oklahoma, southwest Arkansas, and northwest Louisiana. Even a few pockets of D0 were introduced in formerly wet central and northeastern sections of Tennessee. The few exceptions to this were outer bands of rain across southern Texas from Tropical Storm Fernand (which made landfall in northeastern Mexico), some light monsoonal showers in southwestern Texas and the northern Texas and Oklahoma Panhandles, and Day7 thundershowers in northern Louisiana and central Arkansas. A general 1-category improvement was made across southern Texas in response to 1-3 inches (locally 5 inches) of rain, while some slight improvements were made around the Midland area, Trans Pecos region, and in extreme northern Louisiana. In contrast, September’s climatologically higher rainfall totals for Texas and Oklahoma make degradation faster, and temperatures have remained high. Where little or no rain fell, a 0.5-1 category downgrade was made, especially in central Texas, but also in southwest and southeast Oklahoma, and bordering sections of Arkansas and Louisiana. According to USDA, percentages for both topsoil and subsoil moisture for Texas stood at 85 and 79%, respectively, as of Sep. 8, while topsoil moisture grew increasingly short to very short in Arkansas (67%), Louisiana (60%), Mississippi (66%), and Tennessee (52%). Even with the USDA topsoil moisture figure, Mississippi remained D0-D4 free as the entire state still had 60-day precipitation surpluses. Texas pasture and range conditions have been affected by the warmth and dryness, with 48% rated poor or very poor according to the Sep. 8 USDA/NASS report.
Midwest
Widespread light to moderate rains (0.5-2 inches) fell across the western and northern sections of the Midwest as several frontal systems dove southeastward out of Canada. The heaviest rains (1.5-3.5 inches) were reported across western and northern Minnesota, while bands of scattered thunderstorms moved across parts of Iowa, southern Wisconsin, northern Illinois, and the UP of Michigan. In contrast, little or no rain fell across southern and eastern portions of the Midwest (southern Missouri and Illinois, most of Indiana, southern lower Michigan, and much of Ohio and Kentucky). Not surprisingly, some improvement was made where the greatest totals occurred that greatly reduced or alleviated short-term deficits. This included around Duluth, MN; southwestern, central, and northeastern Iowa; northern Illinois; and the eastern UP of Michigan. Dry weather meant deterioration, and this occurred in northwestern Indiana and southern lower Michigan (D1 expansion); new D1 areas in southwest Ohio, southern Indiana, and central Kentucky; and D0 increase across central and eastern Kentucky. 60-day shortages reached 3-6 inches in the new D1 areas, while most of the D0 areas only received 50-70% of normal precipitation. Kentucky had the highest percent short to very short topsoil moisture value (61%), with Iowa, Michigan, Illinois, Indiana, and Ohio not far behind (between 30-42%). Although the dry weather is good for crop maturation and corn dry down, the wet spring delayed planting, so some crops may be behind schedule and could use rain for filling (mainly soybeans).
High Plains
Unsettled weather brought widespread light precipitation to much of the High Plains, especially Montana and the Dakotas, while monsoonal moisture produced scattered showers in Colorado, western Nebraska, and parts of Kansas and Wyoming. With much of the region drought-free, the rains fell on top soils with adequate to surplus moisture. The few areas with D0 or D1 did receive precipitation, and some improvements were made. In northwestern Montana, 2-3 inches of rain in the Mission Mountains and widespread 1-2 inches across Lake and Flathead counties have produced near record maximum stream flows for this time of year. With 60- and 90-day totals now at normal or surplus, D0 was removed, and D1 shrunk to just include Lincoln County where weekly amounts were somewhat lower, and short-term deficits still remained. In North Dakota, another week of rain (0.5-1.5 inches) continued to reduce short and medium-term deficiencies, with D1 removed and the D0 shrunk to better fit dwindling 60-day deficits. In central Colorado, 1-2 inches of rain south of Denver eliminated short-term deficiencies, thus D0 was erased. Farther to the southwest and southeast, however, dry and warm weather increased 90-day deficiencies as the southwest monsoon has been weak and spotty, generating SPIs less than -1.5 on a 30-, 60-, and 90-day time scales. The wet winter and spring is fast becoming a faded memory as the summer heat and dryness continued to assert itself with impacts. Accordingly, D0 expanded into Gunnison, Pitkin, and Saguache counties in the southwest, while D0 increased in Las Animas and Otero counties in the southeast. D1 also slightly crept northward in southwestern Colorado.
West
While precipitation returned to the Pacific Northwest and conditions improved, the Southwest continued to have a disappointing summer monsoon as only scattered light showers fell across central New Mexico and central Colorado. Rains also fell on most of Idaho and western Wyoming as cold fronts squeezed out moisture from the Pacific Ocean and the southwest monsoon. With June-August completed, the precipitation rankings for the Four Corner States were a disappointment. According to NCEI, Arizona had the driest (1) JJA on record, followed by Utah (8), New Mexico (10), and Nevada (12), with records going back to 1895. Combined with much above normal JJA temperatures (New Mexico 6th and Arizona 12th warmest), the beneficial impacts from a snowy winter and cool and wet spring have faded, and have been replaced by summer’s heat, dryness, and negative impacts. The SPEI, which combines precipitation and temperature effects, was the lowest on record for Arizona in August, July-August, and June-August. With this sudden downturn during the past 3 months, impacts have rapidly surfaced, and as a result, a widespread, 1-category deterioration was made to most of Arizona (D1 and D2 expansion) and bordering areas (e.g. southern Utah, southwest Colorado, and western New Mexico). Southeastern New Mexico has also been dry at 60-days, thus D1 expanded there from west Texas. USDA/NASS pasture and range conditions rated poor or very poor have risen to 41% in Arizona and 46% in New Mexico. In sharp contrast, welcome beneficial rains fell across the Northwest, signaling an uptick in precipitation in the region during the past 30-60 days. With locally heavy amounts (2-4 inches) in western Oregon and Washington and USGS stream flows responding, D2 was reduced in the Olympic Peninsula and northern Cascades of Washington; D1 shrunk in northwestern Oregon, southwestern and northeastern Washington and around the Puget Sound; and D0 removed in west-central Oregon. Hopefully the increase in precipitation normally seen during the late summer and fall months will continue to ease the drought.
Alaska, Hawaii, and Puerto Rico
Light to moderate precipitation (1-3 inches, locally to 5) fell along the western, southwestern, and southeastern Alaskan coasts. Although the increased precipitation was welcome, June 1 to date rainfall was still at near-record low levels in south-central Alaska. The 1- and 10-hour fire fuels are significantly moister, but the 100- to 1000-hours and duff layer are still very dry. There has been little or no recovery in soil moisture, even at a 2 inch depth. Several communities continue to have no water remaining, or are very close to running out. The primary concern of the communities is whether they can fill their water storage before winter sets in next month. Therefore, until a longer stretch of wet weather becomes established, no improvements were made. However, the lower Alaskan Peninsula D0 area was erased with the recent wet weather as Cold Bay is back to near normal precipitation since May 1.
In Hawaii, light showers frequented the windward sides of the eastern islands, continuing a recent increase in showers in this area. With the full August statistics available, along with updated NDVI data, surplus rainfall and improved NDVI conditions over portions of the windward slopes in Maui County and the Big Island allowed for some reduction in Dx coverage. On the Big Island, windward slopes of the Kohala Mountains improved from D1 to D0; windward slopes of the Hamakua District went from D2 to D1; D0 area on the leeward slopes of Mauna Kea were reduced in upper and middle elevations; and a 1-category improvement was made near South Point. In Maui County, reduced D0 coverage was favored along the windward slopes of Maui and Molokai. Elsewhere, no other changes were made.
Heavy rains (3-6 inches, locally to a foot) fell along the northwestern, north-central, and far northeastern sections of Puerto Rico, but these areas were mostly drought free. A few areas that observed heavy rains, however, were in D0 or D1 (northeastern and central sections of the island), and a 1-category improvement was made there. 7-day averaged near-record low USGS stream flows were confined to a few sites along the southwestern coast, while the rest of the island was normal or above-normal.
Pacific Islands
The weather pattern during this USDM week (9/4/19-9/10/19) consisted of a continued monsoon trough from the Marianas, northern Palau, and northwest Yap State, southeastward across the Federated States of Micronesia (FSM) to the southern Marshall Islands (RMI). Weak circulations embedded within the monsoon trough slowly migrated westward during the week. Upper-level troughs to the north of the USAPI created a divergent flow aloft that extended over parts of Micronesia, especially in the west, which combined with the monsoonal convergence at the surface to enhance showers and thunderstorms. South of the equator, a surface convergence zone (trough/stationary front) oscillated across the Samoan Island region, competing with stable and more drier air extending into the region from the south and east.
Satellite-based estimates of 7-day precipitation (QPE) showed a mostly continuous band of precipitation extending from the East China Sea and Philippine Sea southeastward across Micronesia into the Southern Hemisphere. Over Micronesia, precipitation amounts in this band were estimated at 2 to 4 inches, with locally up to 10 inches or more, and the rain delineated the monsoon trough. Rainfall amounts tapered off to an inch or less across southwestern Micronesia and over extreme northeastern FSM. South of the equator, the rain band comprised a patchy South Pacific Convergence Zone extending across the Samoan region which was characterized by areas of 2 to 4 inches of rain next to pockets of less than an inch.
The Republic of Palau continued to experience showery weather, with a month-to-date total of 5.81 inches of rain reported at the international airport through the afternoon of September 10. As a result, D-nothing continued.
A showery pattern also persisted in the Mariana Islands, with all major observation sites receiving at least 3 inches of rain during the monitoring period. A D-nothing designation continued throughout the Marianas. Through September 10, month-to-date rainfall totaled 4.37 inches (126 percent of normal) at Saipan/Isley.
In the Federated States of Micronesia, most islands remained wet enough to retain a D-nothing designation. Weekly totals ranged from 6 to 10 inches in several locations, including Fananu, Kosrae, Pohnpei, and Chuuk Lagoon, with nearly all other islands receiving the 2-inch weekly minimum value. One exception was Pingelap, where D0-S was retained due to a weekly sum of 1.30 inches (with 2 days of data missing). Elsewhere, no data was reported from Ulithi and thus no analysis was made.
In the Republic of the Marshall Islands, variable rainfall was generally light or moderately heavy, with most observation sites receiving 1 to 3 inches during the drought-monitoring period. Jaluit remained at D2-SL after receiving 1.11 inches during the week. Meanwhile, short-term dryness was replaced by D-nothing at Kwajalein and Ailinglapalap, courtesy of weekly totals that reached 3.11 and 2.73 inches, respectively. Utirik also received appreciable rain, 3.20 inches, resulting in improvement from moderate drought to abnormal dryness (D1-L to D0-L). Rainfall was a bit lighter at Wotje, where 1.78 inches fell, leaving D1-SL intact. Mili and Majuro retained a D-nothing designation, although the latter location is teetering on the brink of short-term dryness. Majuro’s weekly rainfall totaled 1.07 inches, following an August that featured more than 13 inches. Majuro’s reservoir storage has been dropping in recent days, but stood at 28.838 million gallons (80.1 percent of capacity) on September 11.
In American Samoa, rainfall has been generally light since late August, and D0-S was introduced last week. During the drought-monitoring period, less than an inch of rain fell at two National Park Service observation sites. Rainfall was a little heavier at the Pago Pago Airport, with 1.32 inches reported for the week. Through September 10, the month-to-date rainfall at the airport totaled just 1.35 inches. As a result, D0-S was retained for American Samoa.
Virgin Islands
Scattered showers affected the U.S. Virgin Islands in early September, following Hurricane Dorian’s passage in late August. Although showers were mostly light, a few spots received totals in excess of 2 inches. For example, a CoCoRaHS observer near Christiansted, on St. Croix, reported a weekly sum of 2.45 inches. Several other locations, including King Airport on St. Thomas and a volunteer observer on the northern shore of St. John, received less than an inch. Well reports from the U.S. Geological Survey noted little change in groundwater levels in recent days. Taking all factors, including the Standardized Precipitation Index, into account, D0-L was retained for St. Croix, while D-nothing was maintained for St. Thomas and St. John.
Looking Ahead
Fortunately for the Southeast, Category 5 Hurricane Dorian stalled just east of central Florida, slowly weakened, and gradually turned northward, finally accelerating northeastward into Nova Scotia and Newfoundland. Its only U.S. landfall was at Cape Hatteras. Unfortunately, it stalled over the northern Bahamas for 1-2 days, devastating the islands of Great Abaco and Grand Nassau. Rainfall from Dorian was limited to coastal sections of eastern Florida, the Carolinas, Delmarva Peninsula, Cape Cod, and extreme eastern Maine. Between 5-10 inches of rain, locally to 15 inches, fell along coastal northeastern South Carolina and eastern North Carolina, although the totals sharply dropped off to the west. A second tropical system, Tropical Storm Fernand, made landfall in northeastern Mexico, but its outer bands of rain brought welcome rains to southern Texas. Frequent cold fronts raced across the northern tier of States, dropping light to moderate precipitation on the Northwest, northern Rockies and Plains, Midwest, upper Great Lakes region, and northern New England. Monsoonal moisture produced light showers in western Texas, central New Mexico, Colorado, and into Wyoming and Idaho. Dry weather prevailed in western sections of the Southwest, south-central Plains, lower Mississippi Valley, and across much of the Southeast, eastern Ohio Valley, and mid-Atlantic. Temperatures averaged above-normal across the West, southern two-thirds of the Plains, and across the Southeast, with subnormal readings confined to the northern Plains, upper Midwest, Great lakes region, and Northeast.
During the next 5 days (September 12-16, 2019), the possible development of a tropical system in the western Caribbean and eastern Gulf of Mexico brings enhanced rainfall to the central and eastern Gulf and southern Atlantic Coasts. Elsewhere, the Pacific Northwest should see continued precipitation (0.5-2 inches), while more systems bring rainfall (1-3 inches) to the northern Plains, upper Midwest, and Great Lakes region. Some monsoonal showers should develop in New Mexico and west Texas, with this moisture merging with a cold front that should produce thunderstorms across the south-central Plains. Little or no rain is expected in California, Nevada, most of Arizona, southern Utah, from northeastern Texas eastward to South Carolina, and along coastal New England. Most of the lower 48 States should record above-normal temperatures.
The CPC 6-10 day outlook (September 17-21, 2019) favors above-normal precipitation chances for most of the contiguous U.S. and Alaska, with below-normal odds limited to States along the Northeast Coast. Temperatures are likely to be subnormal from the Rockies westward, while above-normal readings are expected east of the Rockies, especially in the northeastern quarter of the Nation.
Some may find this way of looking at things useful and I hope these graphics are not too small to read. I did not make them so you could click on them individually but you can click on the whole graphic and it may enlarge. But I think you get the picture. It has been a rapid onset and demise. When you read these graphics, remember that the older graphics are not the drought conditions that existed then but the change from then until now.

Let’s focus on the change between August 13, 2019 through September 10, 2019 i.e. a month. .

Drought Forecasts
First, we show the forecast through November which was issued on August 15, 2019 (to be updated on September 19, 2019). These two forecasts are issued by the same agency but to obtain them you need to access two different links here and here.
Here is the Three-Month Forecast which was issued on August 15, 2019

It does not look too bad except for South Texas.
Here is the Monthly Drought Outlook which was updated on August 31, 2019

Floods remain a concern but only in a limited area.

| Last Week | Current Week |
|
|

Let’s see if this animation works. It shows the pattern for August.

Active Major Fires

New Wildfire Indicator

Click here to update. Red is high risk, blue is low risk. This graphic updates daily but you have to click on the link provided to get the updates More information can be found here.

Looking out another month.


Crop Progress
Recently, we looked at the individual crop progress reports graphically from this source. Also recently we reviewed this Executive Summary Report which provides projections of the ultimate harvest. We have reviewed the new NASS forecast earlier in this article. It is important to make the distinction between crop progress which we report in this section of our article weekly and forecasts of what the result for the crop will ultimately be and we review that generally once a month as the NASS forecasts are released.
But for now, we will look at the season to date information summary.

| Crop | Crop Progress | Crop Condition |
| Corn | Slow (Dough) Very Very Slow(Denting and Mature) | Very Bad |
| Soybeans | Slow (Setting Pods) | Very Bad |
| Spring Wheat | Very Slow (Harvested) | Bad |
| Cotton | Good (Setting Bolls) Slightly Bad (Harvested) | Good |
| Sorghum | Slow Headed and Very Slow (Coloring) Slow (Mature) Slightly Slow (Harvested) | Very Good |
| Rice | Slow (Harvested) | Bad |
| Oats | Slow (Harvested) | Bad |
| Barley | Slow (Harvested) | NA |
| Peanuts | NA | Bad |
The following table summarizes the situation. It has changed just a a bit since last week for cotton.
| Crop development Early | OK | Crop Development Late | |
| Crop Condition Good | Cotton | Sorghum | |
| Crop Condition OK | Barley | ||
| Crop Condition Bad | Peanuts | Corn Soybeans Spring Wheat Rice Oats |
This provides some additional information: There are many factors that have led to the current situation but one is the amount of sunshine other causes of temperature and it has been inadequate.

Side by Side
|
|

International

A map helps and is not always available and fortunately, it was not available this week.

Major Sources of Information
In the box are shown the major resources we use. We will not be using them all each week but the reader is welcome to refer to these resources.
Major Sources of Information Used in this Weekly Report
|
Background Information


The sequence of drought occurrence and impacts for commonly accepted drought types. All droughts originate from a deficiency of precipitation or meteorological drought but other types of drought and impacts cascade from this deficiency. (Source: NDMC)
Source: National Drought Mitigation Center, University of Nebraska-Lincoln


