Global Economic Intersection
Advertisement
  • Home
    • 카지노사이트
  • Economics
  • Finance
  • Politics
  • Investments
    • Invest in Amazon $250
  • Cryptocurrency
    • Best Bitcoin Accounts
    • Bitcoin Robot
      • Quantum AI
      • Bitcoin Era
      • Bitcoin Aussie System
      • Bitcoin Profit
      • Bitcoin Code
      • eKrona Cryptocurrency
      • Bitcoin Up
      • Bitcoin Prime
      • Yuan Pay Group
      • Immediate Profit
      • BitQH
      • Bitcoin Loophole
      • Crypto Boom
      • Bitcoin Treasure
      • Bitcoin Lucro
      • Bitcoin System
      • Oil Profit
      • The News Spy
      • Bitcoin Buyer
      • Bitcoin Inform
      • Immediate Edge
      • Bitcoin Evolution
      • Cryptohopper
      • Ethereum Trader
      • BitQL
      • Quantum Code
      • Bitcoin Revolution
      • British Trade Platform
      • British Bitcoin Profit
    • Bitcoin Reddit
    • Celebrities
      • Dr. Chris Brown Bitcoin
      • Teeka Tiwari Bitcoin
      • Russell Brand Bitcoin
      • Holly Willoughby Bitcoin
No Result
View All Result
Global Economic Intersection
No Result
View All Result
Home Uncategorized

Live: Severe Weather Events Issued On August 31, 2019 – Hurricane Dorian

admin by admin
September 6, 2021
in Uncategorized
0
0
SHARES
0
VIEWS
Share on FacebookShare on Twitter

Written by Sig Silber

Updated at 4 pm EDT August 31, 2019 to reflect the dramatic change in track that we hinted at when we published late last night. The NOAA Discussion is not able to keep up with the changing track at least not right now. Cape Hatteras and places southwest of Cape Hatteras seem to be at most risk now other than of course the Northwestern Bahamas.

Focal Points for Saturday and Sunday. Hazards for Days 3 and 7 out to September 6 are shown in the body of the report. We focus tonight on Hurricane Dorian

…Dorian with 140mph winds is forecast to move across the northernmost Bahamas as a major hurricane on Sunday…

…Excessive heat continues across the Southwest into the weekend…

Severe Weather November 28, 2018 through December 2, 2018

Looking out 3 to 7 Days (this list will not update until Monday afternoon)

– Heavy rain across portions of the Great Lakes and the Upper Mississippi Valley, Mon-Tue, Sep 2-Sep 3.

– Heavy rain across portions of the Southeast and the Mid-Atlantic, Mon-Fri, Sep 2-Sep 6.

– Heavy rain across portions of the Northeast, Mon, Sep 2.

– Heavy rain across portions of the Northeast, Wed, Sep 4.

– Severe weather across portions of the Central Plains, the Upper Mississippi Valley, and the Northern Plains, Mon, Sep 2.

– Flooding possible across portions of the Central Plains, the Southeast, the Middle Mississippi

Valley, and the Southern Plains.

– Flooding occurring or imminent across portions of the Northern Plains.

– High winds across portions of the Southeast and the Mid-Atlantic, Mon-Fri, Sep 2-Sep 6.

– High significant wave heights for coastal portions of the Southeast, Mon-Wed, Sep 2-Sep 4.

– Heavy rain across portions of mainland Alaska, Mon, Sep 2.

– High winds across portions of mainland Alaska and the Aleutians, Mon, Sep 2.

This article provides continuous updates for a variety of Weather and Weather-Related Threats. Pay attention to how severe weather may impact where you live or travel. For a location of interest on any of these maps, click the map to see the details – perhaps a very detailed map and appropriate text information. These are “Live” maps and continually update. Please pay attention to the Mesoscale Events maps — Mesoscale Events are potentially life-threatening situations.


Please share this article – Go to the very top of the page, right-hand side for social media buttons. Also, feel free to send this email to anyone you feel will benefit from it.


Today is August 31, 2019. If you are reading this article later than this date, there may be a later version which you can access by clicking here and selecting the latest version of this article from the top of the Directory and clicking on that. This article is “Live” and the current day graphics will update continually as will the Day 2 graphics, the Day 3 Graphics, the Day 3 – 7 graphics and the week – 2 graphics. So the graphics always update but the latest version of the article has my updated commentary and updated NOAA discussions when we update those which may be daily or every two days depending on how fast conditions are changing. So if you have an older version, e.g. from an email you received yesterday, the graphics are always current but if you want to be sure you have the most current discussions, click here and then click again to go to the most recently published version. It is our goal to provide the most current information and discussion practical.


Hurricane: but where will it eventually impact land?

cone graphic

We will be providing the Discussions and Advisories now, updating at least daily and probably twice a day. For those who need the most recent update, one can find it here.

August 31, 2019 11 am NWC Discussion on Dorian Part I

11 am August 31, 2019 Dorian Discusion Part II

Here is a different look:

You can use the + and – to zoom in or out and you can scroll the map. I recommend that you first look for where you can click to see the full map meaning a large version of the map and then use the “+” to zoom in to areas along the track where you have an interest. I used a different setting initially but I think this works better as it will show all storms.

Now, the Day One and Two CONUS Forecasts: These Maps Update Daily.

Day One CONUS Forecast

Day Two CONUS Forecast

Day 1 Forecast Map

Day 2 Forecast

These graphics update and can be clicked on to enlarge. You can see where the weather will be

Legend

This is the time of the year we pay special attention to Tropical Events

First looking at the Atlantic and the Gulf of Mexico

https://www.nhc.noaa.gov/xgtwo/two_atl_5d0.png

cone graphic

We will be providing the Discussions now but not updating it every three hours but more like every twelve hours. For those who need the most recent update, one can find it here.

The key question last night was “WILL THIS STORM ACTUALLY HIT FLORIDA OR WILL IT TURN NORTH BEFORE IT REACHES FLORIDA?”

It is not relevant now but the below is our analysis from last night we will leave it up until we republish tonight.

This mid-atmosphere graphic may be useful

https://www.wpc.ncep.noaa.gov/medr/d3500wbg.gif

I do not see enough information here to have an opinion.

Day 3 Surface

Call me wacky but from this surface forecast the path of least resistance may be north not northwest.

Current Jet Stream

This does not help either. Further north we see the Jet Stream and where the Jet Stream is incoherent we still see the vectors showing the wind direction and strength. But where Dorian is it seems that Dorian is creating the wind vectors not being impacted by them.

SST Daily Anomaly Thumbnail

That water over which Dorian will pass is not particularly warm but normal to very slightly warm

We will not take a position contrary to the National Hurricane Center but we will not be surprised if this storm does not go aground in Florida. That leaves a lot of possibilities further north. We also have questions about the strength of this storm as it gets closer to Florida. It may then be getting weaker, not stronger.

We were correct and had some other tools at our disposal that we did not have permission to publish but certainly, NOAA is not at fault for an abundance of caution and this storm could change track again.  But for now the risk seems to have been shifted north and we hope that it actually continues to change track and just go out to sea which is possible. 

Some History

This may be only a partial list of prior Florida Hurricanes but it is our initial effort to provide some context to the current situation. Unfortunately, I do not have them set up so that you can click on each separately and get the history. But if you search on each Hurricane Name, you will find lots of information on each one.

Hurricanes Part I August 30, 2019
Florida Hurricanes Part II August 30, 2019

Switching to the Eastern Pacific

cone graphic


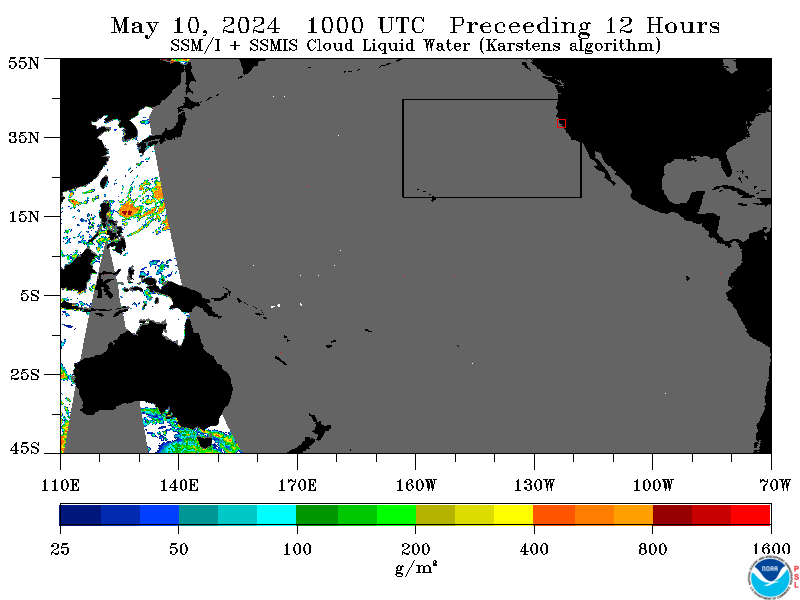
And the Central Pacific.

Central Pacific Storms

Updates on individual named storms can be obtained here.

And the Western Pacific


Here is the current daily Short-Term Forecast

August 31, 2019 WPC a.m. short term forecast

Click here for updates to this NWS/WPC Discussion.

Looking out farther out. This report does not update during weekends.

August 30, 2019 Day 3 - 7 Hazards.


Click here for updates of the Day 3 -7 Hazards forecast.

The following map shows where mesoscale events are occurring or forecast. If you do not see any areas highlight on this map than there are no mesoscale events taking place or forecast. A mesoscale event is a very serious situation for a very small area and detailed information is provided for these events when they occur or are forecast. If a mesoscale event is shown, click on the map and more detail on the event will be shown.

Two different part of the NWS issue this map and they are not always in agreement although they are pretty close. They (Norman Oklahoma and College Park Maryland) issue the alerts when they realize the need so it is best to look on both maps and click one or both if you see areas highlighted.

https://www.wpc.ncep.noaa.gov/metwatch/latest_mdmap.gif

This next map showing where “Headlines” have been issued for convection (and an animation of the recent movement of storms) should update and you should be able to click on to get additional details but if it does not update when you click on it, click here.

For the Day 2 Outlook click here. For Day 3, click here. For Days 4 – 8 click here. An explanation of the risk codes used can be found here.

SPC Products Overview

There is a slight difference between convection and thunderstorms. The below map shows where “Headlines” have been issued for Thunderstorms. You should be able to click on the map to get additional details but if it does not update, you can click here.

The map below shows the current wildfire risk which becomes more significant as we move into Summer. When you click on this image it takes you to the SPC Fire Warning Page and you get a set of maps for Days 1, 2, 3 – 8, etc. You can then click on those for more detailed information. The map is a bit blurry as I tried to make it a bit larger than the map provided by NOAA but should be able to see where the current wildfire risks are. But if you click on this map, you will get to see three maps that show the risk for different time periods.

Day 1 Fire Weather Outlook

Or for the Day 2 Fire Outlook click here. For the Day 3 – 8 Fire Outlook click here.

Now the Day 3 – 7 Hazards Outlook

https://www.wpc.ncep.noaa.gov/threats/final/hazards_d3_7_contours.png

The orange and red outlined areas are what is of most concerning of the forecasted Day 3 – 7 Hazards. This graphic does not update during the weekend. There is a discussion that goes with this graphic and you can access that discussion here.

The following is provided to help the reader relate the maps to how NWS will describe an area of the U.S.

https://www.wpc.ncep.noaa.gov/bndrys1.gif

Now to our More Detailed Report

This graphic is about Atmospheric Rivers i.e. thick concentrated movements of water moisture. More explanation on Atmospheric Rivers can be found by clicking here or if you want more theoretical information by clicking here. The idea is that we have now concluded that moisture often moves via narrow but deep channels in the atmosphere (especially when the source of the moisture is over water) rather than being very spread out. This raises the potential for extreme precipitation events.

http://cw3e.ucsd.edu/images/gfs/images/ivt_NPac_latest_F0.png

In and of itself Atmospheric Rivers are not a definitive predictor of extreme weather but it shows where concentrated “rivers” of moist air are forecast to be impacting North America and that is part of the equation for severe weather.
Looks like a small AR is not approaching the Northwest and British Columbia.

IVT North America

This view shows a fairly low level of activity. We see Hurricane Dorian far to the right.

This view provides a better view of the Northeast, the Antilles and also Europe.
You can track Hurricane Dorian with this graphic pretty well.

Since the AR imagery was not working recently, we added some substitute images which I will leave in for now. Enjoy.

https://www.esrl.noaa.gov/psd/psd2/coastal/satres/data/images/wx_cl/P3/6hr/recent_clw.png

This is a little different than the AR as it shows all Liquid Water not just thick streams of moisture. Thus it shows more activity than the AR graphic. But if you try to line the two up, you will easily be able to see where the AR is on this graphic. The gray areas are where different satellite images are pieced together to provide a wide view.
 

And the East Coast

These are a little different then the AR imagery as this shows clouds and AR shows streams of moisture in the atmosphere.
You have to really study this graphic to see the outline of CONUS. Lots of activity around Florida. You can see Dorian really well here. It is not real large but it is a perfect Hurricane in many respects.

Here is the web site where this set of images can be found.

500 MB Mid-Atmosphere View

The map below is the mid-atmosphere 3–Day chart rather than the surface highs and lows and weather features. In some cases, it provides a clearer less confusing picture as it shows only the major pressure gradients. This graphic auto-updates so when you look at it you will see NOAA’s latest thinking. The speed at which these troughs and ridges travel across the nation will determine the timing of weather impacts. This graphic auto-updates I think every six hours and it changes a lot. Thinking about clockwise movements around High-Pressure Systems and counterclockwise movements around Low-Pressure Systems provides a lot of information.

https://www.wpc.ncep.noaa.gov/medr/d3500wbg.gif

It is a fairly zonal pattern. The H shown stands for High but it could also stand for Hot. The Four Corners High? It seems to be in a good place for it to be to ramp up the Monsoon but the QPF graphics show some moisture for New Mexico and Arizona but not that much early in the week but more later in the week.

7 Day 500 MB Geopotential Forecast

As of this evening, we see for Day 7 a clear North/South Divide. It will be Hot south of that boundary.
Notice the change in the location of the Four Corners High.
We discuss the various patterns of the Monsoon in our Monday article which can be accessed by going to the Directory here and looking for the most recent version of the Intermediate-Term Forecast Article.
Day 3 Above, 6 BelowDay 4 Above,7 BelowDay 5 Above.
Day 3 500mb HeightsDay 4 500mb Heightshttp://www.wpc.ncep.noaa.gov/medr/d5500wbg.gif
Day 6 500mb HeightsDay 7 500mb HeightsDay 3 to 7 500mb Heights
The above is an advanced look. Our most recent 25 Day Intermediate-Term Forecast might provide additional information. The URL for that report changes each Monday so you can find it on the Econintersect.com website or consult the Directory which can be accessed here.

Here are the precipitation forecasts. First the cumulative for Days 1 – 3

https://www.wpc.ncep.noaa.gov/qpf/d13_fill.gif

This pretty much corresponds to the discussion above.

Then cumulative for Days 1 – 5

5 Day Precipitation

This represents five days of precipitation rather than three days as shown in the earlier graphic.

Then cumulative for Days 1 – 7

https://www.wpc.ncep.noaa.gov/qpf/p168i.gif

The areas that have cumulative seven-day precipitation increase. You can see where QPF is accumulating.
Florida is forecast to be very active. The NAM Monsoon will be more active than recently.

Remember the commentary is generally as of last Night unless updated which is indicated in the lede paragraph. The graphics auto-update so the commentary may not be up-to-date beyond the initial date of publication.

We have to start worrying about heat being a hazard.

Day 3 Maximum Temperature

The Southwest is where the temperature will really be turned up. We now see again some above 110F temperatures forecast. It is becoming late August so it is less likely to have such extreme temperatures now, just hot. But the heat is widespread and pretty hot for this time of the year.

Looking ahead to next week.

http://www.cpc.ncep.noaa.gov/products/predictions/threats/hazards_d8_14_contours.png

Usually, nothing shows in this graphic for the following week as it is usually too far out to be forecasting severe weather. But this graphic auto-updates.
Current watches, warnings, and advisories issued by the agencies of the National Weather Service. Hazards should show up in the various maps but the below links will take you to all outstanding watches and warnings in each category which may include some categories not covered in the various maps or difficult to find. So if there is a category of interest, click on the appropriate link below.
  • Winter Storm Warning
  • High Wind Warning
  • Storm Warning
  • Avalanche Warning
  • Coastal Flood Warning
  • Flood Warning
  • High Surf Warning
  • Flash Flood Watch
  • Gale Warning
  • Winter Weather Advisory
  • Flood Advisory
  • Coastal Flood Advisory
  • High Surf Advisory
  • Heavy Freezing Spray Warning
  • Dense Fog Advisory
  • Small Craft Advisory For Hazardous Seas
  • Small Craft Advisory For Rough Bar
  • Small Craft Advisory
  • Brisk Wind Advisory
  • Hazardous Seas Warning
  • Lake Wind Advisory
  • Wind Advisory
  • Rip Current Statement
  • Gale Watch
  • Winter Storm Watch
  • Flood Watch
  • High Wind Watch
  • Special Weather Statement
  • Air Quality Alert
  • Hydrologic Outlook

Below you will see a number of different maps which are updated in real-time, making this a “live” report. If a part of one or more of the maps shows an area that is highlighted, you can click on it and get the full current report. By having the reader click on these active situations rather than having GEI do so, you will not miss any events in which you might have an interest and which we had not noticed and the page will not get cluttered with warnings, etc that have since expired.

Our focus here are events that are likely to last in the range of six hours but there can be longer or shorter events that are addressed by the Storm Prediction Center which is the main source of the information in this article. Long-term major events like a Hurricane are more likely to be in a separate article. But that may not always be the case. Since in general, all the links on this page transfer you into the NOAA system, in order to get back into this article you need to either close the tab to which you were transferred or click back on the tab that has this article.

Live Warning Maps which If Severe Weather is Shown can be Clicked on to get more detail about these events. If there is a current warning shown on the map, click on the map for additional information related to the event.These maps are updated as risks are identified.
This is the current graphic showing any mesoscale discussions (MD’s) which are in effect over the contiguous United States. Please read the description of the purpose of our MD’s for further information. Details on all valid MD’s may be found on our Current Mesoscale Discussions page.Valid Mesoscale Discussion graphics and text
Convective Outlooks
This is today’s forecast for organized severe thunderstorms over the contiguous United States. Please read the description of the risk categories for further information. You may find the latest Day 1 Outlook available as well as all Outlooks issued today online.Today’s Outlook
Day 1 Convective Outlook graphic and text
This is tomorrow’s forecast for organized severe thunderstorms over the contiguous United States. Please read the description of the risk categories for further information. The latest Day 2 Outlook is available as well as all Outlooks that have been issued today.Tomorrow’s Outlook
Current Day 2 Convective Outlook graphic and text
This is the day after tomorrow’s (day 3) forecast for organized severe thunderstorms over the contiguous United States. Please read the description of the risk categories for further information. The latest Day 3 Outlook is available as well as all Outlooks that have been issued today.Day 3 Outlook
Current Day 3 Convective Outlook graphic and text
This is the day 4-8 forecast for organized severe thunderstorms over the contiguous United States. The latest Day 4-8 Outlook is available as well as all Outlooks that have been issued today. Note: A severe weather area depicted in the Day 4-8 period indicates a 30% or higher probability for severe thunderstorms (e.g. a 30% chance that a severe thunderstorm will occur within 25 miles of any point).Day 4-8 Outlook
Current Day 4-8 Convective Outlook graphic and text
The Thunderstorm Outlooks depict the probability of thunderstorm across the contiguous United States in 4 or 8 hour time periods. The probabilistic forecast directly expresses the best estimate of a thunderstorm occurring within 12 miles of a point. The three probabilistic forecast thresholds are 10, 40, and 70 percent.Thunderstorm Outlook
Current Thunderstorm Outlook graphic and text
Fire Weather Outlooks
This is today’s forecast for organized wildfires over the contiguous United States. Please read the description of the risk categories for further information about this product.Today’s Outlook
Current Day 1 Forest Fire Forecast
This is tomorrow’s forecast for organized wildfires over the contiguous United States. Please read the description of the risk categories for further information about this product.Tomorrow’s Outlook
Current Day 2 Forest Fire Forecast
This is day 3-8 forecast for organized wildfires over the contiguous United States. Please read the description of the risk categories for further information about this product.Day 3-8 Outlook
Current Day 3-8 Forest Fire Forecast
 
Previous Post

These Are The Customers Who Support Sex Trafficking In The US

Next Post

Will The Trade War Escalate In 2020?

Related Posts

Scammers Steal $300K Using Fake Blur Airdrop Websites
Uncategorized

FBI Warns Investors Of Crypto-Stealing Play-to-Earn Games

by John Wanguba
March 10, 2023
Maersk Almost Completing Russia Exit After The Sale Of Logistics Sites
Uncategorized

Maersk Almost Completing Russia Exit After The Sale Of Logistics Sites

by John Wanguba
February 20, 2023
Why Is ‘Staking’ At The Center Of Crypto’s Latest Regulation Scuffle
Uncategorized

Why Is ‘Staking’ At The Center Of Crypto’s Latest Regulation Scuffle

by John Wanguba
February 14, 2023
Mexico's Pemex Dismantled Resources Worth $342M From Two Top Fields
Uncategorized

Mexico’s Pemex Dismantled Resources Worth $342M From Two Top Fields

by John Wanguba
January 20, 2023
Oil Giant Schlumberger Rebrands Itself As SLB For Low-Carbon Future
Uncategorized

Oil Giant Schlumberger Rebrands Itself As SLB For Low-Carbon Future

by John Wanguba
October 26, 2022
Next Post

Will The Trade War Escalate In 2020?

Leave a Reply Cancel reply

Your email address will not be published. Required fields are marked *

Browse by Category

  • Business
  • Econ Intersect News
  • Economics
  • Finance
  • Politics
  • Uncategorized

Browse by Tags

adoption altcoins bank banking banks Binance Bitcoin Bitcoin market blockchain BTC BTC price business China crypto crypto adoption cryptocurrency crypto exchange crypto market crypto regulation decentralized finance DeFi Elon Musk ETH Ethereum Europe Federal Reserve finance FTX inflation investment market analysis Metaverse NFT nonfungible tokens oil market price analysis recession regulation Russia stock market technology Tesla the UK the US Twitter

Archives

  • September 2023
  • August 2023
  • July 2023
  • June 2023
  • May 2023
  • April 2023
  • March 2023
  • February 2023
  • January 2023
  • December 2022
  • November 2022
  • October 2022
  • September 2022
  • August 2022
  • July 2022
  • June 2022
  • May 2022
  • April 2022
  • March 2022
  • February 2022
  • January 2022
  • December 2021
  • November 2021
  • October 2021
  • September 2021
  • August 2021
  • July 2021
  • June 2021
  • May 2021
  • April 2021
  • March 2021
  • February 2021
  • January 2021
  • December 2020
  • November 2020
  • October 2020
  • September 2020
  • August 2020
  • July 2020
  • June 2020
  • May 2020
  • April 2020
  • March 2020
  • February 2020
  • January 2020
  • December 2019
  • November 2019
  • October 2019
  • September 2019
  • August 2019
  • July 2019
  • June 2019
  • May 2019
  • April 2019
  • March 2019
  • February 2019
  • January 2019
  • December 2018
  • November 2018
  • October 2018
  • September 2018
  • August 2018
  • July 2018
  • June 2018
  • May 2018
  • April 2018
  • March 2018
  • February 2018
  • January 2018
  • December 2017
  • November 2017
  • October 2017
  • September 2017
  • August 2017
  • July 2017
  • June 2017
  • May 2017
  • April 2017
  • March 2017
  • February 2017
  • January 2017
  • December 2016
  • November 2016
  • October 2016
  • September 2016
  • August 2016
  • July 2016
  • June 2016
  • May 2016
  • April 2016
  • March 2016
  • February 2016
  • January 2016
  • December 2015
  • November 2015
  • October 2015
  • September 2015
  • August 2015
  • July 2015
  • June 2015
  • May 2015
  • April 2015
  • March 2015
  • February 2015
  • January 2015
  • December 2014
  • November 2014
  • October 2014
  • September 2014
  • August 2014
  • July 2014
  • June 2014
  • May 2014
  • April 2014
  • March 2014
  • February 2014
  • January 2014
  • December 2013
  • November 2013
  • October 2013
  • September 2013
  • August 2013
  • July 2013
  • June 2013
  • May 2013
  • April 2013
  • March 2013
  • February 2013
  • January 2013
  • December 2012
  • November 2012
  • October 2012
  • September 2012
  • August 2012
  • July 2012
  • June 2012
  • May 2012
  • April 2012
  • March 2012
  • February 2012
  • January 2012
  • December 2011
  • November 2011
  • October 2011
  • September 2011
  • August 2011
  • July 2011
  • June 2011
  • May 2011
  • April 2011
  • March 2011
  • February 2011
  • January 2011
  • December 2010
  • August 2010
  • August 2009

Categories

  • Business
  • Econ Intersect News
  • Economics
  • Finance
  • Politics
  • Uncategorized
Global Economic Intersection

After nearly 11 years of 24/7/365 operation, Global Economic Intersection co-founders Steven Hansen and John Lounsbury are retiring. The new owner, a global media company in London, is in the process of completing the set-up of Global Economic Intersection files in their system and publishing platform. The official website ownership transfer took place on 24 August.

Categories

  • Business
  • Econ Intersect News
  • Economics
  • Finance
  • Politics
  • Uncategorized

Recent Posts

  • Addresses With Over 1 Bitcoin Surge To New Highs: Investor Optimism Soars
  • Unlocking the Future: Google’s Game-Changing Move to Advertise NFT Games Starting September 15th
  • Bitcoin Is Finally Trading Perfectly Like ‘Digital Gold’

© Copyright 2021 EconIntersect - Economic news, analysis and opinion.

No Result
View All Result
  • Home
  • Contact Us
  • Bitcoin Robot
    • Bitcoin Profit
    • Bitcoin Code
    • Quantum AI
    • eKrona Cryptocurrency
    • Bitcoin Up
    • Bitcoin Prime
    • Yuan Pay Group
    • Immediate Profit
    • BitIQ
    • Bitcoin Loophole
    • Crypto Boom
    • Bitcoin Era
    • Bitcoin Treasure
    • Bitcoin Lucro
    • Bitcoin System
    • Oil Profit
    • The News Spy
    • British Bitcoin Profit
    • Bitcoin Trader
  • Bitcoin Reddit

© Copyright 2021 EconIntersect - Economic news, analysis and opinion.