Written by Sig Silber
Updated at 5:30 p.m. EDT August 30, 2019 to reflect the updated Week 3 – 4 Forecast.
There has been no improvement in the prospects for this year’s crops. The Intermediate-Term weather prospects are not favorable. Our special feature this week is a review of what weather conditions were in July, Internationally.

Please share this article – Go to the very top of the page, right-hand side, for social media buttons. Please feel free to send this article to anyone who you think might benefit from reading it.
New Format: Each week our Thursday night article will cover the Drought Monitor Report issued by NOAA in conjunction with the University of Nebraska – Lincoln and a summary of U.S. crop conditions. It provides a link to the Severe Weather Report (this will take two clicks since that report gets republished each day and so you click here to get to the Directory and then click again on the version of the Severe Weather Report closest to the top of the list. Soon, we may have a link to a full weather report, not just severe weather. Each week, this article will have a different special feature. Examples of special features might be: A. a more detailed look at crop progress B. a review of the prior month’s weather. C. a review of the prior month’s International Weather (We do that this week.) D. Current conditions of rivers and reservoirs. E. Economic Impacts other than crop-related F. Other. |
A little focus on Australia.

Click on the above to get the youtu.be
Here is another view of precipitation in terms of percent of normal. It is to some extent a proxy for brushfires which is of concern this time of the year.

And here is the precipitation for the prior week.

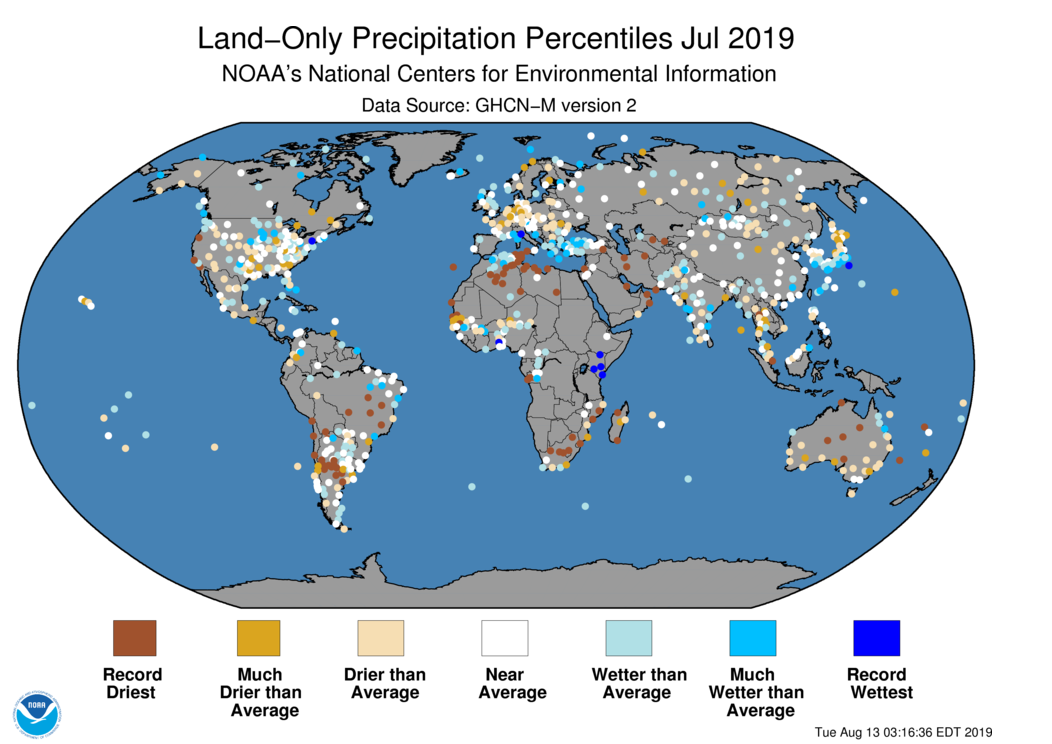
And the full month of July, 2019

And now we review July Weather for other selected areas. The full set can be accessed here.
Starting with Europe.


Some Summary Graphics

Here is a slightly different way of looking at this

And shifting to the Alaska and CONUS Weather Forecast
First Temperature
|
|
|
|


And then Precipitation
|
|
|


Here is the discussion that was released with the updated Week 3 – 4 Forecast.
Week 3-4 Forecast Discussion Valid Sat Sep 14 2019-Fri Sep 27 2019
The Weeks 3-4 period comes on the heels of a somewhat amplified circulation pattern during Week-2. The dynamical model consensus for Weeks 3-4 favors a slight eastward progression of the Week-2 forecast pattern, with anomalous troughing favored southeast of the Aleutians and anomalous ridging centered over far southwestern Canada. Above-normal 500-hPa heights are forecast to extend across nearly the entire CONUS, with a relative minimum in positive height anomalies extending form the Great Lakes to the Southern Plains (most prominently in the SubX dynamical guidance). Anomalous troughing before the period over the Northeast is forecast to lift northeastward resulting in above-normal heights forecast during Week-3. Canonical tropical forcing due to MJO- or ENSO-related convective anomalies is not expected to play a significant role during the period.
The temperature forecast is based largely on the objective blend of calibrated dynamical model guidance and the MLR statistical tool that emphasizes long-term trends. Experimental SubX guidance is also utilized to make small adjustments to the objective blend, though the various models are in overall good agreement. The forecast pattern appears dominated by long-term trends and amplified by forecast anomalous ridging over the western CONUS and Alaska. Long term trends also seem to dominate the forecast over the eastern seaboard. Over parts of the central CONUS, there is broad model agreement on an area favoring below-normal temperatures, perhaps due to anomalous northerly surface flow near a mean frontal boundary.
There is more disagreement among precipitation tools during this forecast period. The SubX suite of guidance depicts a much wetter solution over the central CONUS than the other dynamical guidance. The objective autoblend does not depict any large-scale regions favoring above-normal precipitation over the CONUS. The forecast is constructed by tweaking the autoblend toward the SubX guidance, while maintaining some continuity with the previously issued Weeks 3-4 forecast. Below-normal precipitation is favored over much of the eastern CONUS where there is modest model agreement, as well as over parts of the northern Rockies and interior Northwest near and just east of the anomalous ridge axis. Above-normal rainfall is favored over a region centered on the Alaska Panhandle, extending to both southern Alaska and the northwestern tip of the CONUS, consistent with the anomalous trough forecast over northeastern Pacific. A small area favoring above-normal precipitation is depicted over parts of the south-central CONUS consistent with SubX guidance. It is important to note, though, that our forecast does not take into consideration any potential tropical cyclone activity, and a single storm could easily affect the total Week 3-4 rainfall over the East.
Observed above-normal sea surface temperatures and dynamical model guidance from the SubX suite strongly support above-normal temperatures during the Weeks 3-4 period across Hawaii. A consensus of the operational and SubX dynamical models predicts likely above-normal precipitation for the Hawaiian Islands.
Current Drought Conditions
Now we take a look at Thursday’s U.S. Drought Monitor Report.
The U.S. Drought Monitor is a comprehensive way of understanding the drought situation for the U.S. It is issued every Thursday and reflects the conditions as of the prior Tuesday. Drought is defined as a moisture deficit bad enough to have social, environmental or economic effects. Thus, more factors than recent precipitation are considered and more information on how it is done is found at the end of this report.

U.S. Affiliated Pacific Islands and the U.S. Virgin Islands.

Below is the map for just CONUS.
 |
 |
| Last Week | This Week |
| |

Some might find this animation of twelve weeks of change useful;

The graphic below shows the one-week change in drought intensity. Yellow is bad. Green is good.
|

Now we show the week to week change information by region. The yellow is where the level of drought has been raised. The green is where the level of drought has been lowered.
 |
| Improvement in North Dakota, Mixed in Kansas and deterioration in Colorado. |
 |
| Improvement to the south and deterioration to the north. |
 |
| Deterioration in New York State, New Hampshire, and Vermont |
 |
| Quite a mixed pattern except for deterioration in Northern Louisiana and Eastern Texas and Improvement in Western Oklahoma. But it looks like a checkerboard pattern for the most part. |
 |
| Mostly improvement. |
 |
| Arizona and New Mexico deteriorated. Colorado has deteriorated but was also shown in the High Plains Region for some unknown reason. Extreme Southeast California also deteriorated as part of the failed Monsoon. |

Here is the Discussion that was issued with the Drought Report.
This Week’s Drought Summary
Summer thunderstorms brought heavy rainfall to the Central Plains into parts of the Northeast, with showers and thunderstorms also occurring across parts of the Northwest, Southern Rockies, and Central Gulf Coast. Below-average temperatures accompanied the heavy precipitation for the most part. The Southwest saw little to no rain and record to near-record heat, while heat and humidity continued to the east. The above-average temperatures and dry conditions brought elevated fire risk over the Great Basin and portions of the northern Intermountain West. South central Alaska remained dry and fires continued to burn, with smoke warnings in effect. Heavy rains, flash flooding, and severe weather occurred as a front stretched from the Southern Mid-Atlantic into the Southern Plains.
Northeast
Much of the Northeast has received near- to above-average rainfall over the summer months, but with some areas receiving below-average amounts. This week abnormally dry conditions (D0) spread a bit southward in northern New York and eastward across northern Vermont and New Hampshire and just into Maine. Agricultural impacts have been reported in Monroe County in western New York where precipitation has been around 60 percent of normal over the past couple of months. Abnormal dryness was introduced here this week.
Southeast
This past week beneficial rains fell across parts of the Southeast that have been in some form of dryness or drought, with locally heavy amounts observed. A swath of the Midlands and Upstate South Carolina received at least two inches of precipitation, with some areas observing close to six inches (McCormick, for example, reported 6.20 inches in a 24-hr period). This stretch returned to normal conditions and moderate drought (D1) was reduced in Aiken County near the Georgia border. Some areas missed out on the rain, however, and D1 spread northward to southern Sumter and eastern Richland Counties. Normal conditions also returned to part of south central North Carolina to the east of Charlotte and in part of the coastal region around New Bern over to northeastern Bladen County. In Georgia, precipitation was mixed. Moderate drought expanded near the South Carolina border and was introduced in part of the Atlanta Metro area. However, to the east beneficial rains allowed for improvement in Washington and Hancock Counties. Improvements were also seen in parts of central Alabama, from the north to the south, including improvements of D1 and D2 (severe drought) in Jefferson, Bibb, and Tuscaloosa Counties.
South
Texas, Oklahoma, Arkansas, and Louisiana saw sharp gradients and some complicated rainfall patterns, with heavy precipitation in some places and little to none in others, and so many areas saw improvement in short-term dryness and drought while many others saw degradation. Conditions improved across part of the Oklahoma Panhandle into northern Texas and also in in the central region and southeast, but there was also a degradation to extreme drought (D3) along the Texas border, encompassing parts of Kiowa, Comanche, Cotton, and Tillman Counties (and northern Wichita and northeastern Wilbarger County in Texas) where rain was scarce. This is the first occurence of D3 in Oklahoma since September 2018. Temperatures here were in the 105-109 degree F range. In Texas, the D3 area to the west expanded, as did the D3 area in the extreme south, with a new small spot as well. Primary impacts across the state include wildfires, dry stock tanks, supplemental feeding, and impacts to late-season crops, namely cotton. Moderate drought spread from east Texas into southwestern Arkansas and northwestern Louisiana. Abnormal dryness also spread eastward to south central Arkansas and central to northeastern Louisiana.
Midwest
Moderate drought (D1) was introduced across northern Michigan and the eastern Upper Peninsula this week. Abnormal dryness also spread from the south northeastward to the Saginaw Bay. There are reports of impacts to forage yields and concerns about annual crop production, in addition to general drying out of some soils. Abnormal dryness (D0) also expanded slightly in northern Minnesota and spread from Iowa into southern Minnesota. Part of central Iowa already experiencing dryness also saw D0 expansion, while the southeast saw an expansion of D1. Across Indiana, rainfall over the past week diminished in intensity and coverage as fronts moved from northwest to southeast. Areas of D0 decreased in the north, west central and south central portions of the state. All three D1 areas also shrank across the state as the beneficial rains fell. Missouri received around 2 inches of rain over the past week or two across most of the areas designated as abnormally dry, which is well over twice (or more) the normal amount. With no impacts reported, the entire state has now returned to normal conditions. In Kentucky, rain was widespread, steady, and long, just the kind of rain to soak into the soil and improve drought conditions. The area of D1 in central Kentucky that was introduced last week disappeared this week, and the area of D0 shrank significantly. With respect to agriculture, the rain, combined with cooler temperatures, will help eliminate agricultural impacts and should help double crop soybeans.
High Plains
In the Northern High Plains, normal conditions returned along the western to central North Dakota/Canadian border. Precipitation has been adequate and soil moisture conditions have improved. In the Southern High Plains, rainfall has been below average over the last couple of months – including the past week – in eastern Colorado while temperatures have been above average. Several areas of abnormal dryness were introduced this week, including in the central Colorado Mountains over the higher elevations, eastern Larimer and western Weld Counties and Colorado springs, and in Las Animas. With the heat, evaporative demand has been high for many of these locations. Reports from water providers indicate that there has been peak demand in the last week with lawn irrigation. Peak demand usually occurs in July. Southwestern Kansas has also seen a dearth of precipitation, and both D0 and D1 expanded westward in this area. The rest of the state, on the other hand has seen plentiful rainfall and D0 contracted westward in the central and south central region.
West
With respect to precipitation, 2019 to-date is a year of extremes in parts of the West. As monsoon rains continue to fail and heat continues to build, impacts, including wildfire risk, are growing in the Southwest. After emerging from nearly a decade of drought conditions on June 11, moderate drought (D1) returned to both the eastern and western parts of Arizona this week, and abnormally dry (D0) conditions spread across much of the rest of the state, save for part of the south. Locally, many areas are experiencing one of their 10 driest monsoon seasons on record. Phoenix is also on track to have its third or fourth hottest June-August period on record and Tucson its second hottest. The D1 that spread to eastern Arizona also spread over the remainder of northwestern New Mexico into southwestern Colorado and southeastern Utah at the Four Corners. In New Mexico, D1 in the south expanded eastward from Sierra County to the D1 area at the Texas border. Abnormally dry conditions also spread outward across the southwestern states, including across Imperial County, California, to join with the long-lasting D0 area in San Diego, Orange, and Riverside Counties.
Alaska, Hawaii, and Puerto Rico
Dry conditions — and fires — continued in south central Alaska this past week, with smoke filling the air across large regions. With continued fire danger, severe drought (D2) spread across the remainder of the southern Kanai Peninsula, part of the Alaska Peninsula, and encompassed Kodiak Island. Moderate drought (D1) was extended to the Bristol Bay area, with fire buildup indices approaching 100. Also based on the fire risk, the area of extreme drought (D3) expanded in the northern Kenai Peninsula to the Swan Lake Fire area. Additionally, more water shortages have been reported in south central Alaska, including impacts to the community water supply in Nanwalek and drying of streams that provide salmon spawning habitat, namely Jaklof Creek near Seldovia. The communities of Seldovia, Chignik Lagoon, Chignik Lake, and Tatilek are also reporting water shortages and boil water advisories.
Hawaii has been dry over the past week, especially over the mid-section of the island chain. On Oahu, moderate drought (D1) was introduced along the lower elevations of the south facing slopes of Oahu and also over the western half of Molokai. Additionally, abnormally dry conditions (D0) spread across the remainder of Maui.
No changes were made for Puerto Rico this week.
Pacific Islands
The weather pattern during this USDM week (8/21/19-8/27/19) began with a monsoon trough which stretched from the Marianas and northern Palau across the Federated States of Micronesia (FSM) to the northern Marshall Islands (RMI). The eastern end of the monsoon trough gradually eroded as the week progressed. A weak but broad circulation moved slowly westward across central to western Micronesia, following the pressure weakness of the monsoon trough and bringing areas of rain with it. Surface troughs combined with divergence associated with upper-level troughs and lows at times, especially over the RMI and north of the FSM and, later in the week, over western Micronesia. Trade-wind convergence and disturbances also brought rain to parts of the RMI. South of the equator, high pressure dominated the Samoan Islands for most of the week; a surface trough brought some showers as it crossed American Samoa later in the week.
Satellite-based estimates of 7-day precipitation (QPE) showed a continuous band of 2+ inches of rain stretching along the monsoon trough from the South China Sea southeastward to the equator in Kosrae State. Areas of 4+ inches of rain were embedded within this band over Micronesia. Another area of 2 to 4+ inches of rain was indicated over the RMI, mainly the northern and eastern sections. A region of less than 2 inches appeared on the QPE over northern portions of eastern FSM. Spots of 1+ inches of rain were seen on the QPE north, south, and west of the Samoan Islands, with a band of light rain (0.5-1.0 inch) crossing north-south across American Samoa.
It was a wet week (more than the 2-inch weekly minimum needed to meet most water needs) in Palau. The International Airport recorded 4.02 inches of rain for the week, bringing the monthly total to 9.91 inches which is above the 8-inch monthly minimum, so D-Nothing continued.
The Marianas had a wet week (more than the 1-inch weekly minimum needed to meet most water needs). Guam reported 4.02 inches for the week, 2.94 inches of which fell on August 26, setting a new daily record. At Saipan, 1.76 inches were recorded in the manual gauge, 1.34 inches in the NPS automated gauge, and 1.20 inches in the ASOS gauge; Rota had 1.01 inches. The monthly totals (through August 27th) were well above the 4-inch monthly minimum, with 18.25 inches at Guam, 17.96 inches at Saipan, and 16.13 inches at Rota, so D-Nothing continued.
In the FSM, Ulithi had no data and could not be analyzed. The driest stations occurred in the northeast, with Pingelap reporting 0.60 inch of rain for the week and Fananu 1.82 inches. The rest of the stations were wet (more than the 2-inch weekly minimum), with amounts ranging from 2.09 inches at Pohnpei to 5.66 inches at Lukonor, 5.77 inches at Nukuoro, and 6.48 inches at Yap. For the month so far (through the 27th), August was wet (more than the 8-inch monthly minimum), so all analyzed FSM stations continued as D-Nothing.
The spotty rainfall pattern in the RMI resulted in dry areas where Jaluit reported 0.05 inch of rain, Utirik 1.56 inches, and Ailinglapalap 1.71 inches, contrasting with wet areas. On the wet side, Kwajalein recorded 2.61 inches, Majuro 2.81 inches, and Mili 5.39 inches. Wotje reported 0.40 inch for the week through August 27th, but 4 days were missing so Wotje could not be analyzed. With a very dry week, and only 4.89 inches of rain for the month so far, Jaluit continued at D2-SL. The rest of the stations had monthly totals more than the 8-inch monthly minimum. Utirik was dry this week, so D1-L continued to reflect the prolonged dryness of November 2018-July 2019. With Kwajalein wet for the week (2.61 inches) and month (9.76 inches so far), and rain falling on most days this month, the status was changed from D1-L to D-Nothing. Majuro had 2.81 inches of rain this week, which is 10.27 inches for the month through August 27th; according to xmACIS2, this is above the monthly normal for this date of 9.91 inches. Compared to data for full Augusts, 10.27 inches ranks August 2019 as the 23rd driest August out of 66 years of data. The reservoir storage level on August 27th was at 28.671 million gallons, which is right at the 80% of maximum threshold, so the status was changed from D0-S to D-Nothing. D-Nothing continued at Ailinglapalap and Mili.
The week was dry so far in American Samoa, with weekly rainfall totals 0.86 inch at Pago Pago, 0.89 inch at the automated station at Siufaga Ridge, and 0.46 inch at the automated station at Toa Ridge. But last week was wet and the month is wet at Pago Pago, so D-Nothing continued at Tutuila.
Virgin Islands
Fast-moving showers embedded in the easterly trade winds brought rain to parts of the U.S. Virgin Islands (USVI) at the beginning of this USDM week (8/21/19-8/27/19). A tropical wave continued the rain for the first half of the week, then a weak mid- to upper-level ridge became dominant. A drier and stable air mass, accompanied by suspended Saharan dust, controlled the weather during the last half of the week. Tropical Storm Dorian was still well southeast of the USVI by the time this USDM week ended (Tuesday at 12z). Radar-based estimates of rainfall for the 7 days ending at 12z on Tuesday depicted areas of 0.5-1.0 inch of rain across the three main USVI islands, with heavier amounts offshore to the west.
Henry Rohlsen AP had an inch (1.01) of rain this week, and the Christiansted 1.8 ESE CoCoRaHS station measured 1.81 inches, so St. Croix was wet. The monthly total at Rohlsen AP was 2.86 inches, which is slightly above normal. The rain didn’t seem to have an effect on the well level at Adventure 28 which continues low and continues to fall. The year-to-date rainfall at Rohlsen AP was 15.61 inches, 4.06 inches below normal or 79% of normal. Since the week was wet, the D1-L was changed to D0-L, with the D0-L reflecting lingering dryness as reflected in the 9- and 12-month Standardized Precipitation Index (SPI) and below-normal year-to-date rainfall.
St. Thomas missed out on the beneficial rains, with only 0.28 inch measured at the Cyril E King AP and 0.09 inch at the CoCoRaHS station at Anna’s Retreat. The monthly total at King AP was 2.16 inches, which is 1.02 inches below normal or about 68% of normal. The Grade School-3 Well level is continuing to fall. The year-to-date rainfall at King AP was 18.85 inches, which is 0.74 inch below normal or 96% of normal, and the 12-month SPI shows D0 conditions, so St. Thomas continues as D0-L.
On St. John, three quarters of an inch (0.74) of rain was reported by the volunteer observer at Windswept Beach. This brings the monthly total to 3.29 inches, which is below the long-term average, and the yearly total to 18.79 inches, which is 77% of the long-term average. The USGS Susannaberg DPW 3 Well shows groundwater levels that continue low with little improvement. As a result, D0-L continued on St. John.
Looking Ahead
Over the week beginning Tuesday, August 27, according to NOAA’s Climate Prediction Center, dry conditions are expected to continue across southern Texas and much of the western third of the continental U.S., while light to heavy rainfall may occur across the remainder of the country. Parts of Kansas may receive up to about 4 inches, with isolated higher amounts. Hurricane Dorian will bring heavy rain and potential flooding to Puerto Rico and Florida, where 4-8 inches of rain are expected from the storm, with locally higher amounts. Looking further ahead to September 2-6, below-normal temperatures are favored across Maine and parts of the Northern Plains and Midwest, nosediving into Oklahoma and northern Arkansas, while above-normal temperatures are forecast forAlaska, the western third of the CONUS, across most of Texas, and into the Southeast and Mid-Atlantic states. Much of the Southwest and Alaska are both favored to have some badly needed above-average precipitation, as is the Southeast and the northern tier of the CONUS. There are enhanced probabilities of below-normal precipitation for the Southern and Central Plains into parts of the Midwest. Please note the forecast confidence for this period is above average, according to CPC.
Some may find this way of looking at things useful and I hope these graphics are not too small to read. I did not make them so you could click on them individually but you can click on the whole graphic and it may enlarge. But I think you get the picture. It has been a rapid onset and demise. When you read these graphics, remember that the older graphics are not the drought conditions that existed then but the change from then until now.

Let’s focus on the change between July 30, 2019 and August 27, 2019 i.e. a month. .

Drought Forecasts
First, we show the forecast through November which was issued on August 15, 2019 (to be updated on September 19, 2019). These two forecasts are issued by the same agency but to obtain them you need to access two different links here and here.
Here is the Three-Month Forecast which was issued on August 15, 2019

It does not look too bad except for South Texas.
Here is the Monthly Drought Outlook which was updated on July 31, 2019

Floods remain a concern but only in a limited area.

| Last Week | Current Week |
|
|

Let’s see if this animation works. It shows the pattern for August.

Active Major Fires


Looking out another month.


Severe Weather

Crop Progress
Recently, we looked at the individual crop progress reports graphically from this source. Last week we reviewed this Executive Summary Report which provides projections of the ultimate harvest. We will be doing that again probably in two weeks as it is a monthly report.
But for now, we will look at the season to date information summary.

| Crop | Crop Progress | Crop Condition |
| Corn | Very Very slow (Dough and Denting) | Very Bad |
| Soybeans | Slow (Blooming) Very Slow (Setting Pods) | Very Bad |
| Winter Wheat | Slightly Slow (Harvested) | Very Good |
| Spring Wheat | Very, Very Slow (Harvested) | Bad |
| Cotton | OK (Setting Bolls) Good (Opening) | OK |
| Sorghum | Slow Headed and Very Slow (Coloring) Slow (Mature) | Very Good |
| Rice | OK(Headed) Slow (Harvested) | Bad |
| Oats | Very Slow (Harvested) | Bad |
| Barley | Very, Very Slow (Harvested) | OK |
| Peanuts | Ok(Pegging) | Very Bad |
| Sugar Beets | Slow (Planted) but caught up. | NA |
| Sunflowers | Slow (Planted) but caught up. | NA |
The following table summarizes the situation. It has changed a bit since last week.
| Crop development Early | OK | Crop Development Late | |
| Crop Condition Good | Winter Wheat Sorghum | ||
| Crop Condition OK | Cotton | Barley | |
| Crop Condition Bad | Peanuts | Corn Soybeans Spring Wheat Rice Oats |
This provides some additional information: There are many factors that have led to the current situation but one is the amount of sunshine other causes of temperature and it has been inadequate.

Side by Side
|
|
Looking at Pan Evaporation

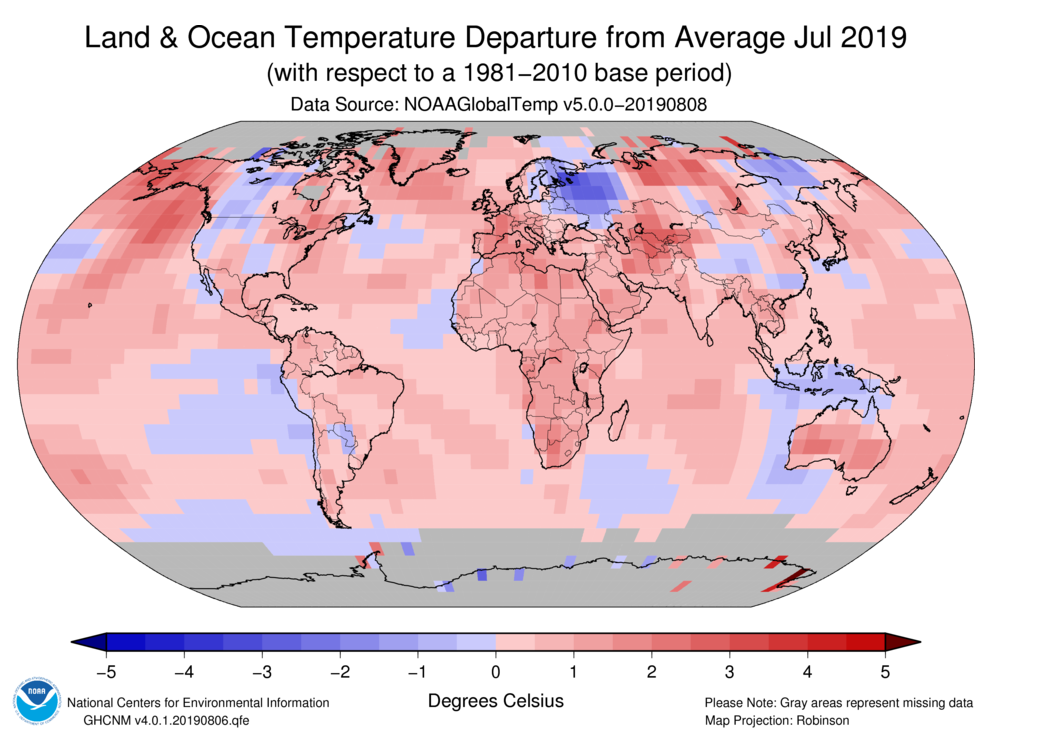
International

A map helps and is not always available and fortunately, it was available this week.

Major Sources of Information
In the box are shown the major resources we use. We will not be using them all each week but the reader is welcome to refer to these resources.
Major Sources of Information Used in this Weekly Report
|
Background Information


The sequence of drought occurrence and impacts for commonly accepted drought types. All droughts originate from a deficiency of precipitation or meteorological drought but other types of drought and impacts cascade from this deficiency. (Source: NDMC)
Source: National Drought Mitigation Center, University of Nebraska-Lincoln


