Written by Sig Silber
Updated at 3:30 am EDT August 17, 2019 to clarify my comments relative to the new Week 3 – 4 Forecast
Tonight, we focus first on revisiting July weather – then we continue to report on crop progress. Flooding is no longer the problem of maximum concern but now the bigger issue may be insufficient precipitation. Most crops are in catch-up mode and need both moisture and heat but not too much or too little of either. We, of course, provide the key information from the Drought Monitor which shows a lessening of the almost complete absence of drought. However, the new Drought Forecast through November is not suggestive of a return of serious drought conditions.

Please share this article – Go to the very top of the page, right-hand side, for social media buttons. Please feel free to send this article to anyone who you think might benefit from reading it.
New Format: Each week our Thursday night article will cover the Drought Monitor Report issued by NOAA in conjunction with the University of Nebraska – Lincoln and a summary of U.S. crop conditions. It provides a link to the Severe Weather Report (this will take two clicks since that report gets republished each day and so you click here to get to the Directory and then click again on the version of the Severe Weather Report closest to the top of the list. Soon we will have a link to a full weather report, not just severe weather. Each week, this article will have a different special feature. We have not worked that out yet but most likely those features might be: A. a more detailed look at the prior month’s crop progress B. a review of the prior month’s weather (featured this week) C. a review of the prior month’s International Weather D. Current conditions of rivers and reservoirs. E. Economic Impacts other than crop-related F. Other. Tonight we report on Soil Moisture |
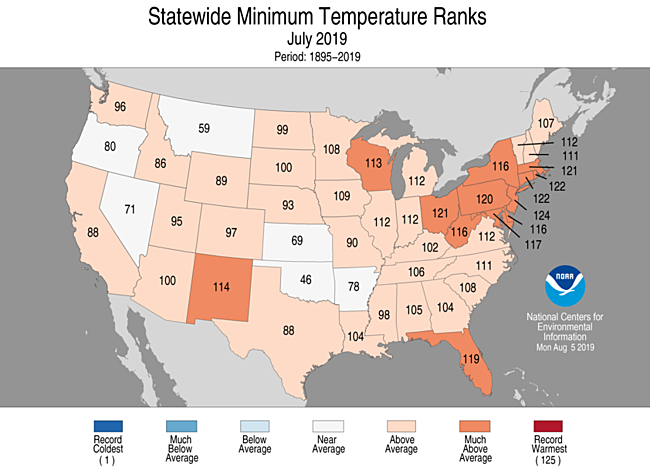
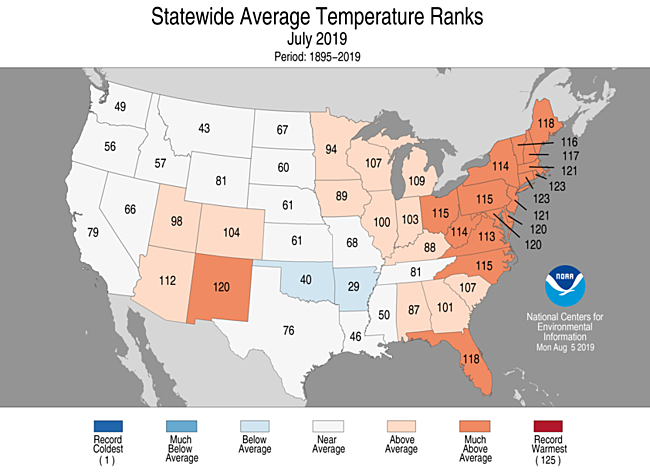
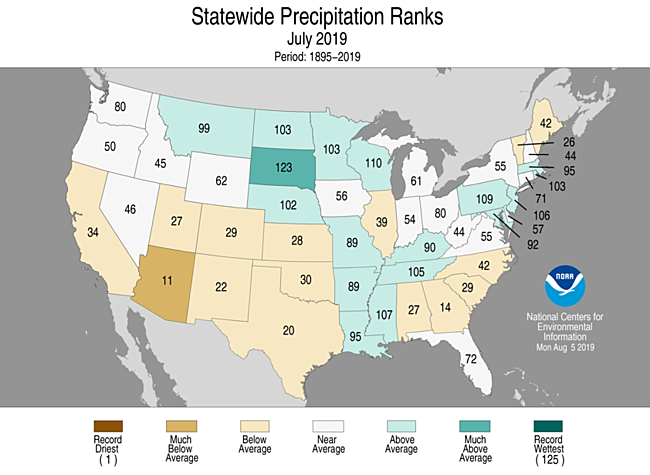
Let’s review July: This graphic shows the data in terms of the ranking of the temperature or precipitation relative to the 125 years of forecast data in the system.

This might provide additional perspective

And the forecast
First Temperature
|
|
|
|


And then Precipitation
|
|
|


Here is the discussion that was released with the Week 3-4 Update.
Week 3-4 Forecast Discussion Valid Sat Aug 31 2019-Fri Sep 13 2019
ENSO-neutral conditions currently are present across the equatorial Pacific Ocean. Equatorial sea surface temperatures (SSTs) are above average across the western and central Pacific Ocean and are below average in the eastern Pacific. The RMM MJO index indicates that the MJO signal was incoherent and weak over the past several days. The GEFS and ECMWF ensemble models are in reasonably good agreement as the MJO is expected to remain weak during Week-1, while some ensemble members prefer slight re-strengthening during Week-2. The Week 3-4 Outlook is based primarily on dynamical model forecasts, including the NCEP CFS, ECMWF, and JMA ensemble prediction systems, as well as the Subseasonal Experiment (SubX), a multi-model ensemble (MME) of both operational and experimental ensemble prediction systems. Statistical forecasts, including a multivariate linear regression (MLR) of lagged temperature and precipitation forecasts to current observed MJO and ENSO indices, are also consulted. Decadal timescale temperature trends are also a source of predictability in both dynamical and statistical forecast tools.
Dynamical model guidance from the various models is broadly consistent, depicting a trough over the Aleutians and the cyclonic flow over the northeastern U.S., while subtropical ridging is generally forecast to dominate the southwestern CONUS. The CFS, ECMWF and JMA models indicate positive 500-hPa height anomalies over the western or northwestern CONUS, while the ECMWF and JMA models favor near to below normal 500-hPa height over most of the central and eastern. Both the CFS and ECMWF favor near to above normal 500-hPa heights over mainland Alaska and the Alaska Panhandle, and below normal 500-hPa heights over the Aleutians. All tools (CFS, ECMWF and JMA) indicate near normal 500-hPa heights over Hawaii.
The Weeks 3-4 outlook indicates enhanced probabilities of above normal temperatures over the western CONUS, and along the East Coast, while below normal temperatures are forecast over portions of the High Plains, the Mississippi Valley, the Upper Great Lakes, the Ohio Valley, and the Tennessee Valley, consistent with the majority of the guidance. Above normal temperatures are most likely for Alaska under predicted positive 500-hPa height anomalies and where decadal temperature trends are relatively strong. The highest probabilities of above normal temperatures are over most coastal locations of Alaska due to above normal SSTs in surrounding waters, supported by the CFS/ECMWF/JMA Correlation Weighted tool.
The Weeks 3-4 outlook indicates likely above median precipitation for parts of Wyoming, Colorado, South Dakota, Nebraska, and Kansas, which are consistently highlighted by model guidance and a fairly robust anticorrelation between temperature and precipitation this time of year. There are enhanced probabilities of below normal precipitation across the Pacific Northwest due to predicted above normal 500-hPa heights. Below median precipitation is also more likely for parts of the Ohio Valley, the Tennessee Valley, the Middle Atlantic, and the Southeast, supported by the SubX dynamical models. A precipitation dipole aligned with topography is favored across Alaska with above-normal rains for southern parts of the state and things drying out to the north.
Current Drought Conditions
Now we take a look at Thursday’s U.S. Drought Monitor Report.
The U.S. Drought Monitor is a comprehensive way of understanding the drought situation for the U.S. It is issued every Thursday and reflects the conditions as of the prior Tuesday. Drought is defined as a moisture deficit bad enough to have social, environmental or economic effects. Thus, more factors than recent precipitation are considered and more information on how it is done is found at the end of this report.

U.S. Affiliated Pacific Islands and the U.S. Virgin Islands.

Below is the map for just CONUS.
 |
 |
| Last Week | This Week |
| |

Some might find this animation of twelve weeks of change useful;

The graphic below shows the one-week change in drought intensity. Yellow is bad. Green is good.
|

Now we show the week to week change information by region. The yellow is where the level of drought has been raised. The green is where the level of drought has been lowered.
 |
I again see a number of states with deterioration but there is improvement in Nebraska and Kansas is mixed. |
 |
| Again widespread deterioration. |
 |
| Scattered small areas and before last week we have not seen dry conditions here for a while. |
 |
| Significant deterioration in Texas and Oklahoma and some improvement in the northern part of the region. |
 |
| Here it is widespread deterioration |
 |
Improvement in the Northwest but we also see dry conditions worsening in Arizona and New Mexico and a bit in Utah and Colorado (Four Corners). It can be attributed to the Break in the Monsoon. |

Here is the Discussion that was issued with the Drought Report.
This Week’s Drought Summary
Rainfall this week was highly variable across the eastern two-thirds of the country, which is not unusual during summer. Heavy rain was common in the High Plains, and from the Texas Panhandle and central Oklahoma northward in the Great Plains. Generally 2 to locally 5 inches of rain soaked the Plains from northern and eastern Kansas northward into the central Dakotas, and similar totals were spottier in central Montana, in the middle Mississippi Valley, across northern Minnesota, from the central Ohio Valley through the central Appalachians, over northern New England, and from the Florida Peninsula into southeastern Georgia. Scattered to isolated amounts of 2 to 3 inches were observed from the western half of Tennessee southward to the central Gulf Coast. Farther east, despite isolated moderate rains, only a few tenths of an inch fell on most of the upper Southeast, southern Appalachians, Carolinas, and middle Atlantic region. Several patches from northern California through the Pacific Northwest and northern Idaho recorded 0.5 to locally 2 inches, but most sites received light rain at best. The central and southern Sections of the Rockies and Intermountain West also observed generally light precipitation while no measurable rainfall was almost universal from the Red River to the Rio Grande in Texas, and in central and southern sections of California. The total area enduring abnormal dryness and drought increased, most noticeably in the Ohio Valley, the Midwest, and Texas. Widespread improvement was limited to a broad swath of Alaska from interior northeastern sections to near the Aleutians.
Northeast
Rainfall amounts varied considerably across the region. Most sites recorded 0.5 to 1.5 inches, but some areas reported more (up to 3 inches in northern New England and West Virginia) and others less (a few tenths in the southwestern quarter of Pennsylvania, northern and east-central New York, and the lower reaches of Vermont and New Hampshire). The region remained drought-free, but patches of abnormal dryness (D0) cover northwestern Connecticut and surrounds, northernmost New York, central Vermont and west-central New Hampshire, southern Maine, and southern West Virginia. Only 10 to 40 percent of normal rainfall covered northern New York and southern Maine over the past 30 days while 60-day totals were 50 to 75 percent of normal in central Vermont, west-central New Hampshire, northwestern Connecticut, and southern West Virginia.
Southeast
Showers and thunderstorms were hit-and-miss across the region, but only a few tenths of an inch of rain fell on most of the Carolinas (away from the immediate coast), central and northern Georgia, and the eastern half of Alabama. Rainfall was a little more abundant in western Alabama, Florida, and especially southeastern Georgia. At least a few tenths of an inch fell, and amounts of 1.5 to locally 3.5 inches covered nearly half of these areas. The heavier totals (over 1.5 inches) were more widespread in southeastern Georgia, with 4 to nearly 6 inches soaking a few patches near the Florida border. Dryness and drought improvement were noted in a few small areas where rainfall was heavier, but deterioration was much more common, especially from eastern Alabama through southeastern North Carolina. Most notably, abnormal dryness expanded broadly to cover most of central Georgia and South Carolina. Rainfall deficits of 6 to 9 inches since mid-May were observed in parts of southeastern Alabama and southeastern North Carolina while amounts 3 to 6 inches below normal covered central and southwestern Georgia and a few areas of non-coastal South Carolina.
South
No measurable rain fell on a large area from the Red River Valley southward through Texas east of the Big Bend, extending eastward into southwestern Arkansas and central Louisiana. In contrast, most of northeastern Oklahoma and northern Arkansas were doused by 2 to locally 6 inches of rain. Less remarkable rainfall amounts exceeding one-half inch were recorded in the Texas Panhandle, central and northern Oklahoma, southwestern Tennessee, and Mississippi, with heavy rains approaching 4 inches reported in a few scattered areas. Dryness and drought expanded and intensified, with some degree of dryness now covering northeastern Texas, part of northern Louisiana, central and western Oklahoma, and roughly the western two-thirds of Texas from the upper reaches of Deep South Texas northward to the central Panhandle and the Big Bend. Severe drought was noted in parts of southern Texas, west-central Texas, and in a strip from southwestern Oklahoma westward along the southern fringes of the Texas Panhandle. Parts of these D2 areas received 3 to 6 inches less rainfall than normal over the past 60 days, including most of southwestern Oklahoma and adjacent Texas. Dating back to mid-July, most of Oklahoma (outside the northeastern quarter) and Texas were at least an inch short of normal rainfall; 30-day rainfall totals below 0.5 inch fell on southwestern Oklahoma and a broad swath of central and southern Texas from the Red River and lower Panhandle southward to the lower Rio Grande Valley.
Midwest
Abnormal dryness continued the recent trend of expansion, and a few areas of moderate drought were introduced. Several patches were brought in to central and eastern Iowa, and adjacent Illinois, along with smaller, more-isolated regions in eastern Illinois and northern Indiana. Meanwhile, abnormal dryness stretched to cover most areas from central Iowa eastward to central Indiana and southwestern Michigan, plus portions of southwestern Ohio, southern Indiana and adjacent Kentucky, sections of northern and eastern Michigan, and northeastern Minnesota. The last 30 days brought only 0.5 to 2.0 inches of rain to the broad strip from central Iowa through western Indiana, in addition to east-central Michigan and the eastern half of the Upper Peninsula.
High Plains
Several inches of rain doused a broad area from eastern Kansas northwestward through South Dakota, western North Dakota, and the northern High Plains. Dryness and drought were confined to central and southern Kansas, east-central Nebraska, and northern North Dakota, where a small area of severe drought was introduced. In contrast to areas farther north, central and south-central Kansas recorded only 0.5 to locally 2.0 inches of rain since mid-July.
West
Periodic light to moderate rain has fallen for a few weeks now from central and southern Washington eastward through southwestern Montana, prompting improvement in some former D0 to D1 regions there, and in adjacent Oregon. Farther south, abnormal dryness persisted in several areas from southwestern Wyoming through Utah and western Colorado; D0 expanded northward a bit into areas north of the Four Corners near the Colorado/Utah border. Across the southern Rockies and southwestern deserts, deficient monsoon rains continued, and increasing moisture deficits prompted a broad expansion of abnormal dryness from southeasternmost California through eastern Arizona, and farther south from southeastern Arizona across southern New Mexico.
Alaska, Hawaii, and Puerto Rico
Heavy precipitation and cooler temperatures brought continued relief to much of Alaska. Abnormal dryness remained in the Yukon Flats, but all other dry areas across the interior were removed. In contrast, beneficial precipitation evaded much of southern Alaska for the second consecutive week. And abnormal dryness or drought still covers areas from interior southwestern Alaska through the southeastern Panhandle. South-central Alaska has been particularly parched recently. The last 3 months brought record to near-record low rainfall totals to part of the region, thus severe drought (D2) was introduced there.
A fairly typical summer week of scattered rainfall affected Puerto Rico. Dryness and drought essentially persisted, except for areas that missed much of the rain over the last few weeks. D2 was expanded eastward in south-central Puerto Rico, and the eastern D0 boundary was pushed eastward in eastern parts of the Commonwealth.
An unremarkable week of typical summer weather was also observed across Hawaii, leaving areas of dryness and drought unchanged.
Pacific Islands
The weather pattern during this USDM week (8/7/19-8/13/19) began with Tropical Storm Krosa bringing rain to the Marianas. The tropical storm strengthened to Typhoon Krosa but moved little in the following days; Krosa had moved out of the area by the end of the week. A monsoon trough extended through Krosa, across the Marianas, and into the central Federated States of Micronesia (FSM) for much of the week. A high pressure ridge to the south of Krosa dominated the weather all week over far western Micronesia (Palau and western Yap State). The Marshall Islands (RMI) and the eastern to central FSM were influenced, at various times, by surface troughs, trade-wind disturbances, trade-wind convergence, weak circulations, and upper-level divergence. The weather over American Samoa was dominated by a strong mid-level ridge.
Satellite-based estimates of 7-day precipitation (QPE) showed 4-10 inches of rain, and more, northwest of the Marianas associated with Krosa. Parts of central and especially northern Marianas were covered by the edge of this region, with 2-6 inches of rain indicated. Areas of 2-4 inches of rain extended in a band from the Marianas southeastward to the eastern FSM and parts of the RMI. Areas of 1-2 inches of rain extended east of this band over the rest of the RMI and to the west into Yap State. Little to no rain was indicated on the QPE over western Yap State to Palau. South of the equator, areas of 1+ inches of rain were indicated northwest of the Samoan Islands, but the QPE showed little to no rain over American Samoa.
Rainfall totals in the Marianas associated with Tropical Storm Krosa were highest on Saipan where 2.38 inches of rain was recorded this week. Rota saw 1.18 inches and Guam recorded 0.39 inch. Rainfall totals for the month of August are now over 11 inches for all three islands which is nearly three times the 4-inch monthly minimum needed to meet most water needs. Drought-free conditions remain on each island.
The Palau International Airport recorded only 0.25 inch of rain this week. However, this is the first dry week in a month and June (16.30 inches) and July (15.04 inches) were wet with rainfall each month nearly double the 8-inch monthly minimum needed to meet most water needs. Palau remains drought-free.
Despite it being a dry week for the western and central parts of the Federated States of Micronesia, the entire nation remained free of drought since July precipitation totals across the area were all above the 8-inch minimum, ranging from 10 to 19 inches. Yap (no rain), Woleai (0.57 inch), Chuuk Lagoon (0.56 inch; one day missing), and Lukunor (0.31 inch; one day missing) saw less than half the 2-inch weekly minimum needed to meet most water needs, while Kapingamarangi (1.16 inches) and Nukuoro (1.70 inches) were just below the 2-inch weekly threshold. Fananu (2.47 inches; two days missing), Pohnpei (2.98 inches; one day missing), Pingelap (7.88 inches; one day missing), and Kosrae (2.39 inches; one day missing) saw ample rainfall.
Jaluit was the driest of the Marshall Islands this week. Only 0.40 inch of rain was recorded this week which follows the driest July and June-July on record, and brings the August precipitation total to only 1.77 inches. Severe drought (D2-SL) remains for the island. Kwajalein saw rain every day this week which summed to 4.16 inches. Since this follows the 2.34 inches of rain last week, Kwajalein improved one category to moderate drought (D1-L). Ailinglapalap recorded 4.39 inches of rain this week which brings the rainfall total for the last three weeks to 10.44 inches. Abnormal dryness was removed from Ailinglapalap leaving D-nothing. Despite seeing a wet week, Majuro (3.99 inches) remains abnormally dry (D0-S) due to previously dry conditions and reservoir levels sitting around 28 million gallons, which is just below the critical 80% of capacity level. Wotje also met the 2-inch weekly threshold with 2.41 inches but remains in moderate drought (D1-SL) this week since it was improved one category last week. Utirik (2.43 inches) remains in severe drought (D2-SL). Mili saw 3.73 inches of rain this week and remains free of drought.
Dry conditions were found in American Samoa this week with Pago Pago reporting only 0.18 inch of rain. Other stations on the island reported closer to 0.40 inch. July, however, was wet with 17.54 inches of rain at Pago Pago, 11.70 inches for Siufaga Ridge, and 8.82 inches for Toa Ridge, so there are no concerns of dryness or drought at this time.
Virgin Islands
An upper-level high pressure system was present at the beginning of the USDM week on Aug. 7, leaving the USVI mostly dry. A weak surface trough moved into the area overnight on Aug. 7 followed by a tropical wave late on Aug. 8 and into Aug. 9, both of which increased moisture, instability, and shower activity. A drier air mass took over briefly on Aug. 11 before another tropical wave passed through the region on Aug. 12, again causing an increase in shower activity. Weather stations throughout the USVI picked up anywhere between 0.08 and 1.00 inch of rain over the course of the week.
On St. Croix, Rohlsen Airport saw 0.08 inch of rain this week. With the rain last week, the August total is already at 1.79 inches or 174% of the normal to date. The year-to-date total of 14.54 inches is 83% of normal. Christiansted Fort saw 0.94 inch of rain this week and sits at 194% of normal for August to date and 80% of normal for the year to date. SPI values for St. Croix on the one-, three-, and six-month scales (ranging from -0.38 to 1.62) indicate drought-free conditions, while values indicate abnormally dry (D0) conditions on the nine-month scale (-0.62), and moderate drought (D1) conditions on the 12-month scale (-0.96). With the continued rain showers this week and improvement in 9-month SPI, St. Croix was improved one category to abnormal dryness (D0-L), with the “L” denoting drier conditions on long-term scales.
St. Thomas’s King Airport recorded 0.28 inch of rain this week. This brings the August rainfall total to 1.64 inches or 141% of normal to date. This follows the wettest July on record. The year-to-date precipitation total amounts to 18.28 inches or 103% of normal. SPI values on one-, three-, six-, nine-, and 12-month time scales ranged between 2.1 and -0.49, all of which indicate drought-free conditions. St. Thomas was improved one category to abnormal dryness (D0-L) with lingering impacts from drier conditions on longer-term scales.
East End ended up with 3.72 inches of rain in July, or 122% of normal. The July rainfall brought the year-to-date total to 14.16 inches which is 83% of normal. A volunteer observer at Windswept Beach recorded 3.62 inches of precipitation in July, which was 106% of the long-term July average for that location. At the end of July, the year-to-date rainfall total of 15.50 inches was 76% of the long-term average. With 1 inch of rain this week, Windswept Beach has seen 1.98 inches of rain so far in August. This puts August 2019 on pace to finish close to the August long-term average of 4.65 inches. At the end of July, SPI values at East End indicated drought-free conditions on the one-, three- and 12-month scales (-0.2, -0.09, and -0.27, respectively), abnormal dryness (D0) on the six-month scale (-0.66), and moderate drought (D1) on the nine-month scale (-1.21). Windswept Beach SPI values from July indicate drought-free conditions on the three-, nine-, 12-month scales (0.02, -0.23 and -0.45), abnormally dry conditions (D0) on the one-month scale (-0.62), and moderate drought (D1) conditions on the six-month scale (-0.96) St. John was improved one category to abnormal dryness (D0-L) with the improved short-term SPI values and continued precipitation.
Looking Ahead
During the next 5 days (August 15 – 20, 2019) should bring heavy rains of at least 1.5 inches across the central Great Plains and much of the Midwest, with 3 to 5 inches forecast from northwestern Missouri and adjacent areas northward through central and eastern Iowa. Amounts exceeding 1.5 inches are also forecast for the Mississippi Delta and along the immediate Gulf and southern Atlantic Coasts. A few patches along the Atlantic Coast from southeastern Georgia through North Carolina should receive 3 to 4 inches. Moderate rains of 0.5 inch or more are anticipated in parts of upstate New York, northern New England, and inland areas near the central Gulf and southern Atlantic Coasts. Similar amounts are expected in most of the western Great Lakes, Midwest, Great Plains from Kansas into the central Dakotas, and upper Mississippi Valley. A few tenths of an inch should fall on the middle Atlantic region, the rest of the central and northern Great Plains and Mississippi Valley, and parts of central and northern Texas and adjacent Oklahoma. Little or no rain is expected in the rest of the 48 contiguous states, including the interior Southeast, the Ohio Valley, southern Texas, and most areas from the Rockies westward. Daytime high temperatures should average 3°F to 6°F below normal in the northern one-third of the Plains, and near 3°F below normal in north-central Florida. In contrast, daily highs are forecast to average around 3°F above normal in the middle Atlantic region, and 3°F to locally 9°F above normal from the southern half of the Great Plains westward through most of the Rockies, the Intermountain West, the Great Basin, and California away from the immediate coast.
The CPC 6-10 day outlook (August 21 -25, 2019) favors above-normal precipitation in the Alaskan Panhandle, parts of the Pacific Northwest, the northern Great Plains, the Mississippi Valley, southeast Texas, the Ohio Valley, the Southeast, and the middle Atlantic region. Meanwhile, enhanced chances for subnormal precipitation cover most of Alaska, although no tilt of the odds in either direction is indicated from the Kenai Peninsula westward through the Borough of Dillingham. Below normal precipitation chances are also elevated in upstate New York, most of New England, the central and southern Great Plains from central Texas through southwestern South Dakota, most of the High Plains, and the central Rockies. Neither precipitation extreme is favored elsewhere. Above-normal temperatures are favored across most of the country, with elevated chances for subnormal temperatures restricted to northwestern Montana, most of central and eastern Alaska, and the northern Alaska Peninsula. Neither positive nor negative temperature anomalies are favored in parts of the northern Rockies and in the lower Mississippi Valley.
Some may find this way of looking at things useful and I hope these graphics are not too small to read. I did not make them so you could click on them individually but you can click on the whole graphic and it may enlarge. But I think you get the picture. It has been a rapid onset and demise. When you read these graphics, remember that the older graphics are not the drought conditions that existed then but the change from then until now.

Drought Forecasts
First, we show the forecast through November which was issued on August 15, 2019 (to be updated on September 19, 2019). These two forecasts are issued by the same agency but to obtain them you need to access two different links here and here.
Here is the Three-Month Forecast which was issued on August 15, 2019

Here is the discussion
Latest Seasonal Assessment – El Niño has transitioned to ENSO-neutral, and ENSO-neutral conditions are most likely to continue through the Northern Hemisphere winter 2019-20 (50-55% chance). Drought coverage remains very low across the contiguous U.S. (CONUS). Across the West, as the summer monsoon season winds down in September, the West Coast rainy season will gradually ramp up. Drought currently in place across portions of the Northwest and western parts of New Mexico are favored to persist during the Sep-Oct-Nov (SON) 2019 season, mainly because significant, longer-term precipitation deficits are considered unlikely to be overcome. Over the Midwest, small areas of moderate drought (D1) were recently introduced to the U.S. Drought Monitor map, but these areas are expected to be removed during the SON season. In fact, heavy rainfall predicted during the next 1-2 weeks may be enough to wipe out budding drought in Iowa and northwestern Illinois. CPC’s monthly and seasonal precipitation outlooks, valid for September and SON respectively, favor above normal precipitation for North Dakota, supporting drought removal there. Across the southern Great Plains, high temperatures and reduced precipitation have resulted in drought expansion. Drought development is also possible across southern Texas. In the Southeast, short-term rainfall may be enough to result in the improvement and/or removal of localized pockets of drought currently in place. The exception is southeastern North Carolina and adjacent parts of South Carolina, where 6-8 inch rainfall deficits have mounted over the past 3 months. In the eastern Interior of Alaska, moderate drought was removed from the U.S. Drought Monitor depiction this week. Autumnal westerlies are climatologically favored to strengthen and shift southward towards the southern coast of Alaska, helping to focus storm tracks and their associated precipitation patterns. This supports at least a one-category improvement in drought conditions across southern Alaska in SON. Farther south over the Central Pacific, the low-latitude trade winds are expected to strengthen now that the El Niño has ended, and result in increased rainfall across the Hawaiian Islands, especially windward areas. A seasonal increase in mid-latitude storm activity may also bring needed rainfall to the drier leeward slopes. For Puerto Rico, various dynamical model precipitation forecasts are at odds with the expected uptick in Atlantic hurricane activity for the SON season. With these conflicting indications, and in the absence of strong climate signals for either increased dryness or wetness, it is thought that drought persistence is most likely for the southern portion of Puerto Rico.
It does not look too bad.
Here is the Monthly Drought Outlook which was updated on July 31, 2019

Floods remain a concern but only in a limited area.

| Last Week | Current Week |
|
|

Let’s see if this animation works.

But the impact of earlier precipitation has resulted in

The last sentence is the key.
Lake Levels have been high for much of the summer but are projected to have a net decease by next month.
Active Major Fires

The situation in Alaska has improved dramatically.

Looking out another month.


Crop Progress
Last week we looked at the individual crop progress reports graphically from this source. Next week or so we will review this Executive Summary Report which provides projections of the ultimate harvest.
But for now, we will look at the season to date information summary.

| Crop | Crop Progress | Crop Condition |
| Corn | Very Slow (Silking, Dough and Denting) | Very Bad |
| Soybeans | Very Slow (Blooming and Setting Pods) | Very Bad |
| Winter Wheat | Slightly Slow (Harvested) | Very Good |
| Spring Wheat | Very Slow (Harvested) | OK |
| Cotton | OK (Setting Bolls) Good (Opening) | Very Good |
| Sorghum | Very Slow Headed and Very Slow (Coloring) Ok (Mature) | Very Good) |
| Rice | Very Slow (Headed) Slow (Harvested) | OK |
| Oats | Very Slow (Harvested) | Bad |
| Barley | Very Slow (Harvested) | Slightly Bad |
| Peanuts | Ok(Pegging) | Slightly Bad |
| Sugar Beets | Slow (Planted) but caught up. | NA |
| Sunflowers | Slow (Planted) but caught up. | NA |
The following table summarizes the situation. It has changed a bit since last week.
| Crop development not Late | OK | Crop Development Late | |
| Crop Condition Good | Cotton | Winter Wheat Sorghum | |
| Crop Condition OK | Spring Wheat Rice | ||
| Crop Condition Bad | Peanuts | Corn Soybeans Oats Barley |
This provides some additional infomation:

There are many factors that have led to the current situation but one is the amount of sunshine other causes of temperture and it has been inadequate.

Side by Side
|
|
And soil moisture has become a major issue. The situation has changed dramatically since the last time we reported it and we were not watching it carefully enough.
Only six states have a topsoil moisture surplus and six also have a subsoil surplus. So too much moisture is not much of a problem now. Lack of moisture is not a problem for 37 states relative to the topsoil and 31 states relative to deeper soil.


Pan Evaporation (named for the container used to do the measurement – Class A evaporation pan)

International

A map helps and is not always available and fortunately, it was available this week.

Major Sources of Information
In the box are shown the major resources we use. We will not be using them all each week but the reader is welcome to refer to these resources.
Major Sources of Information Used in this Weekly Report
|
Background Information


The sequence of drought occurrence and impacts for commonly accepted drought types. All droughts originate from a deficiency of precipitation or meteorological drought but other types of drought and impacts cascade from this deficiency. (Source: NDMC)
Source: National Drought Mitigation Center, University of Nebraska-Lincoln


