Written by Sig Silber
We have a new forecast for August and a companion Drought Forecast for August and we will review these as there are some concerns. Tonight we take a detailed look at the history of this crop year with some very interesting graphics. As usual, there is a report on the U.S. Drought Monitor which establishes the current situation and we include the comparison of last week to this week.

Please share this article – Go to the very top of the page, right-hand side, for social media buttons. Please feel free to send this article to anyone who you think might benefit from reading it.
New Format: Each week our Thursday night article will cover the Drought Monitor Report issued by NOAA in conjunction with the University of Nebraska – Lincoln and a summary of U.S. crop conditions. It provides a link to the Severe Weather Report (this will take two clicks since that report gets republished each day and so you click here to get to the Directory and then click again on the version of the Severe Weather Report closest to the top of the list. Soon we will have a link to a full weather report, not just severe weather. Each week, this article will have a different special feature. We have not worked that out yet but most likely those features might be: A. a more detailed look at the prior month’s crop progress (this week’s special feature) B. a review of the prior month’s weather C. a review of the prior month’s International Weather D. Current conditions of rivers and reservoirs. E. Economic Impacts other than crop-related F. Other. The goal is to reduce the time needed to read the article and provide information each week that changes each week and provide information that changes more slowly on a monthly basis. Please provide feedback by completing the survey below on how you feel about the new format and what would make this article more useful to you. |
This is a little bit of a destraction but NRCS thought it appropriate to show it so I am.

Crop Conditions
I moved this up to be early in the report this week.

| Crop | Crop Progress | Crop Condition |
| Corn | Very Slow (Silking and Dough) | Very Bad |
| Soybeans | Very Slow (Blooming and Setting Pods) | Very Bad |
| Winter Wheat | Slow (Harvested) | Very Good |
| Spring Wheat | OK (Headed) | Slightly Bad |
| Cotton | Ok Squaring but a bit Slow Setting Bolls | Very Good |
| Sorghum | Very Slow Headed and Slighly Slow Coloring) | Very Good) |
| Rice | Very Slow (Headed) | OK |
| Oats | Slightly Slow (Headed) Very Slow (Harvested) | Slightly Bad |
| Barley | Ok (Headed) | Slightly Bad |
| Peanuts | Ok(Pegging) | Slightly Bad |
| Sugar Beets | Slow (Planted) but caught up. | |
| Sunflowers | Slow (Planted) but caught up. | NA |
The following table summarizes the situation. It has changed a bit since last week.Cotton
| Crop development not Late | OK | Crop Development Late | |
| Crop Condition Good | Cotton | Winter Wheat Sorghum | |
| Crop Condition OK | Peanuts | ||
| Crop Condition Bad | Spring Wheat Barley | Rice Oats Corn Soybeans |
But the above is somewhat of a static analyis. Where things stand this week. Now we will take a look at how things have evolved this crop season and how this crop season compares to recent crop seasons.
Crop Progress
In a week or so we will review this report which provides projections of the ultimate harvest. But for now we will look at the season to date information graphically.


Looking that the insolattion measured as Growing Degree Days.

Side by Side
|
|

Here we look at the temperature and precipitation forecast for August to see if the out-of-balance situation above is likely to be improved.
| July 31, 2019 Forecast for August | |
| Temperature |
|
| Precipitation |
|


Current Drought Conditions
Now we take a look at Thursday’s U.S. Drought Monitor Report.
The U.S. Drought Monitor is a comprehensive way of understanding the drought situation for the U.S. It is issued every Thursday and reflects the conditions as of the prior Tuesday. Drought is defined as a moisture deficit bad enough to have social, environmental or economic effects. Thus, more factors than recent precipitation are considered and more information on how it is done is found at the end of this report.

U.S. Affiliated Pacific Islands and the U.S. Virgin Islands.

Below is the map for just CONUS.
 |
 |
| Last Week | This Week |
| |

Some might find this animation of twelve weeks of change useful;

The graphic below shows the one-week change in drought intensity. Yellow is bad. Green is good.
|

Now we show the week to week change information by region. The yellow is where the drought has been upgraded. The green is where the level of drought has been downgraded.
 |
I see five states with deterioration |
 |
| Again widespread deterioration. |
 |
| No Change |
 |
| Deterioration in Texas and Oklahoma. |
 |
| Mostly deterioration but improvement in North Carolina and some parts of coastal Georgial and Northern Florida. |
 |
Deterioration in NE Utah, SW Wyoming, and NW Colorado. |
Here is the Discussion that was issued with the Drought Report.
This Week’s Drought Summary
The far western United States was dry this week while monsoonal thunderstorms were scattered about parts of Arizona, Utah, Colorado, and New Mexico. Widespread precipitation fell from northeast Colorado to southwest South Dakota to northeast Minnesota, and in Missouri and southwest Iowa. Widespread rainfall took place in Florida, southeast Georgia, and North Carolina and Virginia. Meanwhile, dry weather encompassed much of Alabama, Kentucky, Ohio, and the central and southern Great Plains. Generally, below-normal temperatures occurred from the southern Plains to the mid-South to the Southeast, while warmer than normal temperatures were common in the Southwest, particularly in California, Arizona, and New Mexico.
Northeast
Near normal to slightly warmer than normal temperatures occurred in the Northeast during the last week of July. While precipitation was somewhat sparse this week, recent precipitation the week before was sufficient to keep any abnormal dryness or drought development at bay, and the Northeast remained free of both.
Southeast
Widespread moderate to heavy rainfall occurred in southeast Georgia, Florida, North Carolina, and parts of South Carolina this week. Meanwhile, conditions were quite dry in Alabama. Temperatures across the region were generally 2 to 6 degrees cooler than normal. Areas of abnormal dryness expanded in Alabama where short-term precipitation deficits and low streamflow continued, moderate drought in south-central Alabama expanded northward due to short-term precipitation deficits and low streamflow, and moderate drought was also introduced in northeast Alabama due to deteriorating soil moisture and short-term precipitation deficits. Short-term precipitation shortages and deteriorating soil moisture conditions also led to the introduction and expansion of moderate drought in eastern Georgia and southeast South Carolina, and in east-central South Carolina, where some agricultural impacts were also being reported. In areas of northeast Florida, southeast Georgia, and northern North Carolina that received heavier rainfall, abnormal dryness ceased.
South
With the exception of the northwest Texas Panhandle and southwest Texas, below-normal temperatures occurred during the last week of July across the South, particularly in Arkansas, Oklahoma, Louisiana, and eastern and central Texas. Widespread moderate to heavy precipitation fell across the southern half of Louisiana and northwest Mississippi. Meanwhile, Texas and Oklahoma were quite dry again, continuing a recent drying trend here. In response to the dry weather and growing short-term precipitation deficits and associated surface water and soil moisture concerns, widespread degradations occurred in Texas and Oklahoma. Moderate drought was introduced from the southern Texas Panhandle into southwest Oklahoma and in west Texas. Short-term moderate drought expanded northward through parts of southern Texas. In response to recent rainfall, a small area of severe drought was reduced in southern Texas. Elsewhere across the South, no changes were made in this week’s map.
Midwest
Widespread rainfall occurred in Minnesota, Wisconsin, southwest Iowa, and Missouri, while rain coverage was more spotty elsewhere in the region. Temperatures varied from below normal in the southern and western parts of the region, across Kentucky, Missouri, and western Iowa, to above normal in Michigan, Wisconsin, and surrounding areas. The region remained free of drought, though several areas of abnormal dryness grew in coverage in response to short-term precipitation deficits and reported agricultural impacts. These increases in abnormal dryness occurred in Indiana, Illinois, Iowa, and the Michigan Upper Peninsula.
High Plains
During the past week, rain fell in a band roughly from northeast Colorado through the Nebraska Panhandle and across central and southeast South Dakota. Otherwise, dry weather prevailed in the High Plains during the last week of July. Temperatures were warmer than normal in the Colorado high plains, southeast Wyoming, and northeast North Dakota, while cooler than normal temperatures occurred in southwest North Dakota, western South Dakota, eastern Nebraska, and southeast and south-central Kansas. Warmer than normal temperatures in northern North Dakota were putting stress on soil moisture conditions, resulting in a slight expansion of short-term moderate drought to the southeast. Otherwise, the region remained free of drought. Abnormal dryness developed in parts of central Kansas and northeast Nebraska, where short-term precipitation deficits were developing.
West
During the last week of July, above-normal temperatures were widespread in California, Arizona, New Mexico, and parts of Colorado. Below-normal temperatures occurred in eastern Montana and eastern Washington. Precipitation was widespread in New Mexico, but was generally spotty or nonexistent elsewhere. No changes were made to the ongoing drought areas across the West, though an area of abnormal dryness was introduced in northwest Colorado, southwest Wyoming, and far northeast Utah, where short-term precipitation deficits combined with above-normal evaporative demand over the past few months.
Alaska, Hawaii, and Puerto Rico
Drier than normal weather occurred during July in Alaska, and no changes were made to the drought depiction there. Primarily, improvements were made in northern and eastern parts of Puerto Rico, which received widespread rainfall this week. Severe and moderate drought conditions continued in south-central and southwest Puerto Rico. No changes were made this week in Hawaii.
Pacific Islands
The weather pattern during this USDM week (7/24/19-7/30/19) consisted of an interaction between upper-level troughs and surface troughs; weak circulations over Palau, the FSM, and the Marianas; a monsoon flow over western to central Micronesia; and trade-wind convergence or disturbances over eastern Micronesia. South of the equator, a moist active surface trough dominated the weather over American Samoa for much of the week, with drier high pressure moving over the area near the end of the week.
Satellite-based estimates of 7-day precipitation (QPE) showed a widespread area of 2+ inches of rain, with embedded areas of 4+ inches, over Palau, the Marianas, and the western and southern sections of the Federated States of Micronesia (FSM). There were areas within this region that had less than an inch. A band of 2+ inches of rain was indicated across the Marshall Islands (RMI), but most of the RMI and eastern FSM had less than 2 inches. The satellite QPE imagery showed the western Micronesia rain area joined to a band stretching into southern Asia as part of a monsoon trough, and extending southeast across the equator manifesting the South Pacific Convergence Zone (SPCZ). In the vicinity of the Samoan Islands, the SPCZ took the form of a large area of 2+ inches of rain, with 4+ inches indicated across American Samoa.
It was a wet week (more than the 2-inch weekly minimum needed to meet most water needs) in the Republic of Palau. The Palau International Airport recorded 3.83 inches of rain this week, bringing the July total to 15.04 inches. With June and July wet (more than the 8-inch monthly minimum), D-Nothing continued at Palau.
With the last 3 weeks wet (more than the 1-inch weekly minimum needed to meet most water needs), a shift to a wet pattern has occurred in the Marianas. Rainfall totals this week included 2.68 inches at Rota, 2.49 inches at Saipan, and 1.66 inches at Guam. The Saipan automated gauges recorded 2.39 inches (ASOS) and 2.21 inches (NPS). Rota had 10.54 inches of rain for the month so far (through July 30), and Saipan 6.45 inches, and the vegetation has greened up in recent weeks. Based on historical percentiles, July 2019 and May-July 2019 ranked near the 33rd percentile for Saipan, and July 2019 ranked near the median for Rota, and these are wetter than the percentiles for drought according to the USDM. Guam had 4.57 inches of rain so far in July, but other stations on the island were wetter, including Dededo with 7.68 inches, Nimitz Hill (9.34 inches), Merizo Treatment Plant (10.86 inches), and Agat (11.13 inches). As a result, the USDM status at Guam, Rota, and Saipan was improved to D-Nothing.
It was a wet (more than the 2-inch weekly minimum needed to meet most water needs) week across much of the FSM. Fananu reported 1.88 inches of rain, Pingelap 0.80 inch, and Woleai (which was missing one day of data) 0.22 inch. But for the other stations, weekly totals ranged from 2.68 inches at Yap and 2.70 inches at Kosrae to 5.96 inches at Pohnpei and 10.21 inches at Lukonor. Ulithi was missing. D0-S continued at Fananu, but D-Nothing continued at the rest of the FSM stations.
In the RMI, Ailinglapalap and Majuro were wet this week with 4.90 inches and 3.72 inches of rain, respectively. The rest of the stations were dry (less than the 2-inch weekly minimum needed to meet most water needs). The reservoir storage at Majuro changed little during the week and was 25.3 million gallons on July 30, which is 70% of maximum and below the 80% threshold for concern. With 6.52 inches of rain so far this month, July 2019 ranked as the 3rd driest July in 66 years of data at Majuro, with June-July 2019 at 12th driest. As a result, D1-S continued at Majuro. At Ailinglapalap, the week was wet but the month was still dry (6.50 inches), so D0-S continued. This week was dry at Mili, but last week was wet, so D-Nothing continued. At Utirik, the week was dry (0.78 inch), the last several weeks were dry, and the month so far has been dry (3.58 inches), but rain has been falling roughly every other day. July 2019 ranked as the 4th driest July in 16 years of record, which is at the 25th percentile, and June-July ranked 4th driest in 12 years of data. Considering the frequency of rain, and the ranks which are not record dry, the status at Utirik was improved from D4-SL to D3-SL. For Wotje, July 2019 ranked as the 13th driest July in 35 years, or at the 37th percentile, and June-July 2019 ranked as the 9th driest in 35 years, or at the 26th percentile. Both of these ranks justified improvement to D2-SL; this was a readjustment or reassessment, since the weekly rainfall total of 0.25 inch was below the weekly minimum and the monthly total of 4.07 inches was below the monthly minimum. Jaluit recorded 0.96 inch of rain for the week and only 2.43 inches for July so far; July 2019 and June-July 2019 ranked as the driest July and June-July in the 36-year record, and 10 of the last 11 months were dry, so the status at Jaluit was worsened from D1-S to D2-SL. At Kwajalein, the last 5 weeks have been dry, July so far is dry (3.96 inches), and July 2019 and June-July 2019 rank as the 2nd driest July and June-July in 68 years of data; and 7 of the last 8 months have been dry; so the status at Kwajalein was worsened from D1-S to D2-SL. With the previous week wet, D-Nothing continued at Mili.
It was another wet week in American Samoa. The airport station at Pago Pago reported 6.37 inches of rain for the week, and the automated stations at Siufaga Ridge and Toa Ridge recorded 6.11 inches and 4.20 inches, respectively. All 3 stations were well above the 8-inch monthly minimum for July – 17.53 inches for Pago Pago, 11.70 inches for Siufaga Ridge, and 8.82 inches for Toa Ridge – so D-Nothing continued for Tutuila.
Virgin Islands
During this USDM week (7/24/19-7/30/19), a dry air mass laden with Saharan dust kept the weather over the U.S. Virgin Islands (USVI) dry at the beginning of the week. A tropical wave moved through, bringing areas of rain on the 25th. This tropical wave was followed by a drier-than-normal air mass with suspended Saharan dust, which was followed by another tropical wave at the end of the week. The second wave was a vigorous rain-producer, prompting flash flood watches across Puerto Rico and the USVI and generating over 3 inches of rain over portions of eastern Puerto Rico in the 24 hours ending at 12Z Tuesday morning. Radar estimates of 7-day rainfall totals indicated 2 or more inches fell over parts of St. Thomas and St. Croix, and 0.5-1.5 inches fell over parts of St. John, with the heaviest rain indicated to the north and west of the USVI.
On St. Croix, the CoCoRaHS volunteer station at Christiansted 1.8 ESE reported 2.32 inches of rain for the week, while the Henry Rohlsen AP station reported a weekly total of 3.13 inches. This brought the airport station’s monthly total to 4.49 inches, which was about 150% of normal. But the station is still 4.30 inches below normal for the year to date, which equates to about 75% of normal. The Standardized Precipitation Index (SPI) values computed by NDMC showed no drought at the 1- to 6-month time scales, but still drought at the 9- to 12-month time scales. The status was improved to D1-L to reflect the July precipitation but lingering long-term dryness.
On St. Thomas, the CoCoRaHS volunteer station at Anna’s Retreat 2.5 ESE reported 0.74 inch of rain for the week, while the Cyril E King AP station reported a weekly total of 1.40 inches. This brought the monthly total at the airport station to 2.87 inches, which is about normal for July, but the year-to-date total was still 4.50 inches below normal, or about 72% of normal. The SPI values for King AP show neutral conditions for the last 30 days, but still at drought for the last 3 to 12 months, so D2-SL continued.
A volunteer observer at Windswept Beach on St. John reported 0.91 inch of rain this week (through July 29) and 1.93 inches for July so far. Official normals for this volunteer location don’t exist, but long-term averages have been computed. The July total is about 57% of the long-term average, and the year-to-date total is about 6.70 inches below the long-term average, or about 67% of average. The July SPI (computed by NDMC) was -0.62 and the 6-month SPI was -0.95. Monthly precipitation deficits extend back to December, or the last 8 months, so D1-S was changed to D1-SL for St. John.
Looking Ahead
Temperatures will be variable across much of the country next week, but generally, expect warmer than normal temperatures in the Intermountain West, near to below normal temperatures in the south-central United States, and variable conditions elsewhere. Over the next week, the NWS forecast calls for scattered rain to continue over Colorado, Utah, Arizona, and New Mexico, and for heavier rain from eastern Nebraska southward to Louisiana. Rain is also forecast for much of the Southeast and Mid-Atlantic region.
Some may find this way of looking at things useful and I hope these graphics are not too small to read. I did not make them so you could click on them individually but you can click on the whole graphic and it may enlarge. But I think you get the picture. It has been a rapid onset and demise. When you read these graphics, remember that the older graphics are not the drought conditions that existed then but the change from then until now.

Drought Forecasts
First we show the forecast for the current month August which was updated on July 31, 2019 and then the forecast through October which was issued on July 18 (to be updated on August 15). These two forecasts are issued by the same agency but to obtain them you need to access two different links here and here.
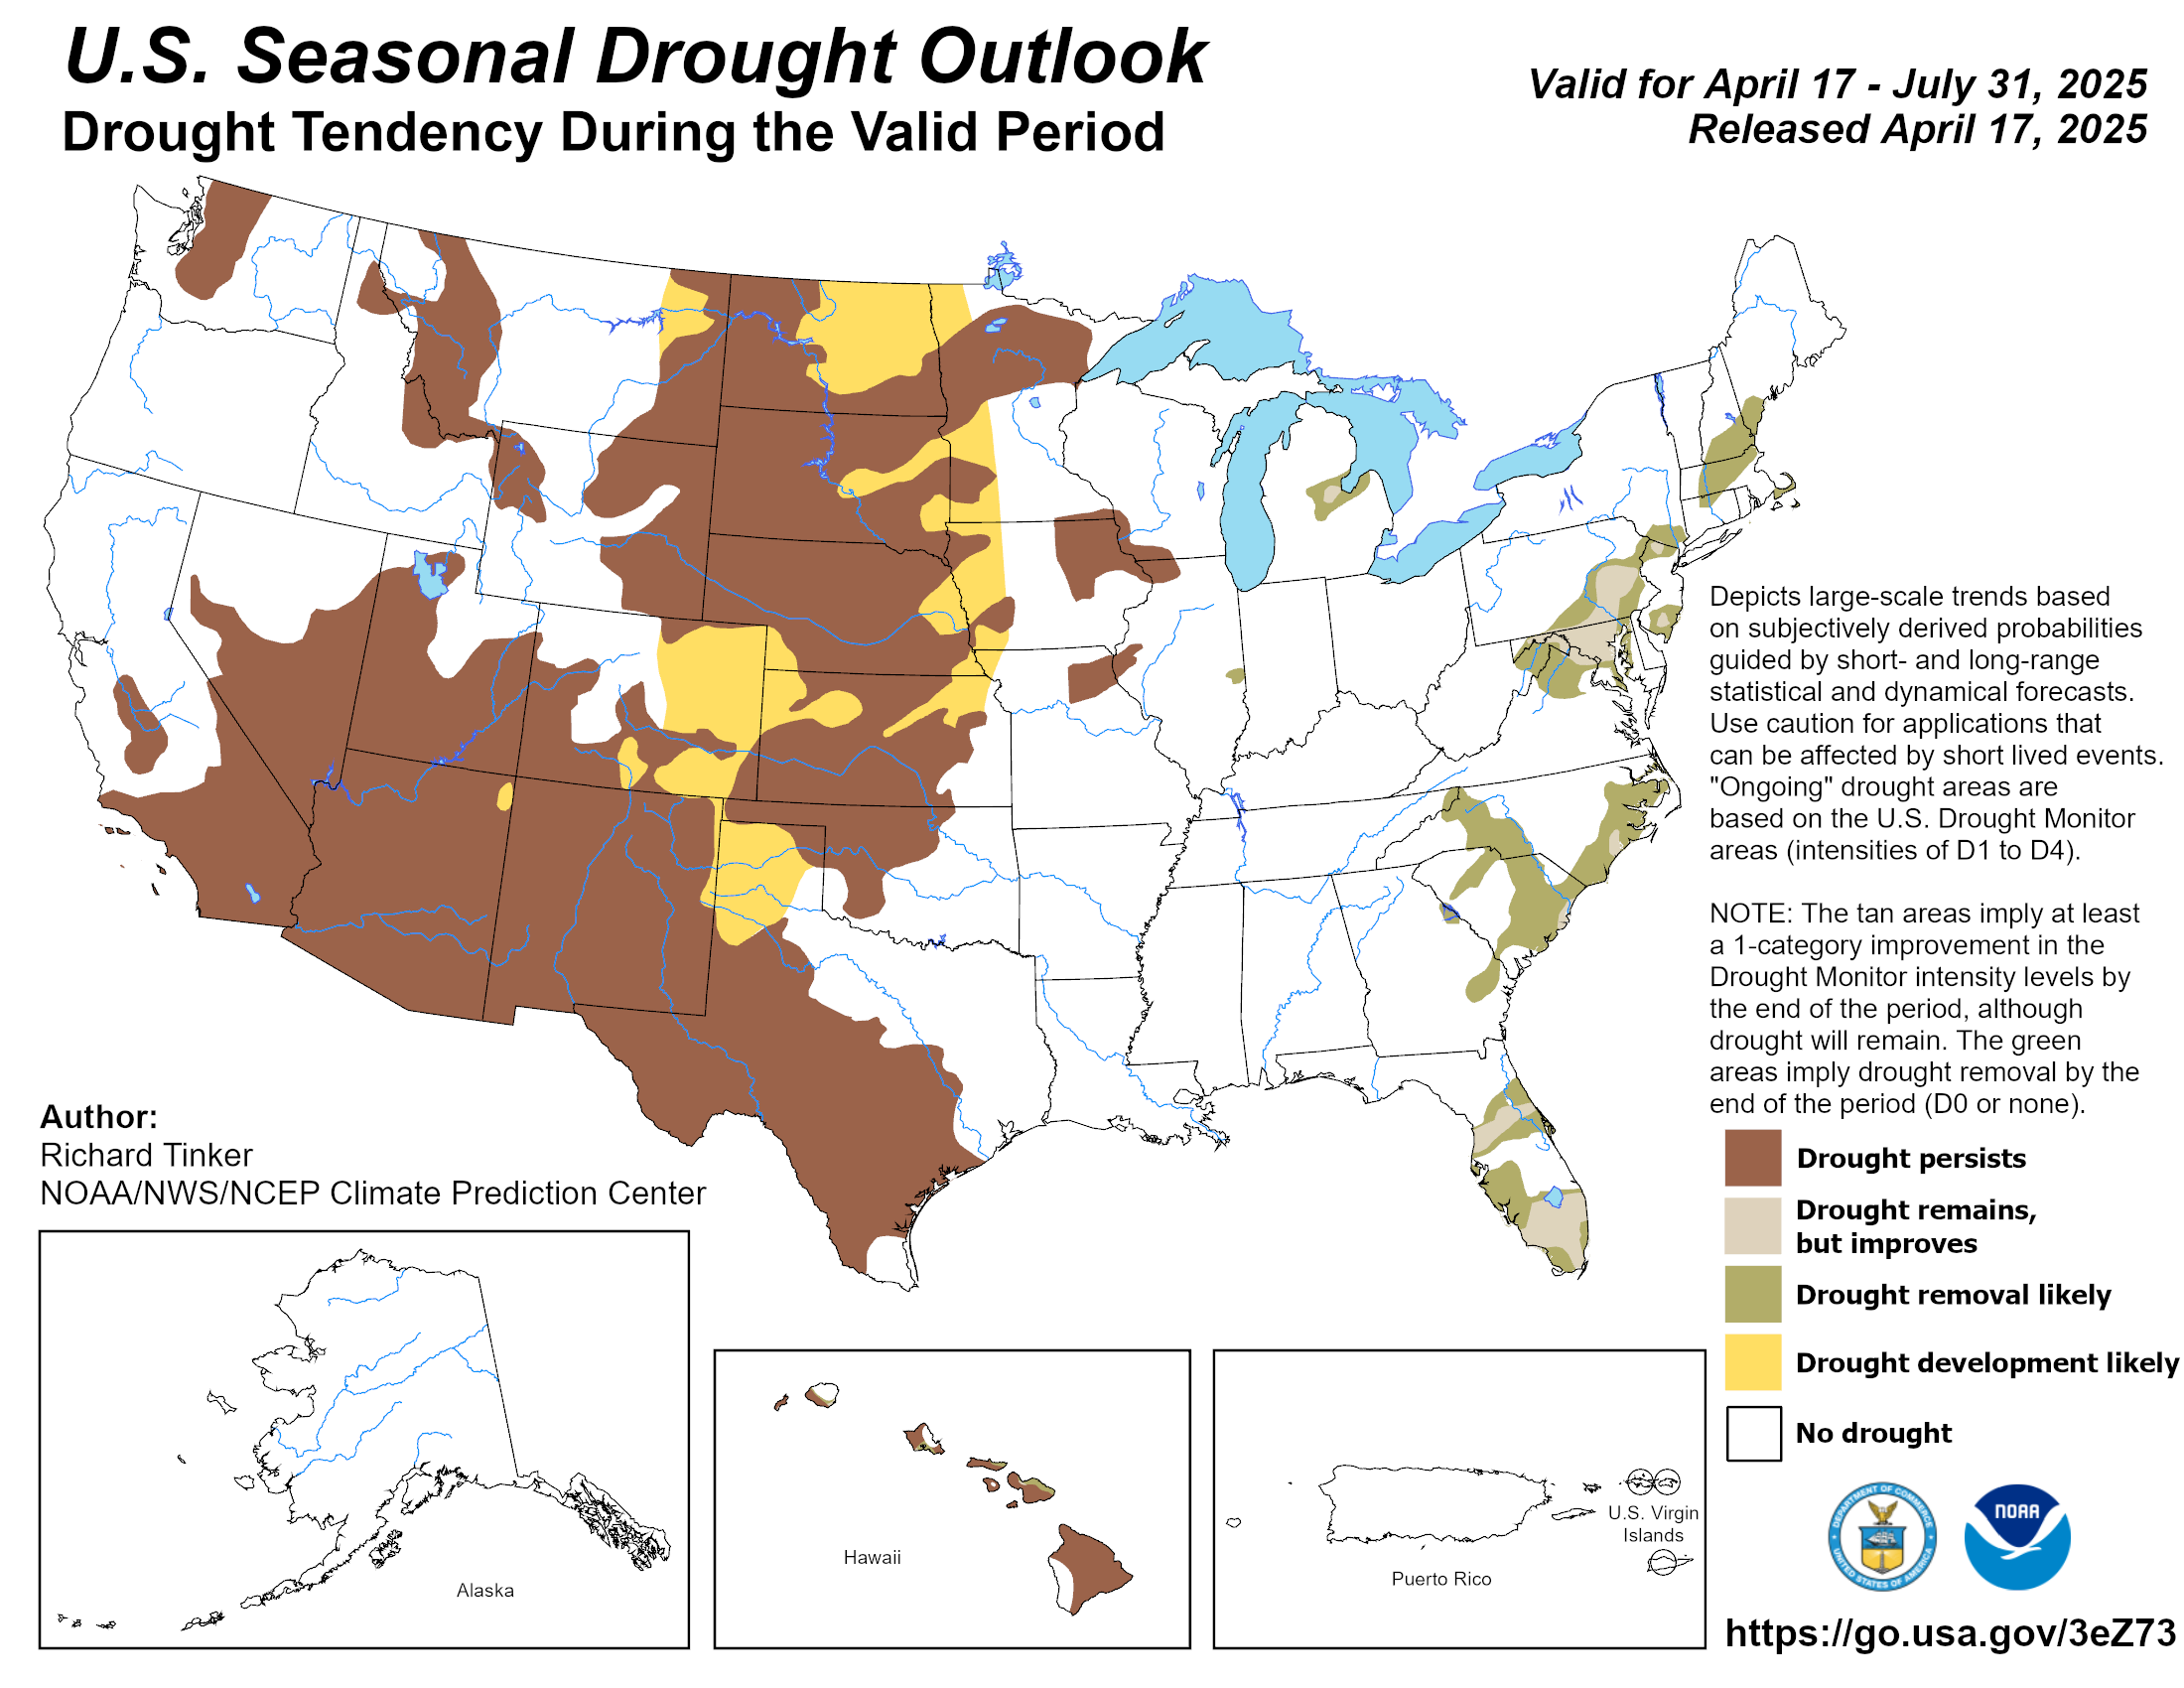
Here is the Monthly Drought Outlook which was updated on July 31, 2019

Here is the discussion that was released with this new forecast.
Latest Monthly Assessment – Drought (D1 or drier) continued to remain at historically low levels (3.04%) across the lower 48 States as of July 23, slightly less than a month ago (3.30% on June 25). For August 2019, however, persistence and some short-term drought expansion should be more common than improvement since there was very little drought in the contiguous U.S. at the end of July. In the Northwest, good odds for above normal temperatures and minimal rainfall (their dry season) is expected as drought should persist and slightly expand eastward. August normally brings monsoonal moisture from Mexico northward into the Southwest, and with favorable chances for above-normal rainfall, this should finally eliminate the small D1 area in New Mexico from what was still left from a protracted and intense drought in the Four Corners Region during 2018 and into early 2019. In the Plains and Midwest, a wet Spring and early Summer discouraged deep (subsoil) root penetration for most plants, and with recent dryness and heat, the topsoil moisture has rapidly declined, leading to adverse crop impacts. With most forecasts favoring subnormal August rainfall, short-term (topsoil) drought development was anticipated in the eastern Corn Belt, upper Great Lakes region, and southern Plains, with expected above-normal monthly temperatures exacerbating the dryness in the latter area. In the Southeast, the lack of consistent forecasts, along with an unexpected wild card tropical system or two, left the small areas of D1 and D2 to persist.
Outside the contiguous U.S., the swath of drought across central Puerto Rico should improve in August as a recent increase in tropical waves has brought welcome rains to the island. With subnormal precipitation and above normal temperatures favored across the southern Alaskan coast during the month, drought should continue in the Kenai Peninsula and across the southeastern Alaskan Panhandle, along with possible development in-between these two areas of persistence. Farther north in the interior, August is typically one of the wettest months of the year, and with rainfall recently increasing, temperatures moderating, and forecasts favoring above-normal precipitation odds, drought should improve there. In Hawaii, August is a relatively dry time of year in the leeward areas, and they should remain in drought. With the El Nino fading, the normal trade winds are expected to return and bring the windward sides increased rainfall, hence the improvement on the northeast coast of the Big Island.
Here is the Three-Month Forecast Issued on July 18 which will be updated on August 15, 2019
Floods remain a concern.

https://econintersect.com/images/2019/07/15950233MapoffloodandHighWaterJuly192019.JPG
| Last Week | Current Week |
|
|

Let’s see if this animation works.

Active Major Fires

It is mostly about Alaska.

Looking out another month.


International

A map helps and is not always available and fortunately, it was available this week.

Major Sources of Information
In the box are shown the major resources we use. We will not be using them all each week but the reader is welcome to refer to these resources. .
Major Sources of Information Used in this Weekly Report
|
Background Information


The sequence of drought occurrence and impacts for commonly accepted drought types. All droughts originate from a deficiency of precipitation or meteorological drought but other types of drought and impacts cascade from this deficiency. (Source: NDMC)
Source: National Drought Mitigation Center, University of Nebraska-Lincoln


