Written by Sig Silber
We published the NOAA Long-Term Forecast Friday Night and it can be accessed here. In Part II (this post), we compare the NOAA forecast for Alaska and CONUS with the JAMSTEC forecast and also attempt to provide some explanation for the differences. The differences in the weather forecasts may be somewhat related to how each agency deals with the western displacement of the warm anomaly along the Equator in the Pacific. Our report provides the JAMSTEC forecasts for the whole World. In parts of the world, the interaction between the IOD and the EL Nino are important and JAMSTEC is experienced in that area. In our report, we also pay special attention to Europe.

Please share this article – Go to the very top of the page, right-hand side for social media buttons. Please feel free to send this article to anyone who you think might find it interesting and or useful.
Prologue
When discussing ENSO we usually focus on the NINO 3.4 Index. It seems to me that Asian forecasters pay more attention than NOAA to other parts of the NINO measurement area and the pattern of sea surface temperatures in the Pacific. We do not know for sure the extent to which this might explain the differences in the forecasts because the forecasts for Nino 3.4 also varies between NOAA and JAMSTEC and within NOAA.

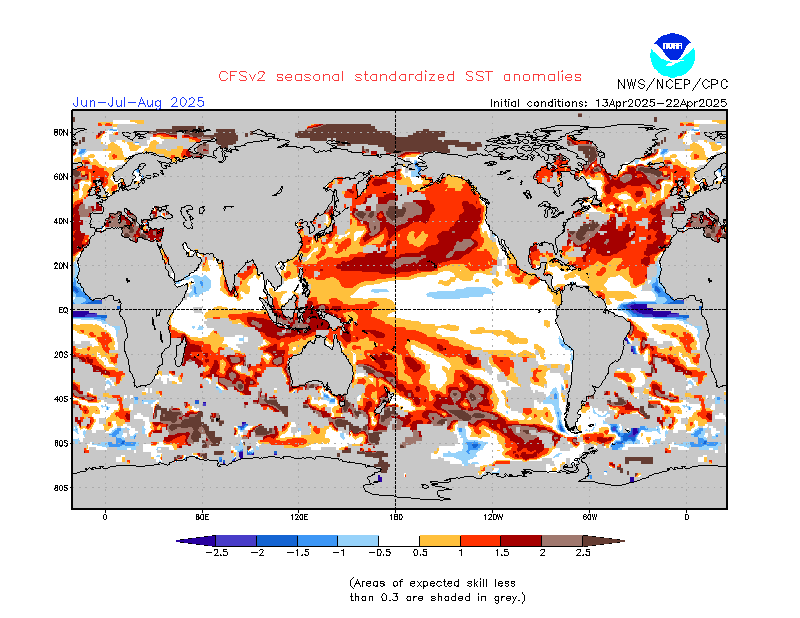
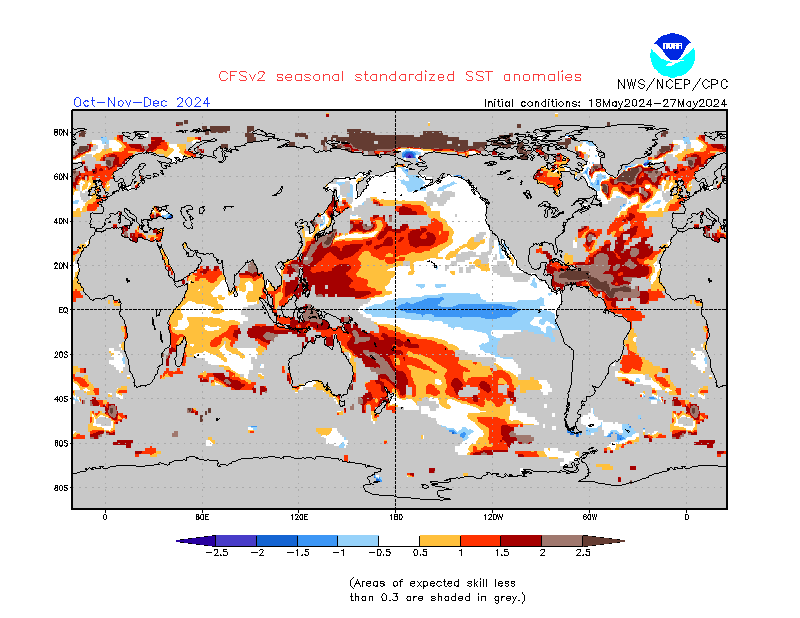
From the JAMSTEC discussion shown later.
Warmer-than-normal sea surface temperature is observed now for the central tropical Pacific. As predicted earlier, this is similar to the El Niño Modoki-like state. The SINTEX-F predicts the El Niño Modoki-like state will persist until late summer. We need to be careful of its impact, as it may be different from that of the canonical El Niño. Then, the tropical Pacific is expected to return to a normal state by mid-autumn.
You can see the locations of the warm anomaly in this graphic.

Now we compare the two NOAA forecasts with the JAMSTEC forecast. We do it again later in the article but this comparison may be easier to see. The first image is the Early-July IRI-CDC ENSO probabilities. The second image is the JAMSTEC proprietary forecast model for the Nino 3.4 Index. The third is the NOAA proprietary model CFSv2.
|
|
|


This forecast came out probably after the NOAA forecast was released on July18. And it may reflect the possibility of Kelvin Wave#5. This all attests to the difficulty of making forecasts and partially explains why different forecasts are different.

One of the reasons for doing this comparison is it provides the ability to create our own updated forecast as we see the assumptions made by each agency be confirmed or not. That is especially true when the actuals start coming within the range of the two sets of assumptons. Weather is not linear so it is more complex than scaling the solution to where the actuals are showing up relative to the two versions of the assumtions but with a little imagination one might be able to sort it out. You will be able to better understand what I have just said as we look at the two different forecasts.
C. Now to our full report. (Sections A and B were covered in Part I which can be accessed here)
This report is organized into a summary that has two tables of graphics that show the temperature and precipitation forecasts for the upcoming three seasons, a brief discussion of the ENSO assumptions by both NOAA and JAMSTEC and then the JAMSTEC Agency discussion and then a comparison of the two forecasts which is basically an expansion of the summary table.
Summary of the NOAA and JAMSTEC Forecasts
For those who want a quick synopsis of the two forecasts, below is a summary of the temperature and precipitation forecasts for three time-periods and from left to right the NOAA forecast for Alaska and CONUS (the contiguous mid-latitude U.S), then JAMSTEC for North America (which includes Canada and Mexico), and then JAMSTEC for Europe and surrounding areas. Larger graphics are provided later in the report. (the graphics in the Summary Table are not set up to be clicked on to enlarge). The Summary Table is kind of a tease to keep you reading but you can see the evolution of the weather pattern through Summer, Fall, and then into Winter. For some readers, these two sets of summary graphics may be all the information they wish to look at and that is fine.
Temperature
| NOAA Alaska Plus CONUS | JAMSTEC North America | JAMSTEC Europe | |
Fall SON 2019 |  |  |  |
Winter DJF 2019-2020 |  |  |  |
Spring MAM 2020 |  |  |  |
Precipitation
| NOAA Alaska Plus CONUS | JAMSTEC North America | JAMSTEC Europe | |
Fall SON 2019 |  |
|  |
Winter DJF 2019-2020 |  |  |  |
Spring MAM 2020 |  |  |  |
We provided the full NOAA Discussion in Part I. Here is the much shorter JAMSTEC Discussion released on July 17, 2019
Prediction from 1st Jul., 2019
ENSO forecast:
Warmer-than-normal sea surface temperature is observed now for the central tropical Pacific. As predicted earlier, this is similar to the El Niño Modoki-like state. The SINTEX-F predicts the El Niño Modoki-like state will persist until late summer. We need to be careful of its impact, as it may be different from that of the canonical El Niño. Then, the tropical Pacific is expected to return to a normal state by mid-autumn.
Indian Ocean forecast:
As predicted earlier, a positive Indian Ocean Dipole quickly emerged in May and now persists. The model predicts that the positive Indian Ocean Dipole will persist in autumn, and then quickly decay in winter. We may observe co-occurrence of a positive Indian Ocean Dipole and an El Niño Modoki-like state in summer and autumn; this is as we observed in 1994 and 2018. [Editor’s Note: We have been discussing 1993/1994 as the late start to planting reminds us a bit of 1993]
Regional forecast:
On a seasonal scale, SINTEX-F predicts that most part of the globe will experience a hotter-than-normal condition in boreal autumn. In boreal winter, most part of the globe will still experience a warmer-than-normal condition, except for some parts of central U.S.A., northeastern Brazil, Angola, western Africa, and eastern Russia.
As regards to the seasonally averaged rainfall in boreal autumn, a wetter-than-normal condition is predicted for western coastal area of Canada, Mexico, East Africa, southern West Africa, India, most part of Southeast Asia, and southern Philippines. In contrast, some parts of U.S.A., the South American Continent, southern Africa, western Europe, eastern China, most part of Indonesia, and Australia will experience a drier-than-normal condition. Some of them will be partly due to the expected positive Indian Ocean Dipole (see schematic of a positive Indian Ocean Dipole event: http://www.jamstec.go.jp/aplinfo/sintexf/e/iod/about_iod.html). In particular, we notice that Indonesia and Australia may experience extremely drier than normal condition, owing to the expected co-occurrence of a positive Indian Ocean Dipole and an El Niño Modoki-like state. In boreal winter, a wetter-than-normal condition is predicted for Alaska, western coastal area of Canada, eastern U.S.A., eastern Brazil, some parts of East Africa and central Africa, and northern Europe. In contrast, western U.S.A., eastern part of southern Africa, southern Europe, Australia, most part of Southeast Asia, southeastern China, and Indonesia will experience a drier-than-normal condition.
The model predicts most part of Japan will experience warmer- and wetter-than-normal condition in autumn as a seasonal average. In winter, most part of Japan will be still warmer-than-normal condition.
It is useful to look at the forecasts for the Nino 3.4 Index used to determine if the Sea Surface Temperatures meet the criteria for an El Nino(+0.5 C or higher). Here is a brief summary of the Indices of the two Agencies and how they compare. Three of these graphics were presented earlier. We use them again here and add two more to provide a more detailed analysis.
| One Year | JAMSTEC Two Years | |
| JAMSTEC |
|
|
| CFS.v2 | CPC-IRI Probabilities | |
| NOAA |
|
|
| Comparing the one-year JAMSTEC NINO 3.4 graphic above to a similar period for both the NOAA models, one sees a lot of similarity but differences namely the move towards at least a La Nina Bias in the NOAA proprietary CFSv2 Modle. | The IRI/CPC forecast uses different units namely probabilities rather than absolute levels of the NINO 3.4 Index | |
| The so-called Modoki index is interesting because it clearly indicates a Modoki or a Modoki bias throughout the forecast. This index was confusing last month but not this month. It is more positive than the JAMSTEC Nino 3.4 Index throughout the one year forecast and initially is at El Nino Modoki Levels. |
|
Indices use a single number to convey information. Sometimes it is useful to look at the forecast Sea Surface Temperatures that correlate to the indices. I believe that the SST’s directly correlate with the JAMSTEC Nino 3.4 Index and their forecast but NOAA uses a variety of tools so it is not so easy to understand exactly how they do their forecast but there is a lot of information on that in their lengthy discussion which was presented in our Part I Report.
| NOAA | JAMSTEC |
 |  |
|  |
NOAA does not have a MAM 2020 graphic like the two above to compare with the JAMSTEC MAM image. |  |
Updates from JAMSTEC can be found here. Updates from NOAA can be found here. You have to look for the SST row and go to the right where it says “normalized with mask” and click on E3 which provides the latest model run.
All of these forecasts depend to a large extent on what is known about subsurface temperature anomalies. Here is the latest analysis. Updates can be obtained here.

Does the SOI confirm that El Nino Conditions apply? The SOI is one measure of the extent to what the atmosphere has been impacted by the Eastern Pacific surface pattern which is measured by the Nino 3.4 Index. After all, we are more interested in the impacts to weather in the atmosphere which impacts populated areas than we are about the temperature distribution of the ocean surface along the Equator in the Pacific Ocean.

SOI = 10 X [ Pdiff – Pdiffav ]/ SD(Pdiff) where Pdiff = (average Tahiti MSLP for the month) – (average Darwin MSLP for the month), Pdiffav = long term average of Pdiff for the month in question, and SD(Pdiff) = long term standard deviation of Pdiff for the month in question. So really it is comparing the extent to which Tahiti is more cloudy than Darwin, Australia. During El Nino we expect Darwin Australia to have lower air pressure and more convection than Tahiti (Negative SOI especially lower than -7 correlates with El Nino Conditions). During La Nina we expect the Warm Pool to be further east resulting in Positive SOI values greater than +7).
D. Now we begin our comparison of the NOAA and JAMSTEC Forecasts (Focus on next nine months i.e. three seasons)
In this Update, we compare the JAMSTEC temperature and precipitation forecast maps, which are for the World, with the NOAA temperature and precipitation forecast maps that cover only CONUS and Alaska. We do this primarily for educational purposes.
JAMSTEC works in three-month intervals which correspond to seasons and does not change the selection of months each time they update but does so every three months. At that time they drop one season and add another season further in the future. JAMSTEC provides maps for three seasons and the choice of seasons changes every three months. So for one out of three months, the first season lines up perfectly but this is not that month. So for JAMSTEC, we have Fall (SON), Winter(DJF) and Spring (MAM) and we are using the same for NOAA in the comparison.Thus we are not comparing August but we have analysed August in Part I of this Report which can be accessed here.
I show the NOAA Maps first followed by the JAMSTEC maps. I extract North America from the Worldwide JAMSTEC map and use that to compare with the NOAA Maps. I also extract Europe including parts of North Africa and Western Asia from the Worldwide JAMSTEC maps and include those excerpted maps in the summary table at the beginning of this article.
Now we will compare the maps in that summary but with full-sized maps.
Fall SON 2019
Temperature for NOAA
And here is the SON 2019 temperature forecast for North America that I extracted from the JAMSTEC World Forecast.
And now the JAMSTEC WORLD FORECAST (for this graphic my comments are mostly related to areas other than Alaska and CONUS as those comments appear with the larger graphics above)
|
Precipitation
NOAA
And here is the SON 2019 Precipitation Forecast for North America that I extracted from the JAMSTEC World Forecast.

And now the JAMSTEC WORLD FORECAST (for this graphic my comments are mostly related to areas other than Alaska and CONUS as those comments appear with the larger graphics above)
Winter DJF 2019/2020
Temperature
NOAA
And here is the DJF 2019-2020 Temperature Forecast for North America that I extracted from the JAMSTEC World Forecast.
JAMSTEC WORLD FORECAST
Precipitation
NOAA
And here is the DJF 2019/2020 Precipitation Forecast for North America that I extracted from the JAMSTEC World Forecast.
JAMSTEC WORLD FORECAST
Spring (MAM – 2020)
Temperature
NOAA
And here is the MAM -2020 Temperature Forecast for North America that I extracted from the JAMSTEC World Forecast.
JAMSTEC WORLD FORECAST
Precipitation
NOAA
And here is the MAM 2020 NA precipitation I extracted from the JAMSTEC World Map
JAMSTEC WORLD FORECAST
D. Conclusion
Similar to last month and the prior month, both NOAA and JAMSTEC have forecasts that in one way or another incorporate the ENSO Phase in their forecasts. The focus is on the change in the current weak El Nino and the timing of such changes. It seems that NOAA just does not like calling a westerly displaced El Nino a Modoki.
Slight changes in the ENSO Phase are likely to change the actuals from what has been forecast. I do not have a lot of confidence in either of the forecasts but for different reasons. NOAA may not be properly taking into account the Modoki aspect of the situation and JAMSTEC may be underestimating the speed at which a La Nina bias may develop.
.


