Written by Sig Silber
Crop analysis now includes categories. This season one category just does not look good. Another category could be good with favorable harvest conditions (dry weather and late freeze). This week June weather conditions are covered for a number of international regions. As usual there is a report on the U.S. Drought Monitor.

Please share this article – Go to the very top of the page, right-hand side, for social media buttons. Please feel free to send this article to anyone who you think might benefit from reading it.
New Format: Each week our Thursday night article will cover the Drought Monitor Report issued by NOAA in conjunction with the University of Nebraska – Lincoln and a summary of U.S. crop conditions. It provides a link to the Severe Weather Report (this will take two clicks since that report gets republished each day and so you click here to get to the Directory and then click again on the version of the Severe Weather Report closest to the top of the list. Soon we will have a link to a full weather report, not just severe weather. Each week, but not today, this article will have a different special feature. We have not worked that out yet but most likely those features might be: A. a more detailed look at the prior month’s crop progress B. a review of the prior month’s weather C. a review of the prior month’s International Weather ( feature this week) D. Current conditions of rivers and reservoirs. E. Economic Impacts other than crop-related F. Other. (what will determine U.S. crop success is a feature this week) The goal is to reduce the time needed to read the article and provide information each week that changes each week and provide information that changes more slowly on a monthly basis. Please provide feedback by completing the survey below on how you feel about the new format and what would make this article more useful to you. |
New Drought Forecast
First we show the the Seasonal Forecast through October which was issued on July 18 (to be updated on August 15) and then the current month. These two forecasts are issued by the same agency but to obtain them you need to access two different links here and here.
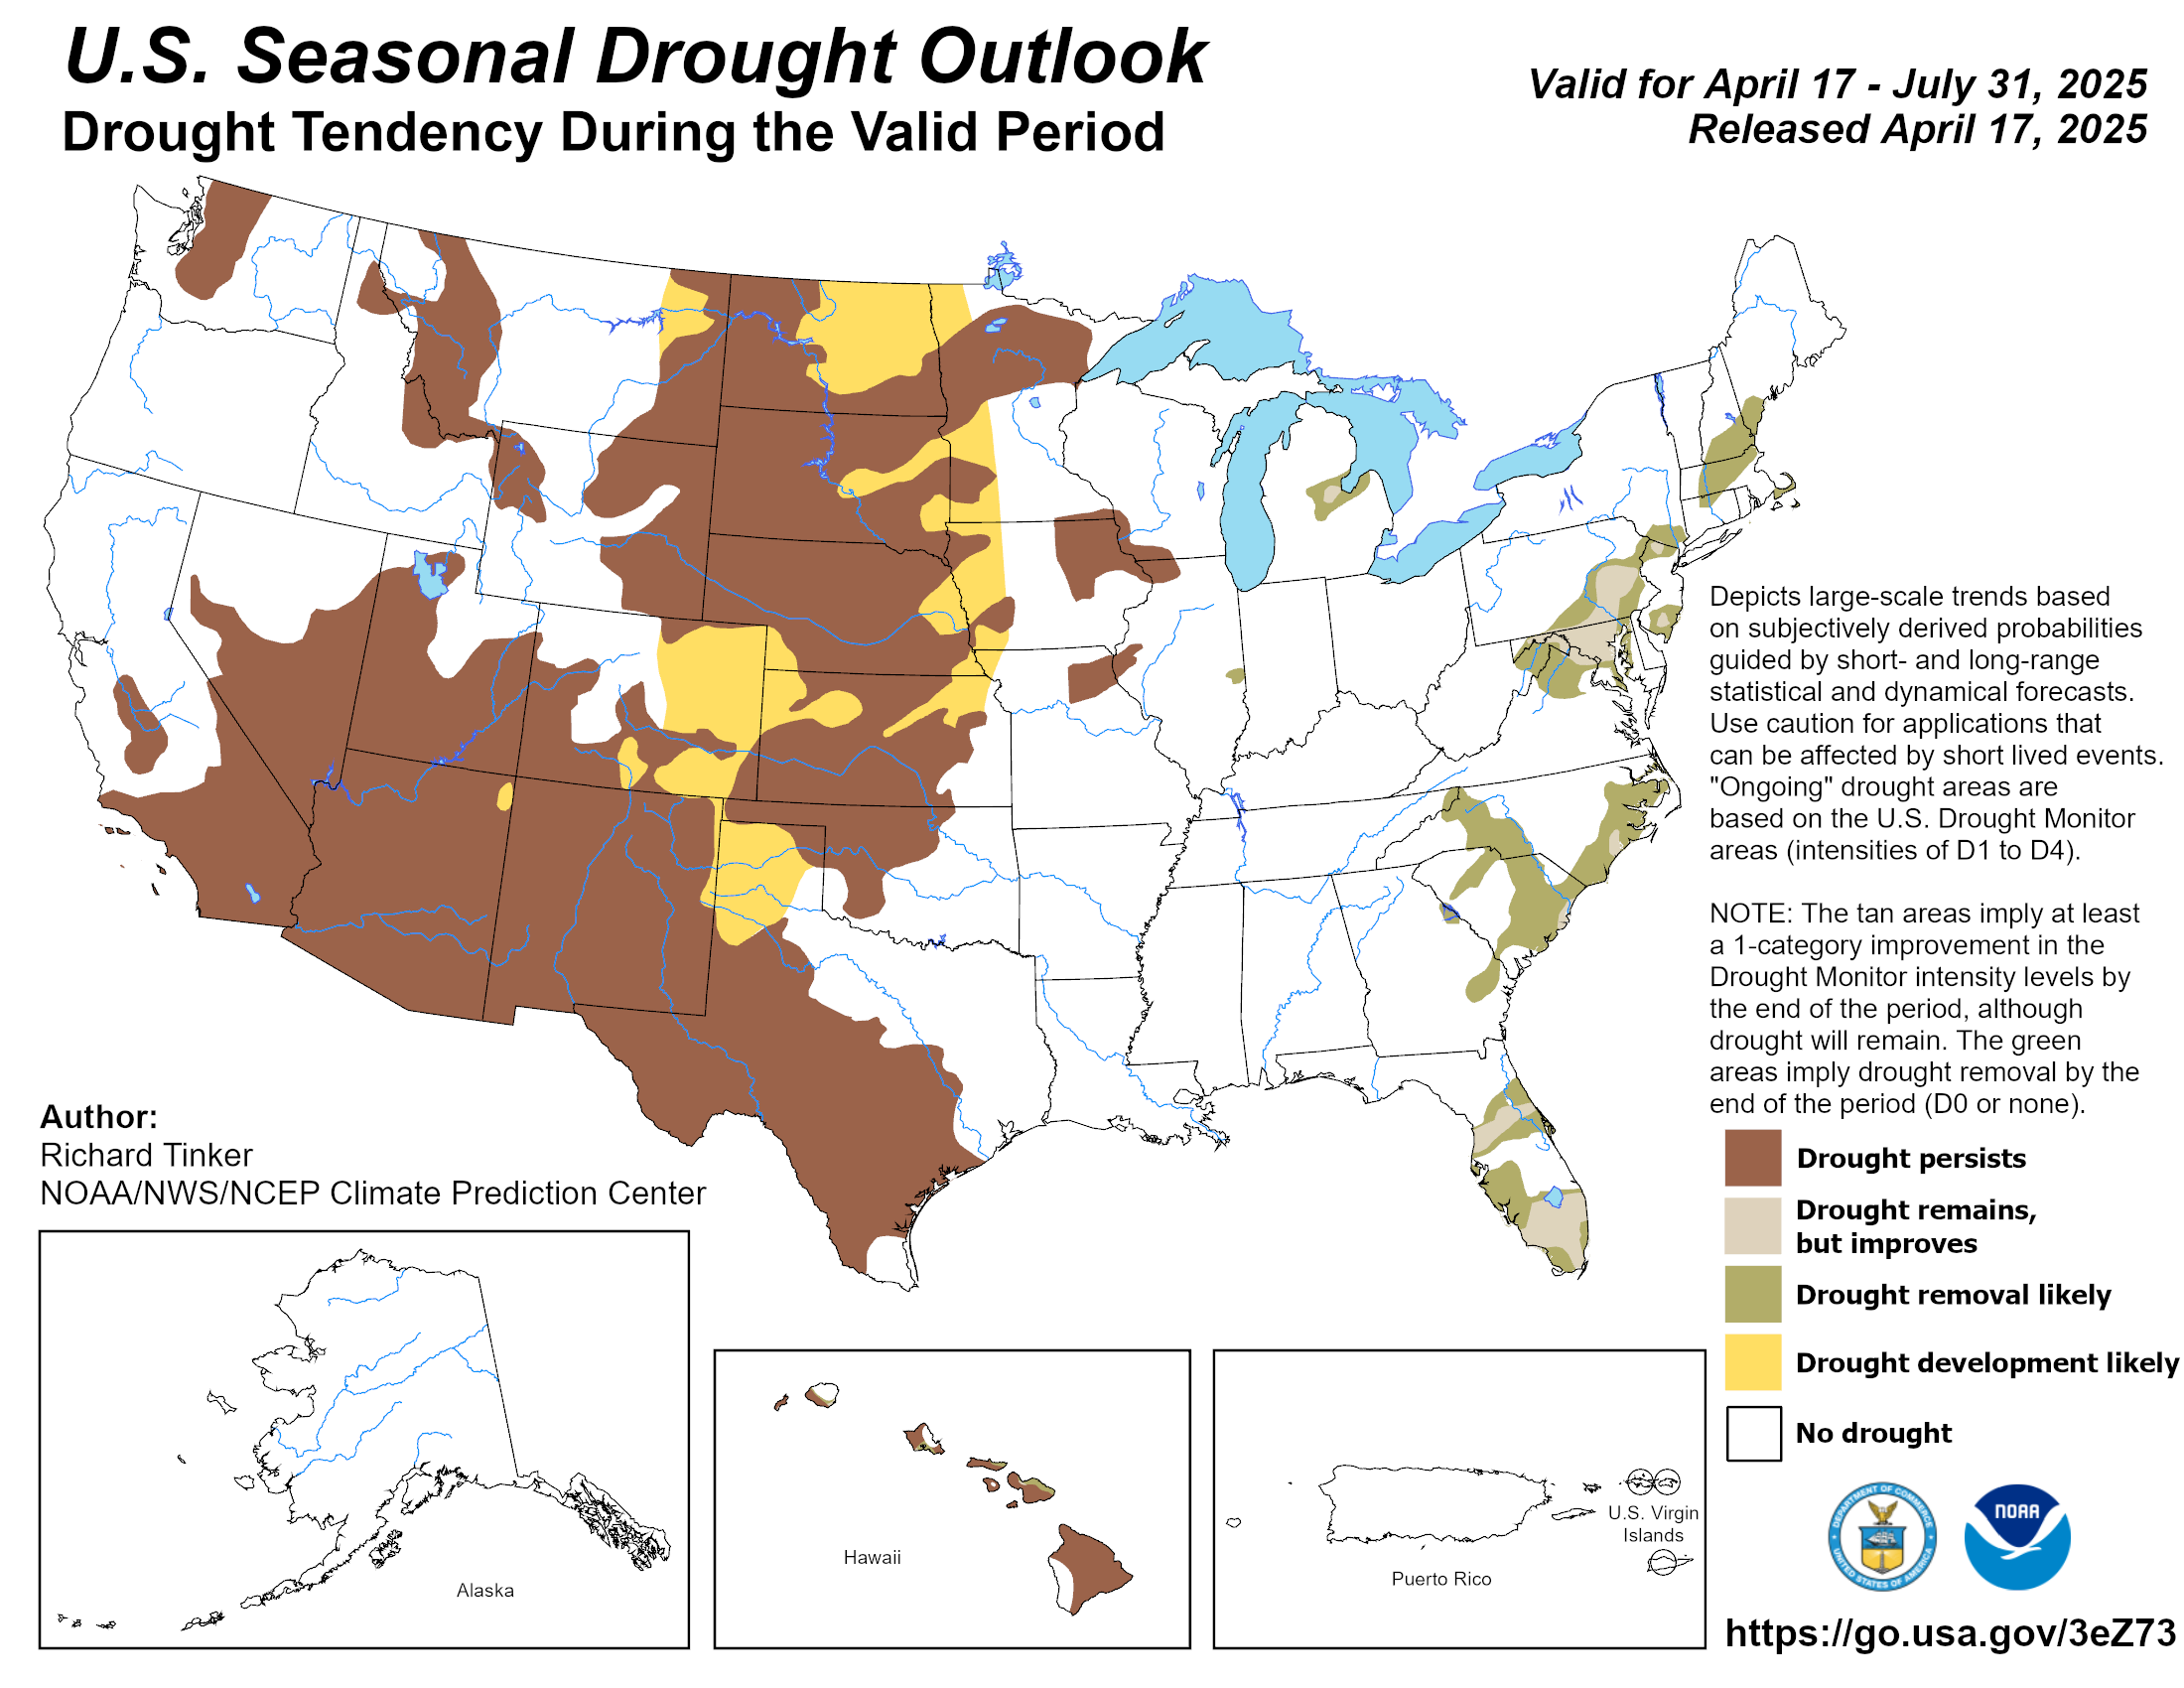
The updated Map came with the following discussion.
Latest Seasonal Assessment – A transition from El Niño to ENSO-neutral is expected in the next month or two, with ENSO-neutral most likely to continue through Northern Hemisphere fall and winter. As of July 9, drought coverage in the contiguous U.S. remained extremely low (3.23%), slightly decreasing from last month’s 4.12% on June 11. During the past 30 days, surplus rains fell on much of the northern and central Plains, the southern Great Plains, the Mississippi and Ohio River Valleys, mid-Atlantic, northern New England, and Florida. Moisture from the remnants of minimal Hurricane Barry, which made landfall in central Louisiana, dumped locally heavy rains (more than 10 inches) on parts of the lower Mississippi Valley. In contrast, subnormal precipitation was observed in portions of the west-central Corn Belt, southern New England, parts of the Southeast, the southern High Plains, and most areas west of the Rockies (which is typically dry this time of year). 30-day temperatures averaged above normal in the eastern half of the Nation and Alaska, with subnormal readings in the West, Rockies, and High Plains.
Outside the contiguous states, drought (D1-D2) expanded into much of southwestern and northeastern Puerto Rico during the past 30-days, with most locations reporting under half of normal rainfall (except for surplus rains in northwestern). Historically heavy out-of-season rains occurred on parts of the Hawaiian leewards (e.g. 5.52 inches at Honolulu on June 25-26), especially across Niihau, Kauai, Oahu, and Molokai, easing or removing drought there; however, drought remained on southern Maui and parts of the Big Island which missed the late June heavy rains. In Alaska, extreme heat (highs in the 90’s) and subnormal rainfall increased abnormal dryness and drought in the interior and enhanced wild fire conditions as 1.1 million acres have been scorched this year. In the lower 48 States, only moderate to severe drought existed, with severe drought (D2) limited to small areas of the Pacific Northwest, southern Texas, and southeast Alabama.
By the end of October, drought coverage should still be minimal, but some current areas are expected to persist or expand. Drought is expected to develop and persist in the Northwest, southern Texas, and Puerto Rico, and re-develop along the leeward sides of the western Hawaiian Islands (Kauai, Oahu, and Molokai). Conditions should remain unchanged in leeward portions of Maui and the Big Island and along the southeastern Alaska Panhandle. In contrast, drought should be gone from eastern and south-central Alaska, northern North Dakota, western New Mexico, and the Southeast. In Hawaii, as ENSO-neutral conditions become established and the trade winds return to normal, drought should disappear from the windward side of the Big Island.

Crop Conditions
The following table summarizes the situation.
| Crop development not Late | OK | Crop Development Late | |
| Crop Condition Good | Winter Wheat* Cotton Sorghum | ||
| Crop Condition OK | Peanuts | Rice Oats | |
| Crop Condition Bad | Corn Soybeans Barley Spring Wheat |
* I do not have information on the condition of the Winter Wheat crop but assume that it is good and located it in the table accordingly.
Here we have some actual projections.

Wheat

Corn

Soybeans

And here is a happier situation. Sometimes it is easier to read the percentages shown for each state than to figure out the color coding which is very tiny in the legend.

Great Lakes Impacts.

Just to provide a feel for what it looks like

And this can be a problem also

Many thanks to the “North Central U.S. Monthly Climate and Drought Summary and Outlook” I participated in their Webinar this morning and made copies of some of their slides which I have just presented.
International Weather for June Selected Areas. The Full Report can be found here.


Present Drought Conditions
The U.S. Drought Monitor is a comprehensive way of understanding the drought situation for the U.S. It is issued every Thursday and reflects the conditions as of the prior Tuesday. Drought is defined as a moisture deficit bad enough to have social, environmental or economic effects. Thus, more factors than recent precipitation are considered and more information on how it is done is found at the end of this report.

U.S. Affiliated Pacific Islands and the U.S. Virgin Islands.

Below is the map for just CONUS.
 |
 |
| Last Week | This Week |
| |

Some might find this animation of twelve weeks of change useful;

The graphic below shows the one-week change in drought intensity. Yellow is bad. Green is good.
|

Here is the Discussion that was issued with the Drought Report.
This Week’s Drought Summary
Hurricane Barry made landfall in southern Louisiana on July 13, delivering locally heavy showers and a modest storm surge but largely sparing crops and communities in the path of the poorly organized storm. Once inland, Barry drifted northward and was quickly downgraded to a tropical storm and – by July 14 – a tropical depression. Outside of Barry’s sphere of influence, locally heavy showers dotted the Southeastern and Mid-Atlantic States, sparking local flooding. Locally heavy rain also soaked portions of the North, with some of the highest totals reported across the northern half of the Plains and the upper Midwest. Many other areas of the country, including a large expanse of the West and parts of the southern Plains and the Midwest, experienced warm, dry weather. In fact, near- or above-normal temperatures dominated the country, as mid-summer heat began to build. Areas affected by Barry’s remnants, including the mid-South, remained somewhat cooler due to cloudy, showery weather. In part due to mid-July heat, short-term dryness was of great concern across the lower Midwest, where compaction, crusting, and dryness was reported in previously saturated topsoils.
Northeast
Abnormal dryness (D0) has begun to develop in parts of southern New England and environs. On July 14, the U.S. Department of Agriculture (USDA) reported topsoil moisture 95% short in Connecticut. Based on short-term precipitation deficits and low streamflow values, a spot of D0 was introduced in western sections of Connecticut and Massachusetts, as well as a tiny sliver of eastern New York. From June 1 – July 16, rainfall in Hartford, Connecticut, totaled just 2.71 inches (43% of normal). During the same 46-day period, Poughkeepsie, New York, received 3.85 inches (58% of normal).
Southeast
Pockets of dryness (D0) and moderate drought (D1) persisted from the Carolinas southward, with some areas receiving heavy showers and other remaining mostly dry. A couple of small areas of severe drought (D2) stretched from northwestern Florida to southwestern Georgia, including portions of southeastern Alabama. Showers associated with the remnants of Hurricane Barry were heaviest across western Alabama. In southeastern Alabama, however, Dothan’s rainfall from June 1 – July 16 totaled 4.83 inches (55% of normal). On July 14, USDA reported that topsoil moisture was 41% very short to short in Georgia and 30% very short to short in Alabama. On the same date in North Carolina, 30% of the corn for grain was rated in very poor to poor condition.
South
Hurricane Barry erased dryness (D0) from Louisiana and nearly so from Mississippi. There was also a reduction in D0 coverage in Tennessee. Meanwhile, hot, dry weather covered much of southern Texas, leading to expansion of dryness (D0) and moderate to severe drought (D1 to D2). July 11 featured a daily-record high in Brownsville, Texas (100°F). Elsewhere in Texas, Corpus Christi posted three consecutive daily-record highs (101, 101, and 103°F) from July 11-13. Brownsville noted another daily-record high, 102°F, on July 13.
Midwest
The Midwest remained free of drought, but several areas were being watched for possible future introduction of abnormal dryness (D0). By July 14, USDA reported that topsoil moisture ranged from 19 to 26% very short to short in Illinois, Indiana, Michigan, Missouri, and Ohio. Due to antecedent wetness resulting in soil compaction, as well as late-planted crops such as corn and soybeans exhibiting poor root development, drought-related impacts could develop very quickly during the summer of 2019. During the last 2 weeks, mostly dry weather has prevailed in a broad area centered on northern Missouri and southern Iowa; this area and other dry Midwestern pockets will be closely monitored. Meanwhile, upper reaches of the Midwest received heavy showers and thunderstorms, which resulted in a reduction in the coverage of abnormal dryness (D0) across northern sections of Michigan, Minnesota, and Wisconsin.
High Plains
Heavy showers and thunderstorms sweeping across North Dakota eradicated severe drought (D2) and reduced the coverage of moderate drought (D1) and abnormal dryness (D0). In the Dakotas, daily-record amounts for July 9 totaled 3.12 inches in Williston, North Dakota, and 1.29 inches in Watertown, South Dakota. The remainder of the High Plains remained free of dryness and drought.
West
Minimal changes were made, although generally cool weather in the Northwest contrasted with hot conditions in the Southwest. A few monsoon-related showers developed in the Four Corners States – the official monsoon start date in Tucson, Arizona, based on average dewpoint temperature, was July 13, the latest onset in that location since 2005. Meanwhile in eastern Washington, moderate drought (D1) was expanded due to an evaluation of water year-to-date precipitation totals; low reservoir levels; and soil moisture shortages. On July 14, USDA rated topsoil moisture 62% very short to short in Oregon and 39% very short to short in Washington.
Alaska, Hawaii, and Puerto Rico
By mid-July, more than 50 active Alaskan wildfires had collectively scorched well over 1.2 million acres of vegetation. In addition, record-setting heat continued to bake parts of Alaska. From July 8-10, McGrath reported a trio of daily-record highs (89, 84, and 85°F). On July 9, daily-record highs were also set in locations such as Fairbanks (87°F) and Nome (83°F). For Nome, it was the highest reading since July 7, 2014, when the temperature had reached 84°F. Given the heat and short-term dryness, abnormal dryness (D0) was broadly expanded across the Alaskan interior. In addition, moderate drought (D1) greatly increased in coverage across east-central Alaska and was introduced on the Kenai Peninsula. Meanwhile, moderate to extreme drought (D1 to D3) persisted or expanded slightly across southeastern Alaska, where a variety of impacts ranging from reduced hydroelectric power generation to fish mortality have been reported. Farther south, parts of Hawaii continued to benefit from earlier rainfall, resulting in the elimination of moderate drought (D1) from Kauai, Oahu, and Molokai. However, some severe drought (D2) was added across the northern part of the Big Island. In addition, all of Hawaii continues to deal with elevated temperatures due to unusually warm water surrounding the islands. On Maui, Kahului’s high temperatures reached or exceeded 90°F each day from June 21 to July 16. Elsewhere, there were only slight changes made to the drought depiction in Puerto Rico – the removal of abnormal dryness (D0) along part of the northern coast and a slight increase in moderate to severe drought (D1 to D2) along the south-central coast. In San Juan, Puerto Rico, significant rainfall deficits exist at many time scales. For example, San Juan received 4.46 inches (63% of normal) from June 1 – July 16 and through the 16th had a year-to-date total of 14.78 inches (57% of normal).
Pacific Islands
The weather pattern during this USDM week (7/10/19-7/16/19) consisted of several features which generated rain across a large part of Micronesia. A monsoon trough developed this week across Palau, the Marianas, and the Federated States of Micronesia (FSM), eventually extending to the Marshall Islands (RMI) by the end of the week. Weak circulations were embedded within the trough. Divergent flow aloft, associated with upper-level troughs, aided convection generated by the monsoon trough and its circulations. Rain over Kosrae State and the RMI was associated with interactions between tropical disturbances/weak circulations, a surface trough, and an upper-level trough. South of the equator, high pressure with dry and stable air dominated American Samoa for most of the week. A surface trough, which stayed north of the islands for most of the week, shifted southward and brought rain later in the week.
Satellite-based estimates of 7-day precipitation (QPE) showed a large area of 4+ inches of rain across western to southeastern Micronesia associated with the monsoon trough, with areas of 2+ inches stretching into the southern Marianas and northern RMI. Less than half an inch was indicated for the southern RMI and far northern Marianas. The QPE indicated most of the rain occurred north and east of the Samoan Islands, but some areas of 1 to 3 inches were indicated brushing the islands of American Samoa.
In the Republic of Palau, the monsoon trough dropped 7.76 inches of rain at the Palau International Airport this week. This brought the July total to 9.60 inches, which is above the 8-inch monthly minimum needed for most water needs. July marks the second wet (more than 8 inches) month, so D0-S was changed to D-Nothing.
The monsoon trough also spread rain into the southern Marianas. Based on data received so far, rainfall totals were well above the 1-inch weekly minimum at Rota (where 4.65 inches was recorded), Agat (3.87), Dededo (2.79), and Guam (1.97). These amounts bring the July monthly totals to 6.62 inches at Rota and 2.29 inches at Guam, which are above the monthly minimums for halfway through the month. Saipan recorded 0.75 inch for the week (with one day missing). While this is below the weekly minimum, rain has been falling on every day and vegetation has greened up significantly on Saipan. As a result of these conditions, the USDM status at Guam and Rota was improved to D2-S and at Saipan to D2-SL.
In the FSM, based on data received so far, weekly rainfall totals for the analyzed stations ranged from 1.99 inches at Kosrae to 6.22 inches at Kapingamarangi. With 5.71 inches for the week, 8.02 inches for July, and 13.14 inches for June, the status at Yap was improved from D0-S to D-Nothing. Fananu’s status was improved from D1-S to D0-S based on 4.22 inches for the week, 4.43 inches for July, and 8.00 inches in June. No data was received from Ulithi, so an analysis could not be made there. All other stations continued at D-Nothing.
In the RMI, Wotje received 3.26 inches of rain for the week and was the only wet station (more than the 2-inch weekly minimum). Weekly rainfall totals for the other stations ranged from 0.14 inch at Mili to 1.73 inches at Majuro. The July 1-16 total at Wotje is 3.26 inches. If no more rain fell at Wotje this month, July 2019 would rank as the 7th driest July out of 36 years, which is at the 19th percentile; January-July would rank 5th driest out of 33 years, which is at the 14th percentile. Considering these ranking percentiles and the rain that fell this week, the USDM status at Wotje was improved from D4-SL to D3-SL. This week marked the third consecutive dry (less than the 2-inch minimum) week at Mili (with 0.14 inch of rain this week) and Ailinglapalap (0.80 inch), and the monthly total for July so far was 0.84 inch at Mili and 1.10 inches at Ailinglapalap, so the status at these two stations was worsened from D-Nothing to D0-S. Kwajalein has received rain on several days this week and several days this month, which has been enough to green up the vegetation. But the week was dry (1.30 inches) and the month so far has been dry (2.27 inches for July 1-16), and June was dry (4.76 inches). June 2019 ranked as the 8th driest June out of 68 years, which translates to the 12th percentile which is well within the D1 range, so D1-S continued at Kwajalein. This week (1.73 inches) and month (2.71 inches) have been dry at Majuro. The reservoirs storage at Majuro has steadily declined during July, standing at 25.6 million gallons on July 16, which is 71% of the maximum, well below the 80% threshold for concern, so D0-S continued. D4-SL continued at Utirik, which recorded 0.88 inch for the week (with one day missing) and only 1.84 inches for July so far, and D1-S continued at Jaluit, which reported 0.94 inch for the week and 1.14 inches for July so far.
It was another dry week in American Samoa. The airport station at Pago Pago reported 1.65 inches of rain, and the automated stations at Siufaga Ridge and Toa Ridge recorded 1.72 inches and 0.72 inch, respectively. These are below the 2-inch weekly minimum. Monthly totals for June and so far in July are also below the monthly minimum, so D0-S continued for Tutuila.
Virgin Islands
The weather pattern during this USDM week (7/10/19-7/16/19) consisted of tropical waves alternating with drier, stable, dust-laden, Saharan air masses moving across the region in the easterly flow created by the Bermuda High. A TUTT (Tropical Upper-Tropospheric Trough) pattern aloft moved across the Caribbean waters early in the week. Radar estimates of precipitation for the week showed a couple east-west streamers of rainfall across the U.S. Virgin Islands (USVI), one clipping a corner of St. Thomas and another passing over St. Croix. Showers were generally light, although a record daily rainfall occurred over St. Croix.
Three-fourths of an inch (0.73 inch) of rain was recorded at the Henry Rohlsen Airport on St. Croix this week, and 0.48 inch of it fell on Thursday which was a daily record for July 11, besting the old record of only 0.23 inch set in 1960. This brings the monthly total for July 2019 to 0.95 inch, which is still 0.47 inch below normal, or 66.9% of normal, and the year-to-date total is still well below normal (58.8%, or 6.33 inches below normal). The Standardized Precipitation Index (SPI) for Christiansted Hamilton Field (Henry Rohlsen Airport) was at D1 levels for the last month and last 6 months, D2 levels for the last 9 months, and D3 levels at the 12-month time scale. According to government reports, the drought has reduced water table levels and arable farming and grazing lands, making it exceedingly difficult for territory livestock farmers to feed and water their animals. So the USDM status continued at D2-S on St. Croix.
A fourth of an inch (0.23 inch) of rain fell at the Cyril E. King Airport on St. Thomas this week. This brings the monthly total to 0.32 inch, which is 1.13 inches below normal or 22.1% of normal. The year-to-date total is 5.75 inches below normal, or 61.7% of normal. The SPI for the Charlotte Amalie Cyril E. King Airport was at D1 levels for the 1-, 6-, and 9-month time scales, D2 levels for the last 12 months, and D3 levels for the last 3 months. The CoCoRaHS observer near Anna’s Retreat on St. Thomas reported only 0.23 inch for July 1-14. D2-S continued for St. Thomas.
A tenth of an inch (0.09 inch) was reported by a volunteer observer on St. John. This brings the monthly total to 0.35 inch through July 16. July data were not yet available for the East End station on St. John, but the SPI for the previous 3 months and 12-month time scales was at D0 levels, the SPI was at D1 levels for the 6-month time scale, and at D2 levels for the 9-month time scale. D0-L continued on St. John for this week, but D1-SL may be considered in the weeks ahead if the dry conditions continue.
Looking Ahead
Heat and high humidity levels will dominate the central and eastern U.S. through week’s end, except on the northern Plains. By early next week, however, markedly cooler, drier air will arrive across the Plains and Midwest. Meanwhile, the post-tropical remnants of Hurricane Barry will spark showers in the East through Thursday, while scattered showers and thunderstorms will affect parts of the nation’s northern tier. Five-day rainfall totals could reach 2 to 4 inches in the upper Midwest and locally 1 to 3 inches east of the Mississippi River. In contrast, dry weather will prevail in the south-central U.S. and from California to the Intermountain West.
The NWS 6- to 10-day outlook for July 23 – 27 calls for the likelihood of below-normal temperatures from the central and southern Plains to the Atlantic Seaboard, excluding southern Florida, while hotter-than-normal conditions will dominate the West and the northern High Plains. Meanwhile, below-normal rainfall in the Midwest and along the northern Pacific Coast should contrast with wetter-than-normal weather along the Atlantic Coast, in the Deep South, and across the Intermountain West.
Now we show the week to week change information by region. The yellow is where the drought has been upgraded. The green is where the level of drought has been downgraded.
 |
Improvement in North Dakota |
 |
| Improvement in Minnesota and Michigan |
 |
| Deterioration in Connecticut and Massachusetts. |
 |
| Deterioration in South Texas, Improvement farther east. |
 |
| Mixed. But on balance slight improvement. |
 |
Some deterioration in Eastern Oregon. |
Some may find this way of looking at things useful and I hope these graphics are not too small to read. I did not make them so you could click on them individually but you can click on the whole graphic and it may enlarge. But I think you get the picture. It has been a rapid onset and demise. When you read these graphics, remember that the older graphics are not the drought conditions that existed then but the change from then until now.

Floods remain a concern.

https://econintersect.com/images/2019/07/15950233MapoffloodandHighWaterJuly192019.JPG
| Last Week | Current Week |
|
|

Let’s see if this animation works.

Active Major Fires

It is mostly about Alaska.
Soil Conditions and Crop Reports
Last week

This Week

Side by Side
|
|


| Crop | Crop Progress | Crop Condition |
| Corn | Very Slow (Silking) | Bad |
| Soybeans | Slow (Emerged and Blooming) | Very Bad |
| Winter Wheat | Very Slow (Harvested) | Great (assumed) |
| Spring Wheat | Very Slow (Headed) | OK |
| Cotton | Slow (Squaring and Setting Bolls) | Very Good |
| Sorghum | Slow (Headed and Coloring) | Very Good) |
| Rice | Slow (Headed) | OK |
| Oats | Slow (Headed) | Slightly Bad |
| Barley | Very Slow (Headed) | Bad |
| Peanuts | Ok(Pegging) | OK |
International

A map helps and is not always available and fortunately, it was available this week.

Major Sources of Information
In the box are shown the major resources we use. We will not be using them all each week but the reader is welcome to refer to these resources. .
Major Sources of Information Used in this Weekly Report
|
Background Information


The sequence of drought occurrence and impacts for commonly accepted drought types. All droughts originate from a deficiency of precipitation or meteorological drought but other types of drought and impacts cascade from this deficiency. (Source: NDMC)
Source: National Drought Mitigation Center, University of Nebraska-Lincoln


