Written by Sig Silber
Tonight we continue to try to improve our new approach for shedding light on the crop situation. We begin the discussion of the impact of temperature on the U.S. economy. We also revisit the CONUS June, 2019 weather to see what we might learn. Of course, we provide full coverage of the U.S. Drought Monitor and also provide a short summary of International weather and crop conditions.

Please share this article – Go to the very top of the page, right-hand side, for social media buttons. Please feel free to send this article to anyone who you think might benefit from reading it.
New Format: Each week our Thursday night article will cover the Drought Monitor Report issued by NOAA in conjunction with the University of Nebraska – Lincoln and a summary of U.S. crop conditions. It provides a link to the Severe Weather Report (this will take two clicks since that report gets republished each day and so you click here to get to the Directory and then click again on the version of the Severe Weather Report closest to the top of the list. Soon we will have a link to a full weather report, not just severe weather. Each week, but not today, this article will have a different special feature. We have not worked that out yet but most likely those features might be: A. a more detailed look at the prior month’s crop progress B. a review of the prior month’s weather (A feature this week) C. a review of the prior month’s International Weather D. Current conditions of rivers and reservoirs. E. Economic Impacts other than crop-related F. Other. (Impact of Temperature on the Economy is a feature this week) The goal is to reduce the time needed to read the article and provide information each week that changes each week and provide information that changes more slowly on a monthly basis. Please provide feedback by completing the survey below on how you feel about the new format and what would make this article more useful to you. |
First a News Note. It is the Second Thursday of the Month and the NOAA Court rules on ENSO.
EL NINO/SOUTHERN OSCILLATION (ENSO) DIAGNOSTIC DISCUSSION issued by CLIMATE PREDICTION CENTER/NCEP/NWS and the International Research Institute for Climate and Society 11 July 2019
ENSO Alert System Status: El Nino Advisory
Synopsis: A transition from El Nino to ENSO-neutral is expected in the next month or two, with ENSO-neutral most likely to continue through Northern Hemisphere fall and winter.
During June, El Nino was reflected in the continued presence of above average sea surface temperatures (SSTs) across the central equatorial Pacific Ocean. However, SST anomalies across most of the eastern Pacific decreased during the month. The latest weekly ENSO indices were +0.9 degC in Nino-4 and +0.6 degC in Nino-3.4, with smaller departures in the Nino-3 and Nino-1+2 regions. Upper-ocean subsurface temperatures (averaged across 180 deg-100 degW) were above average at the beginning of June, but returned to near average by end of the month, as anomalously cool waters expanded at depth. Weakly suppressed tropical convection continued over Indonesia, while weakly enhanced convection persisted near the Date Line. Low-level wind anomalies were near average over the tropical Pacific Ocean, and upper-level wind anomalies were westerly over the far eastern Pacific. The traditional and equatorial Southern Oscillation Indices were slightly negative. Overall, oceanic and atmospheric conditions were consistent with a weakening El Nino.
The latest plume of North American Multi-model Ensemble forecasts of the Nino-3.4 index shows a rapid transition toward ENSO-neutral by the late Northern Hemisphere summer, remaining neutral through fall and winter. Due to this model guidance and recent observations, the forecast consensus also favors a transition to ENSO-neutral during the next few months. In summary, a transition from El Nino to ENSO-neutral is expected in the next month or two, with ENSO-neutral most likely to continue through Northern Hemisphere fall and winter (click CPC/IRI consensus forecast for the chance of each outcome for each 3-month period).
This discussion is a consolidated effort of the National Oceanic and Atmospheric Administration (NOAA), NOAA’s National Weather Service, and their funded institutions. Oceanic and atmospheric conditions are updated weekly on the Climate Prediction Center web site (El Nino/La Nina Current Conditions and Expert Discussions). Forecasts are also updated monthly in the Forecast Forum of CPCs Climate Diagnostics Bulletin. Additional perspectives and analysis are also available in an ENSO blog. The next ENSO Diagnostics Discussion is scheduled for 8 August 2019.
Let’s Review June
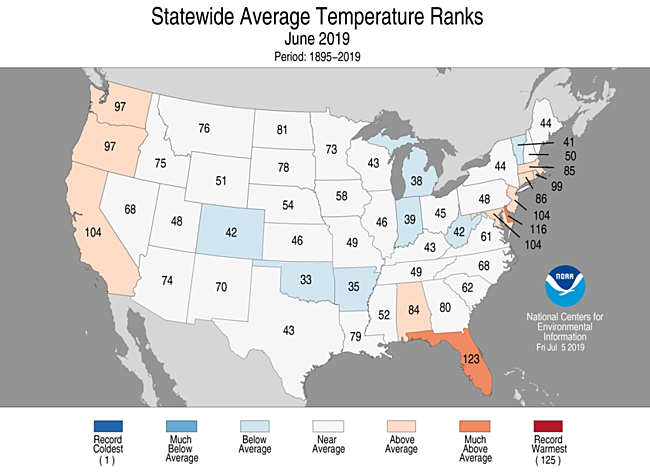


This provides a higher resolution way of looking at the data. It shows the data by Climate Division within each state.
IMPACTS
Temperature is harder so let’s work on that. The following article is interesting.
The Impact of Higher Temperatures on Economic Growth By Riccardo Colacito, Bridget Hoffmann, Toan Phan, and Tim Sablik
I am not endorsing this report issued by these Authors who did research on this topic for the Federal Reserve of Richmond. I am just providing it. And as they say: “Views expressed in this article are those of the authors and not necessarily those of the Federal Reserve Bank of Richmond or the Federal Reserve System.”
Here is one of the key graphics.

One should read the full article but not everyone has the time to do so. Therefore I have extracted what I consider to be the most important statements in the article and they follow.
Highlighting the importance of these seasonal and regional variations, Colacito, Hoffmann, and Phan find no statistically significant relationship between temperature and economic growth when look-ing across the whole United States. But measuring the impact of temperature in different seasons and across individual states yields different results.
Colacito, Hoffmann, and Phan find that temperature increases in the summer are associated with a decline in gross state product (GSP), which is the value added in production by the labor and capital of all industries in a given state. On average, each 1 ÌŠF increase in the mean summer temperature reduces the annual GSP growth rate by 0.154 percentage points.
As theory would suggest, Colacito, Hoffmann, and Phan also find that higher temperatures during the colder fall months have a positive effect on growth. On average, each 1 ÌŠF increase in the mean fall tem-perature increases the annual GSP growth rate by 0.102 percentage points. This finding is smaller and less statistically robust than their finding for the summer effect, but it may help explain why temperature changes do not appear to have a significant effect on growth when averaged across the whole year and across the whole country: the effects in the summer and fall partly offset. The authors do not find any significant effects for temperature increases in the spring or winter.
Measuring the impact of temperature changes on states as opposed to the country as a whole also reveals significant variations. Colacito, Hoffmann, and Phan divide the country into four regions – North, South, Midwest, and West – using classifications from the U.S. Census Bureau. Average temperatures are highest in the South, and the authors find that the economies of southern states are the most sensitive to changes in summer and fall temperatures. Further investigation shows that this effect is not driven by a larger role of agriculture in southern states. In fact, the authors find that the economic effects of temperature are widespread across a variety of industries.
This raises a number of questions including:
- When GDP is reduced is it lost or deferred?
- Can the analysis be interpreted in the reverse i.e. are the impacts of cooler temperatures the opposite of the impact of the warmer temperatures.
The authors go on to attempt to estimate the long-term impacts. You can read that in the paper. I do not follow the logic that losses are necessarily cumulative. The authors also urge caution in interpreting their estimates for the long-term impacts.
Present Drought Conditions
The U.S. Drought Monitor is a comprehensive way of understanding the drought situation for the U.S. It is issued every Thursday and reflects the conditions as of the prior Tuesday. Drought is defined as a moisture deficit bad enough to have social, environmental or economic effects. Thus, more factors than recent precipitation are considered and more information on how it is done is found at the end of this report.

U.S. Affiliated Pacific Islands and the U.S. Virgin Islands.

Below is the map for just CONUS.
 |
 |
| Last Week | This Week |
| |

Some might find this animation of twelve weeks of change useful;

The graphic below shows the one-week change in drought intensity. Yellow is bad. Green is good.
|

Here is the Discussion that was issued with the Drought Report.
A broken, highly-variable rainfall pattern predominated across the Country. Most areas where conditions are often dry during the summer followed this pattern, with little or no precipitation falling across the Far West and the northern Intermountain West. Other areas receiving subnormal precipitation – generally only a few tenths of an inch – included north-central North Dakota, most of northeastern Minnesota, part of the Upper Peninsula of Michigan and adjacent Wisconsin, central and southern Texas, and many areas across Louisiana and Mississippi. Farther east, rainfall was highly variable across the Southeast from Alabama through the Carolinas. Most of this area recorded at least a few tenths of an inch of rain, and roughly half received at least an inch. The heaviest amounts (2 to locally 6 inches) were concentrated along the Georgia/Florida border and the coastal Carolinas while totals on the low side were somewhat more common in south-central and northeastern Alabama, northwestern and east-central Georgia, upstate South Carolina, and a stripe across interior western North Carolina.
Northeast
Somewhat below-normal precipitation was observed across interior southern New England and a few other nearby areas for roughly the past 2 months, but an extended period of surplus precipitation preceded this, and no dryness or drought was discerned in the region.
Southeast
Not surprisingly, the highly variable rainfall pattern led to deterioration in some areas and improvement in others, amounting to regional adjustments (as opposed to broad-scale changes) in the areas identified in dryness and drought. Moderate to severe drought expanded westward in southern Alabama, and moderate drought coverage also increased in central Alabama. Meanwhile, abnormal dryness was expanded in northeast Alabama and adjacent sections of Georgia and Tennessee, and through much of the central Carolinas. D0 and D1 coverage was reduced in parts of the eastern Carolinas, southern and eastern Georgia, and northern Florida. The analysis was primarily based on rainfall deficits in the 60- to 120-day time frame.
South
Similar to the Southeast Region, a variable rainfall pattern led essentially to regional adjustments. Dryness and drought in upper South Texas improved, but conditions persisted or worsened slightly off to the south and west. Patchy abnormal dryness was again assessed farther north in Texas, with some adjustments from the previous week resulting in approximately the same amount of coverage. Abnormal dryness was contracted from part of interior western Tennessee, but expanded farther east in southeastern Tennessee and adjacent parts of Georgia and Alabama.
Midwest
Up to 2 inches of rain in much of northwestern Minnesota ended abnormal dryness there, but D0 persisted along the rest of the state’s northern tier. To the east, abnormal dryness was introduced in much of the central and western Michigan Upper Peninsula and north-central Wisconsin, where most areas received 40 to 70 percent of normal rainfall during the past month and mild deficits date back 60 and 75 days. Some short-term rainfall deficits have begun to show up farther south, particularly in several areas from Iowa through northern Indiana, but given long-term precipitation surpluses, no D0 introduction seemed warranted at this time.
High Plains
Little or no rain fell on north-central North Dakota, and moderate to heavy amounts (isolated totals of 1.5 to 2.0 inches) were generally restricted to the fringes of the abnormally dry region. Conditions remained essentially unchanged, though there was some limited southwestern expansion of moderate drought. Subnormal short-term rainfall has been observed in a few areas across central and western Kansas and eastern portions of Nebraska, but D0 introduction was not yet warranted.
West
Light precipitation dampened western Montana, and little or none was observed farther west. As a result, conditions remained unchanged or deteriorated. Abnormal dryness expanded into parts of west-central and southwestern Montana, and adjacent portions of eastern Idaho. Abnormal dryness was also extended southward in eastern Washington, and brought into more of central and southern Oregon, particularly near the southwest coast. The continued slow drying trend also prompted some southeastward D1 expansion in central and northern Oregon, plus a small northward push of extreme drought in northwestern Washington.
Alaska, Hawaii, and Puerto Rico
Exceptionally hot and dry weather across interior Alaska for roughly the past month has dried out surface moisture and created ideal conditions for the rapid development and spread of wildfires. D0 was broadly expanded to cover most of the state outside the western and northern tiers, and some moderate drought was introduced in part of the Yukon Flats, with the most extreme fire danger noted in this general area. Outside the climatologically-wetter areas of southern and southeastern Alaska, 3-month precipitation totals generally range from 2 to 4 inches, though only 0.5 to 2.0 inches fell on Yukon Flats. Over 300,000 acres were scorched across Alaska during Sunday & Monday, bringing the year-to-date total to about 1.1 million acres, a total area 40 percent larger than the state of Rhode Island. Anchorage, AK reached 90 degF for the first time in recorded history in early July, and highs climbed into the upper 90’s in part of the interior. Many locations had to cancel Fourth-of-July fireworks, including many sites in and around Anchorage. Farther southeast, fire danger is low in the temperature rainforests of the southeast Alaska Panhandle, but a protracted stretch of subnormal precipitation – dating back multiple years at many locations– has led to problems generating hydroelectric power plus growing water supply concerns in some areas, including some in and near the cities of Juneau, Wrangell, and Haines. Ketchikan, in the southern Panhandle, has accumulated a precipitation deficit of over 50 inches through the past three years.
In Puerto Rico, 0.5 to 2.0 inches fell on central parts of the Commonwealth while only a few tenths of an inch were measured near the southwestern coastline and in north-central areas. This led to an increase in severe drought coverage from central to southwestern Puerto Rico, where 60-day rainfall totaled about half of normal at best. Farther north, some northward expansion of D1 occurred in central Puerto Rico, and abnormal dryness was introduced in north-central parts of the Island.
A few inches of rain improved dry conditions on parts of the central and eastern Big Island, but increasing reports of poor pastureland and dried-out vegetation and crops led to the introduction of moderate drought across northern sections of the Big Island, with drought severities remaining intact elsewhere.
Pacific Islands
A dry trade-wind regime dominated the weather pattern during this USDM week (7/03/19-7/09/19) across northern portions of Micronesia while areas of convection associated with various features of the Inter-Tropical Convergence Zone (ITCZ) brought rain to southern parts. The ITCZ features included surface troughs, weak circulations, and converging winds. Upper-level troughs and lows were also present, with TUTT (Tropical Upper-Tropospheric Trough) cells in the north, and their associated upper-level divergence enhanced showers in some areas. Precipitation from the TUTTs in the north, especially over the Marianas, was limited due to the lack of deep layer moisture. South of the equator, a high pressure ridge generated strong trade winds across American Samoa and kept a surface trough, with its heavier convection, to the north and west of the islands during most of the week.
Satellite-based estimates of 7-day precipitation (QPE) showed a large area of 2+ inches of rain across southeastern portions of the Federated States of Micronesia (FSM), and some 2+ inch areas just west of Palau and Yap State, just east of the Republic of the Marshall Islands (RMI), and north of 10 degrees North latitude, with less than an inch of precipitation indicated between these areas. The northern rain areas were associated with upper-level troughs and lows, while the southern areas were caused by ITCZ convection. The southeastern FSM rain area extended south of the equator, southeastward toward the Samoan Islands. The QPE maps showed a sharp gradient of precipitation in the Samoan area, with 4+ inches over the western Samoan Islands to less than half an inch east and south of American Samoa.
After a wet week, dry conditions returned to Palau, receiving only 0.97 inch of rain this week. Since this is less than the weekly minimum of 2 inches, abnormally dry (D0-S) conditions continued to affect Palau this week.
Dry conditions were present this week in the Marianas, with two of the three stations analyzed receiving less than half their weekly minimum of 1 inch. The station with the least rain was Saipan, receiving only 0.23 inch of rain. Guam followed with a rainfall total of 0.28 inch. Rota had the most rainfall at 0.95 inch of rain for the week. All three stations continued to be in extreme drought (D3-S).
Six (Chuuk, Pohnpei, Kosrae, Nukuoro, Lukunoch, and Pingelap) of 11 stations analyzed had precipitation totals that equaled or surpassed the 2 inch minimum threshold to meet most water needs. The station with the most precipitation was Nukuoro at 4.46 inches of rain for the week. Chuuk, Pohnpei, Kosrae, Nukuoro, Lukunoch, and Pingelap continued to be drought free (D-Nothing) this week.
However, Yap, Fananu, Kapingamarangi, and Woleai had a dry week. The station with the least precipitation was Fananu (0.15 inch; with 1 day of missing data). Although Fananu had 8 inches of rain for the month of June, the last two weeks have been extremely dry, with less than half of an inch of rain for the two weeks combined. For this reason moderate drought (D1-S) persists once again this week. This week Yap’s precipitation total of 1.88 inches was only 0.12 inch shy of reaching its 2 inches weekly minimum, helping maintain its drought classification of abnormally dry (D0-S). Kapingamarangi and Woleai remained drought free (D-Nothing) since this week marks the first or second consecutive week of dry conditions for these locations.
No data was available for Ulithi and thus was set to missing.
All of the stations analyzed in the Marshall Islands had little rain during the week, with Wotje reporting no rain. Jaluit and Ailinglapalap were the other two stations with the least precipitation totals at 0.20 inch and 0.30 inch, respectively. Jaluit’s drought classification of moderate drought (D1-S) continued this week as dry conditions affected the area since April 2019. Since this was Ailinglapalap and Mili’s first or second consecutive dry week and the month of June surpassed the 8-inches threshold to meet most water needs, drought free (D-Nothing) conditions persisted for both locations.
Kwajalein had a total of 0.85 inch of rain for the week, which is 1.15 inches of rain less than the weekly minimum of 2 inches. As dry conditions continued, Kwajalein remained in moderate drought (D1-S). The last two weeks have been very dry in Majuro, with precipitation totals less than 1 inch of rain and reservoir levels dropping. As of July 3, reservoir levels were at 77% of the maximum capacity of 36 million gallons and below the critical 80% threshold. Abnormally dry (D0-S) drought classification was unchanged this week.
Exceptional drought (D4-SL) continued to affect Wotje and Utirik since dry conditions have persisted since the end of 2018.
Pago Pago had its third consecutive dry week, with precipitation totals less than 1 inch and the month of June had less than 8 inches required to meet most water needs. For this reason, abnormal dryness (D0-S) was introduced to Pago Pago.
Virgin Islands
During this drought week, only 0.06 inch and 0.08 inch of rain fell at Cyril E. King Airport and Henry Rohlsen Airport, respectively. These values are also the month-to-date (July 1-9) values, which is 9.4 of normal for St. Thomas and 14.3% of normal for St. Croix. Meanwhile, the year-to-date precipitation totals were 63.4% of normal for St. Thomas and 56.3% for St. Croix. The SPI values for the 6-month period ranges between -1.0 to -1.5 for both stations, which is consistent with severe drought conditions (D2-S). The 9 and 12-month SPI were also -1.0 to -1.5 for St. Thomas, while it was -1.5 to -2.0 for St. Croix, which is consistent with severe to extreme drought. Given the low precipitation totals and the SPI values drought classification for both stations were downgraded to severe drought (D2-S). After a wet June (159.1% of normal), the month of July had a dry start at St. John. For this drought week ending on July 9, 2019, St. John received only 0.24 inch of rain and only 0.25 inch for the month-to-date, according to data provided by a volunteer observer. St. John remained in abnormally dry (D0-S) conditions.
Looking Ahead
During the next 5 days (July 11 – 15, 2019) a developing tropical system in the Gulf of Mexico is forecast to spread heavy rain from the lower Mississippi Valley eastward through northern and western Georgia, where totals exceeding 1.5 inch should be widespread. Between 7 and 15 inches of rain are forecast for the southeastern half of Louisiana, and 3 to 7 inches are anticipated through most of the rest of Louisiana, the southern half of Mississippi, and the southwestern quarter of Alabama. In other areas of drought, the precipitation pattern isn’t expected to bring any dramatic relief. Moderate rains of 0.5 to 1.0 inch are expected in central and eastern Tennessee, central and eastern Georgia, parts of the Carolinas, the most orographically-favored areas in northwestern Washington, and northwestern Minnesota. Only a few tenths of an inch at best are forecast in other areas of dryness and drought across the contiguous states. Meanwhile, abnormally high temperatures [daytime highs averaging 3 degF to 7 degF above normal] are expected in the central High Plains and the Intermountain West, and cooler than normal conditions – at least partially in association with heavy rains from the developing tropical system – should occur from the southeastern Great Plains eastward through the lower half of the Mississippi Valley into much of Alabama and Tennessee.
The CPC 6-10 day outlook (July 16-20, 2019) favors wetter-than-normal weather in the Mississippi Valley, upper Southeast, the northern Plains, the Northwest, and the eastern two-thirds of Alaska. Odds favor less rain than normal in central and western Texas, the immediate Southeast coastline, and northern Florida. Enhanced chances for above-normal temperatures cover Alaska and most of the Nation from the Rockies eastward. Only in the Northwest do odds slightly favor below-normal temperatures.
Now we show the week to week change information by region. The yellow is where the drought has been upgraded. The green is where the level of drought has been downgraded.
 |
Not much change. |
 |
| Impovement in Minnesota, Deterioration in Wisconsin |
 |
| No Change |
 |
| Mixed but no major changes |
 |
| Mixed. In general, it was wetter along the coast and drier inland. |
 |
This was the only region where the pattern was clear: namely deterioration in the Northwest. |
Some may find this way of looking at things useful and I hope these graphics are not too small to read. I did not make them so you could click on them individually but you can click on the whole graphic and it may enlarge. But I think you get the picture. It has been a rapid onset and demise. When you read these graphics, remember that the older graphics are not the drought conditions that existed then but the change from then until now.

Floods remain a concern.

| Last Week | Current Week |
|
|

Let’s see if this animation works.


Active Major Fires

It is mostly about Alaska.
Soil Conditions and Crop Reports
Last week

This Week

Side by Side
| |

| Crop | Crop Progress | Crop Condition |
| Corn | Slow (Silking) | Bad |
| Soybeans | Slow (Emerged and Blooming) | Bad |
| Winter Wheat | Very Slow (Harvested) | Great |
| Spring Wheat | Very Slow (Headed) | OK |
| Cotton | Slow (Squaring and Setting Bolls) | Good |
| Sorghum | Slightly Slow (Headed and Coloring) | Very Good) |
| Rice | Slow (Headed) | Slightly Bad |
| Oats | Very Slow (Headed) | Bad |
| Barley | Very Slow (Headed) | OK |
| Peanuts | Slightly Good (Pegging) | OK |
International

A map helps and is not always available and fortunately, it was available this week.

Major Sources of Information
In the box are shown the major resources we use. We will not be using them all each week but the reader is welcome to refer to these resources. .
Major Sources of Information Used in this Weekly Report
|
Background Information


The sequence of drought occurrence and impacts for commonly accepted drought types. All droughts originate from a deficiency of precipitation or meteorological drought but other types of drought and impacts cascade from this deficiency. (Source: NDMC)
Source: National Drought Mitigation Center, University of Nebraska-Lincoln


