
Written by Sig Silber
U.S. and World Agriculture: Plus an Expanded Weather Forecast Section
The crop situation is confusing but appears to be improving. Corn, soybeans, oats, barley, and Spring Wheat remain of most concern. But it is difficult to differentiate between delays and ultimately reduced harvests. Tonight, we focus a bit on the Pacific Northwest.

Please share this article – Go to the very top of the page, right-hand side, for social media buttons. Please feel free to send this article to anyone who you think might benefit from reading it. This edition is particularly important because of the economic implications and the guidelines for thinking about what these implications might be.
Today is June 30, 2019 If you are reading this article later than this date, there may or may not be a later version which you can access by clicking here and selecting the latest version of this article from the top of the Directory and clicking on that. Many of the graphics in this article will update continually. So many but not all of the graphics continue to update but the latest version of the article has my updated commentary and updated NOAA discussions when we update those which may be done on the day after the article is first published or later in the week depending on how fast conditions are changing. So if you have an older version, e.g. from an email you received yesterday, the graphics that auto-update are always current but if you want to be sure you have the most current discussions, click here and then click again to go to the most recently published version. It is our goal to provide the most current information and discussion practical. You do not need the most up-to-date version to have the most up-to-date forecast as that updates automatically but if you are interested in my comments or the NOAA discussion the text in this article is updated manually if we republish the article to keep it as current as possible. I hope this explanation is not too confusing.
It is important to understand that the impact of weather on economic activity varies from one place to another. In this article, we try to provide a broad view of the impacts focusing mostly on the U.S. but also to a lesser extent on the Rest of the World. |
Major Sources of Information Used in this Weekly Report
|
1. Special Reports and Highlights.
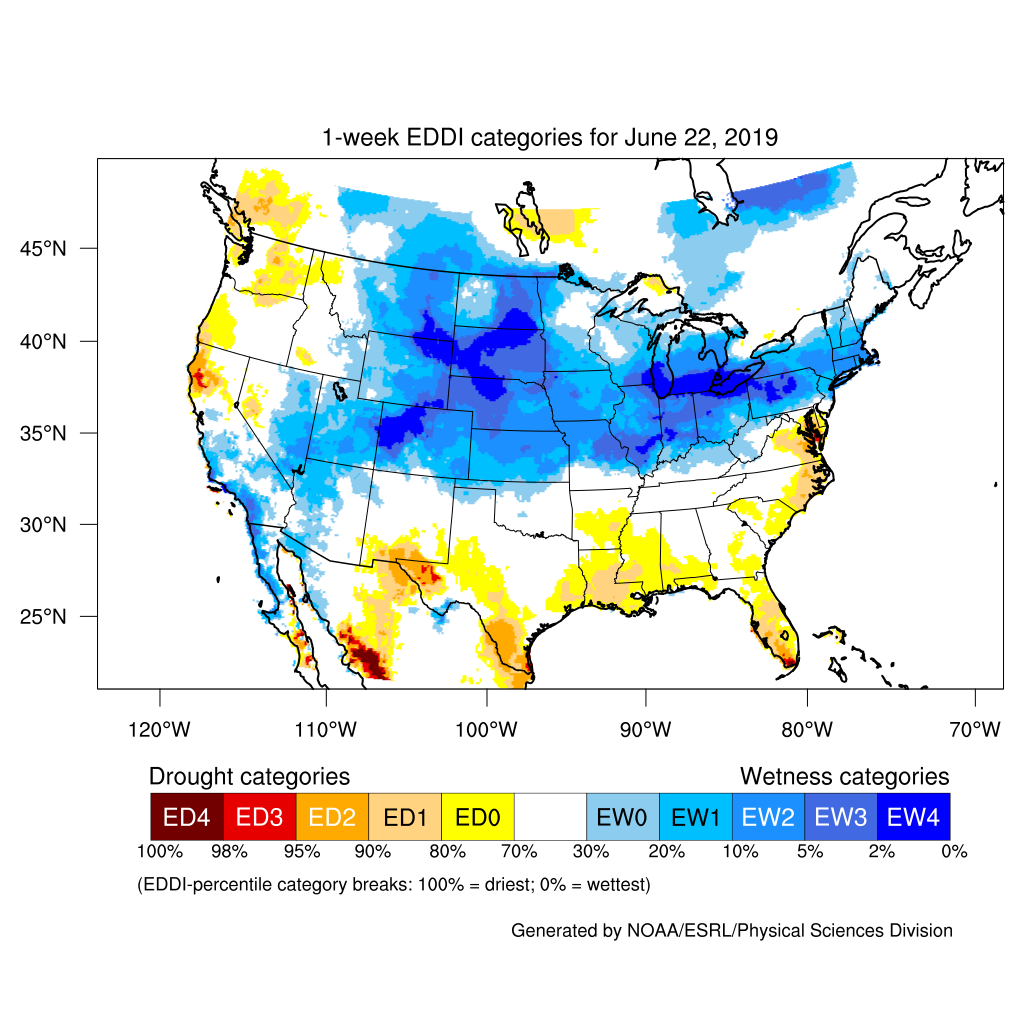
It is still wet. From the Drought Monitor Discussion
Excessively wet conditions persist across the middle Mississippi Valley, Ohio Valley, and much of the Corn Belt, with precipitation averaging 150 to 200 percent of normal dating back 180 days. According to the National Centers for Environmental Information, the meteorological spring of 2019 ranked in the top-ten for wetness in the following states: Illinois, Indiana, Iowa, Missouri, and Wisconsin. Due to the wet winter and spring, soil moisture remains above the 99th percentile across much of the Corn Belt.
According to the National Centers for Environmental Information, Kansas had its wettest meteorological spring (March to May 2019) on record.
Focus on the Northwest
To some extent, Alaska is part of the Northwest due to the current weather pattern.

Now to extract from the Pacific Northwest Drought Seminar this week.


Water Year Precipitation

And it has been warm and dry the last 60 Days.

Why? We look at the Jet Stream which for many purposes can be located at 300 mb.


 there i
Concusions.
- The Pacific Northwest is an area that is at risk for continuing with drought conditions and perhaps getting worse.
- But there is no guaranteee that this will work out that way.
- It may be wetter in that area heading into July.
South Asia Monsoon as it impacts India.

Flooding.

| Last Week | Current Week |
|
|

Agriculture Field Work
| Last Week | This Week |
|  |

2. Summary of Intermediate-Term Weather Forecast (helpful to predict drought and floods etc)
Here is the summary of the forecast for the next approximately twenty-five days. We provide this so that we can make our own assessment of the drought forecast. Here I provide the weather forecasts for different periods of time in which should allow the reader to assess the likelihood of this forecast working out as shown over the next three to four weeks. Since we publish this week on Thursday, we generally update the discussion for the Week 3 – 4 forecast when it is updated on Friday. This is important as the current Day 6 – 14 forecasts and the week-old week 3 – 4 forecast overlap to some extent.
Later we provide additional information relative to the weather forecast analysis but here is the summary.
First Temperature
|
|
|
|
The graphic above shows magnitude rather than the probability of being higher or lower than Normal and shows the middle day of the five day period. | Stagnant but deamplifying. Remember for this purpose, what NOAA calls Week – 1 is Days 6 -10 and Week – 2 is days 8 – 14. The transition from the 8 – 14 day forecast shown above to the week 3/4 forecast does not seem feasible. The week 3-4 graphic will be updated on June 28, 2019. We will then update our commentary. | ||


And then Precipitation
|
|
| |
The five-day QPF is shown above. The units are different than the other maps i.e. in units of precipitation (inches) not probabilities of exceeding or being less than climatology. | Again fairly stagnant but perhaps with some east and northeast movement and also deamplifying. The transition from the 8 -14 day forecast shown above to the week 3/4 forecast now seems feasible. The week 3-4 graphic will be updated on June 28, 2019. We will then update our commentary. | ||


3. Present Drought Conditions
The U.S. Drought Monitor is a comprehensive way of understanding the drought situation for the U.S. It is issued every Thursday and reflects the conditions as of the prior Tuesday. Drought is defined as a moisture deficit bad enough to have social, environmental or economic effects. Thus, more factors than recent precipitation are considered and more information on how it is done is found at the end of this report.

U.S. Affiliated Pacific Islands and the U.S. Virgin Islands.

Below is the map for just CONUS and with statistics and below that map I have provided a cut-out of the statistics which I think you can click on to enlarge. When you click on graphics that I have set up to enlarge, if that does not work, often if you right click with your mouse and then click on “view image” that will work.
 |
 |
| Last Week | This Week |
| |

The graphic below shows the one-week change in drought intensity. Yellow is bad. Green is good.
|

Now we show the week to week change information by region. The yellow is where the drought has been upgraded. The green is where the level of drought has been downgraded.
 |
Improvement in North Dakota. |
 |
| No Change |
 |
| No Change |
 |
Mixed in Texas with deteriorationin the the New Orleans area and improvement in Tennesseee. |
 |
| Mixed to the west and improvement to the east. |
 |
Deterioration in Northern Idaho west and east of the Idaho Panhandle with Improvement in Northeast Montana and part of the Four Corners in New Mexico. |
Some may find this way of looking at things useful and I hope these graphics are not too small to read. I did not make them so you could click on them individually but you can click on the whole graphic and it may enlarge. But I think you get the picture. It has been a rapid onset and demise. When you read these graphics, remember that the older graphics are not the drought conditions that existed then but the change from then until now.

Some might find this animation of twelve weeks of change useful;

Here is the discussion which was issued with the Drought Monitor today.
This Week’s Drought Summary
Multiple cold fronts progressed across the central and eastern U.S. during mid to late June with widespread showers and thundershowers from the Great Plains east to the East Coast. During the past week (June 18 to 24), heavy rainfall (2 to 6 inches) maintained excessively wet conditions across eastern portions of the Great Plains, middle Mississippi Valley, and Ohio Valley. Diurnal convection resulted in locally heavy rainfall (more than 2 inches) from the Florida Panhandle south to the central Florida Peninsula. An unseasonably strong low pressure system resulted in accumulating snow to the northern and central Rockies on the first full day of the summer. More than a foot of snow was observed at elevations above 9,000 feet in the Colorado Rockies. During mid to late June, cooler-than-normal temperatures persisted throughout the western and central Corn Belt. Above average rainfall has occurred throughout a majority of the central and eastern U.S. during the past 30 days, with below average rainfall limited to scattered areas of the Southeast, south Texas, the northern Great Plains, upper Mississippi Valley, and Pacific Northwest.
Northeast
Occasional showers and thundershowers accompanied frontal passages across the Northeast during the past couple of weeks, maintaining normal to above normal stream flows and soil moisture above the 70th percentile. During the past 30 days, rainfall has averaged more than 4 inches above normal across parts of the central Appalachians and northern mid-Atlantic. Although parts of New England have been slightly drier-than-normal recently, a lack of abnormal heat has limited evapotranspiration rates for this time of year. The Northeast has remained drought-free since November 2018.
Southeast
Drought amelioration continued across the Coastal Plain of Georgia and South Carolina with 2-week rainfall amounts of more than 3 inches observed at many locations. This recent rainfall and 28-day stream flows close to average support the improving conditions. However, abnormal dryness (D0) continues across parts of the Piedmont of South Carolina where rainfall has been erratic during the past two months. The abnormal dryness (D0) coverage generally coincides with where 60-day precipitation deficits exist. Moderate to severe drought (D1-D2) continues across the Pee Dee region of South Carolina, southeast North Carolina, and Alabama and Georgia which largely missed the beneficial rainfall. Low 28-day stream flows are currently observed along the Satilla, Suwannee, and St. Mary’s Rivers in southeast Georgia. Severe drought was maintained in southeast Alabama since the 28-day stream flows along the Choctawhatchee River near Newton, Alabama remains below the 10th percentile. The year-to-date precipitation deficit at Dothan, Alabama is 11.50 inches, as of June 25. The coverage of abnormal dryness (D0) was extended west towards Mobile Bay due to insufficient rainfall and recent heat. The abnormal dryness (D0) and moderate drought (D1) areas extend slightly south into the Florida Panhandle and northeast Florida, although the southward extent has decreased the past two weeks. As of June 25, the year-to-date precipitation deficit at Tallahassee, Florida is 11.67 inches.
South
Frequent thunderstorms resulted in widespread, heavy rainfall (2 to 4 inches, locally more) throughout the Tennessee Valley during the past week (June 18 to 24). Due to the recent heavy rainfall, the coverage of abnormal dryness (D0) was reduced across Tennessee and northern Alabama. In addition to the heavy rainfall, numerous severe weather reports (mostly wind damage) were recorded on June 19 and 21. The Vegetative Health Index (VHI) reflects moist conditions throughout much of the region. According to the Oklahoma Mesonet network, the northeast quarter of Oklahoma has received 20 to 33 inches of rainfall during the past 60 days. Increasing 30 to 60-day precipitation deficits along with slightly above normal temperatures since mid-June led to the addition of abnormal dryness (D0) to Lafourche and Terrebonne Parishes in southeast Louisiana. Heavy rainfall (localized max of 10 inches) eliminated abnormal dryness in parts of southern Texas. However, the core drought areas in the Rio Grande Valley missed this recent rainfall thus leading to a slight increase in D1 (moderate drought) and the addition of D2 (severe drought) in Duval County.
Midwest
Excessively wet conditions persist across the middle Mississippi Valley, Ohio Valley, and much of the Corn Belt, with precipitation averaging 150 to 200 percent of normal dating back 180 days. According to the National Centers for Environmental Information, the meteorological spring of 2019 ranked in the top-ten for wetness in the following states: Illinois, Indiana, Iowa, Missouri, and Wisconsin. Due to the wet winter and spring, soil moisture remains above the 99th percentile across much of the Corn Belt. According to the USDA Weekly Weather and Crop Bulletin (valid on June 23), corn emergence was behind average by 20 percentage points or more in Michigan and Ohio. Only 67 percent of the soybeans in Illinois had emerged by June 23 which is 26 percentage points behind average. Moderate flooding continues along the middle Mississippi River. Farther to the north, abnormal dryness (D0) was depicted for parts of northern Minnesota due to an increasing short-term precipitation deficit.
High Plains
An increase in rainfall (1.5 to 3 inches) this past week (June 18 to 24) resulted in a slight reduction of D1 to D2 (moderate to severe drought) across North Dakota. In addition, 7-day maximum temperatures averaged 4 to 8 degrees F below normal throughout the northern Great Plains. Maximum temperatures remained below 80 degrees F from June 15 to 24 at Minot, North Dakota. Large variations in soil moisture continue with excessively wet conditions (above the 99th percentile) across Kansas, Nebraska, and South Dakota, while soil moisture falls below the 20th percentile across northern North Dakota. According to the National Centers for Environmental Information, Kansas had its wettest meteorological spring (March to May 2019) on record.
West
Following a dry spring across northeast Montana, more frequent rainfall occurred this past week (June 18 to 24) with 7-day rainfall amounts mostly above 2 inches. Due to this wet week and increase in topsoil moisture, an elimination of moderate drought (D1) was warranted. Moderate drought (D1) was expanded south across northern Idaho due to increasing 30 to 90-day precipitation deficits. Since 28-day stream flows have fallen below the 10th percentile, severe drought (D2) was introduced to parts of northern Idaho and adjacent areas of northwest Montana and northeast Washington. Also, 90-day SPI values generally support the expansion of moderate drought and addition of severe drought. Based on the Vegetative Health Index, the long-term drought (D1) area was reduced across western New Mexico. Following notable changes in the spatial extent and severity of drought conditions in the Pacific Northwest the previous week, no changes were necessary this week due in part to much cooler temperatures. Severe drought (D2) remains over parts of Washington which experienced its 13th driest March to May on record.
Alaska, Hawaii, and Puerto Rico
The southern Alaska Panhandle had its driest June 2018 through May 2019 period on record, which supports the ongoing extreme drought (D3). Although parts of drought-stricken areas of Alaska have received beneficial rainfall, long-term deficits persist. 28-day stream flows remain low along multiple rivers in the Alaska Panhandle and also along the Yukon River in eastern mainland Alaska. Although no changes were made to Hawaii this week, the Normalized Difference Vegetation Index) reflects slight improvement to the current D3 area depicted on the Big Island. On June 25, an unusual low pressure system for this time of year brought heavy rainfall to the western Hawaiian Islands, including a daily record of 4.20 inches at Honolulu. The effects of this heavy rainfall on the drought status in Hawaii will be reassessed next week. Suppressed rainfall persisted across much of Puerto Rico into late June. As of June 25, the year-to-date precipitation deficit at San Juan, Puerto Rico is 9.45 inches. After the previous week’s expansion of D0 and D1, no changes were made this week to the drought status for Puerto Rico.
Pacific Islands
The weather pattern during this USDM week (6/19/19-6/25/19) consisted of dry easterly trade winds across portions of northern Micronesia and Inter-Tropical Convergence Zone (ITCZ) convection across the southern and western portions, while upper-level lows north of Micronesia teased northern portions but didn’t deliver much rain. The ITCZ convection consisted of surface troughs, weak circulations/tropical disturbances, and (in the east) converging or surging trade winds. One circulation (Invest 94W) moved across Yap State early in the week, then turned northwest to move across Palau and into the Philippine Sea. Other circulations developed over central and eastern Micronesia and slowly moved westward later in the week. South of the equator, high pressure dominated the weather over American Samoa, keeping a surface trough just north of the Samoan Islands for much of the week. The trough eventually sank southward, bringing rain to American Samoa later in the week.
Satellite-based estimates of 7-day precipitation (QPE) for June 25 were not available, but the 7-day QPE for June 24 showed a large band of 2+ inches of rain across Palau and the Federated States of Micronesia (FSM), with patchy areas of 2+ inches of rain over the Republic of the Marshall Islands (RMI). Large areas of 4+ inches were embedded within the 2+ inch region over Palau and the FSM. Little to no rain was indicated across the Marianas or most of the northern RMI. An elongated band of 2+ inches of rain was indicated on the QPE north of the Samoan Islands, with little to no rain shown over American Samoa.
In the Marianas, Guam was wet this week (1.26 inches of rain). But the last 3 weeks were dry, June is still dry for the month, and the last 4 months have been dry, so D3-S continued for Guam. The week was dry (less than the 1-inch weekly minimum) at both Rota (0.82 inch) and Saipan (0.61 inch), so D3 continued. With each of the last 4 weeks dry, and June dry so far, short-term dryness returned to Saipan, giving it a status of D3-SL, while Rota continued at D3-S.
It was wet (more than the 2-inch weekly minimum needed to meet most water needs) at most stations in the FSM. On the wet side, rainfall reports ranged from 2.26 inches at Woleai (based on 3 days of data) to 9.92 inches at Pohnpei. On the dry side, Rumung reported 1.48 inches (with 3 days missing). This is the third consecutive wet week at Chuuk, and June so far is wet (12.04 inches). Woleai has been wet for the last 4 weeks, and has 16.14 inches for June so far. Yap (3.34 inches, with 2 days missing) and Fananu (3.03 inches with 1 day missing) were both wet this week and have nearly reached the monthly minimum for June. A 1-category improvement was made at Yap and Fananu (to D1-S), Chuuk (to D0-S), and Woleai (to D-Nothing). No data was received from Ulithi, so they were plotted as missing. D-Nothing continued at the remaining FSM stations.
In Palau, Koror had 2.05 inches of rain, which is barely at the 2-inch minimum. June has been wet (12.25 inches so far), but the status continued at D1-S to reflect the dryness of the previous 5 months.
In American Samoa, the last 2 weeks have been dry at Pago Pago, with 0.62 inch of rain recorded for the week and 5.54 inches so far for June. The automated station at Siufaga Ridge recorded 0.60 inch for the week and 4.32 inches so far in June, while the automated station at Toa Ridge recorded 0.41 inch for the week and 3.49 inches for June. But the previous 10+ months have been wet, so D-Nothing continued.
In the RMI, Jaluit and Utirik were dry this week, so their status remained unchanged. Kwajalein had 2.21 inches of rain, but the previous 3 weeks were dry and June so far was still dry (4.43 inches), so D1-S continued. Wotje had some much-needed rain, 2.77 inches (with 1 day missing). But the month was still dry (3.22 inches) and it’s been so dry for so long, the status remained unchanged at D4-SL. Mili’s 4.07 inches of rain this week continued wet conditions (D-Nothing). Majuro reported 5.05 inches of rain this week, which brought the monthly total for June over the 8-inch threshold. Both May and June were wet, and the rains have helped raise the reservoir level, with 30.95 million gallons in the Majuro reservoirs. This is 98.26% full (from an operational perspective) and 86% of maximum capacity. But water rationing is still in effect, with water days still at 3 times per week, now 4 hours each day for the whole island instead of sectioning to 3 parts of the island. D0-S was continued at Majuro to reflect the continued rationing of reservoir water. Ailinglapalap had 4.55 inches of rain, which brought the June total to 8.99 inches. With the last 2 weeks wet, and the last 2 months wet (above minimum thresholds), the USDM status at Ailinglapalap was improved to D-Nothing.
Virgin Islands
The weather pattern during this USDM week (6/19/19-6/25/19) was dominated by high pressure (North Atlantic High/Bermuda High) which generated a dry easterly trade-wind flow across the U.S. Virgin Islands (USVI), Saharan dust which enhanced dry hazy conditions, and an upper-level trough over the western Caribbean which enhanced precipitation over western Puerto Rico but not over the USVI. A weak tropical wave moved into the region at the end of the week, bringing increased low level moisture but limited showers to the USVI. Periods of moderate to heavy rains were reported across portions of the USVI, but Tuesday morning radar estimates showed the rains (0.5-2.0 inches) limited mostly to St. John Island with little to none falling over St. Croix or St. Thomas.
Only a trace of rain fell at the Henry Rohlsen Airport on St. Croix this week, leaving 0.16 inch for the month, which is 1.80 inches below normal or 8.2% of normal. Of the last 9 months, January and February 2019 had a lot of missing data, but not counting those months, 5 out of 7 were drier than normal. The year to date for 2019 is drier than normal at 57.0%. The Standardized Precipitation Index (SPI) is at D1-D3 levels for the last 6 to 12 months. With no substantial rain this week, and only 0.16 inch so far this month, the USDM status was changed from D0-L to D1-SL.
Only a trace of rain has fallen at Cyril E King Airport on St. Thomas this week, leaving 0.44 inch for the month, which is 1.66 inches below normal or 21.0% of normal. Seven of the last 9 months have been drier than normal. The year to date for 2019 is drier than normal at 67.0%. SPI is at D1-D2 levels for the last 3 to 12 months. With no significant rain this week and the month so dry, the status was worsened to D1-SL.
St. John was not analyzed this week due to the lack of precipitation data from the island.
Looking Ahead
During the next 5 days (June 27-July 1, 2019), an area of upper-level high pressure is likely to strengthen over the north-central U.S., resulting in a major warming trend across the Great Plains, Corn Belt, and Midwest. Maximum temperatures are forecast to peak in the middle 90s to near 100 (degrees F) across the central Plains and western Corn Belt. Due to the strengthening ridge aloft, the axis of heaviest rainfall (locally more than 1 inch) is expected to become focused from the northern Great Plains east to the upper Mississippi Valley and Great Lakes. An easterly wave of low pressure is forecast to shift west from the Gulf of Mexico and enhance scattered thundershowers with locally heavy rainfall across the western Gulf Coast. Scattered showers and below-normal temperatures are forecast across drought-stricken areas of the Pacific Northwest through June 28. Much above-normal temperatures along with below-average precipitation is forecast throughout much of Alaska. Ongoing heavy rainfall is expected to gradually ease across the western Hawaiian Islands. Below-average rainfall is likely to continue for Puerto Rico into the beginning of July.
The CPC 6-10 day outlook (July 2-6, 2019) favors above-normal temperatures across the north-central and eastern U.S. with the highest odds over the Southeast. Near to below-normal temperatures are most likely across the western U.S. Elevated chances for above-normal precipitation were forecast for much of the central and eastern U.S. although near to below-normal precipitation is favored across the Southeast. Increased chances for below-normal precipitation is forecast for the desert Southwest to begin July. A relatively warm and dry pattern is likely to persist across the Alaska Panhandle and southern mainland Alaska.
Western Water Situation
Here is part of the explanation for the overall situation in the West. Looking at the information from the network of SNOTEL sites. These are mainly in remote locations often at high elevations. they report by telecommunications hence their name.
First the last seven days.

Then we look at the Water Year.

Then we look at how much snow there is to melt when it is warmer.

Comparing this week to last week.
| Last Week | This Week |
|
|

Wildfires are becoming more of a problem as we move into summer.
Current Situation

Many of the large Incidents are in Alaska. Updates can be found here.
Now the forecasts


4. Recent Weather
Here is the SWE water content of the snow.
| Last Week | This Week |
|
|


Updates can be obtained here.
Last Seven Days
For reference purposes here is the precipitation information for the prior seven days. It is not the same as what is shown in the USDA Crop Report since the crop week covers the Sunday to Saturday period which corresponds to the crop reports. To avoid confusion, I have not included in this article the weather graphics that correspond to the crop week. But it is important to understand that the crop reports cut off on a Saturday, are reported on the following Tuesday, and the Drought Monitor is issued on Thursday so here are different lags for different sets of information presented.
Below is the current seven-day period and updates in this article automatically every day. It is a better tool for making forecasts.


Current Month to Date.

And then temperature

You can generate a wide variety of different graphics here.
5. Current Forecast for Precipitation and Drought.
Here is the June one-month drought forecast which was issued on May 31, 2019.

Here is the Seasonal Forecast through September 30, 2019 which was issued on June 20, 2019 with the full Seasonal Outlook.

These two forecasts are issued by the same agency but to obtain them you need to access two different links here and here. The three-month Seasonal Drought Outlook will be updated on May 16, 2019.
Additional Information Relative to the Intermediate-Term Forecast
We provided the summary approximately 25 Day Forecast earlier. Here is additional information that relates to this forecast.
First, the weather hazards forecast.


Additional information can be obtained here. We also now publish a Live Severe Weather article. The link to our Severe Weather Events article changes every Sunday night and the current version of our Severe Events article
can always be found in the Directory which can be accessed here.
And floods remain a concern which we also discussed in Section I.
| Last Week | Current Week |
|
|
Let’s see if this animation works.

Here are additional useful graphics from my weekly report which update automatically. The forecast maps were shown in the Introduction.
First the Day 3 Mid-Atmosphere pattern.


The below is of interest.

6. Soil Conditions and Crop Reports


We will now start reporting on evaporation

| Topsoil | Subsoil |
 |  |
Here is a way to look at soil moisture conditions based on model results.
| Last Week | This Week |
|  |

| And looking at the West. |
|

| Corn | Very Bad | Rice | Bad |
| Soybeans | Very Bad | Oats | Bad to Very Bad |
| Winter Wheat | Bad to OK | Barley | Very Bad |
| Cotton | OK to Good | Spring Wheat | Very Bad |
| Sorghum | Bad | Peanuts | Good |
| Sugarbeet | No Information | ||
| Sunflowers | Bad |


7. International

A map helps and is not always available but it is available this week

8. Background Information


The sequence of drought occurrence and impacts for commonly accepted drought types. All droughts originate from a deficiency of precipitation or meteorological drought but other types of drought and impacts cascade from this deficiency. (Source: NDMC)
Source: National Drought Mitigation Center, University of Nebraska-Lincoln


