Written by Sig Silber
U.S. and World Agriculture: Plus an Expanded Weather Forecast Section
Updated at 7 p.m. EDT May 17 to reflect the new Week 3 – 4 Forecast.
This week we provide a lot of information on the last twelve months May 2018 to April 2019 as well as a longer perspective on drought in this Century. We have a new Drought Forecast through August and it looks very good except for the Northwest and part of the South-Atlantic Coast. The crop progress reports are again bad to very bad. There is increasingly more detailed information available on what seems to be a bad crop year shaping up. In the Intermediate Term, the West is forecast to be cool and wet. The East is forecast to be mostly warm and dry so we might see some signs of mild drought in the East over the next couple of weeks. But more of CONUS is in the cool and wet pattern than the dry and warm pattern.

Please share this article – Go to the very top of the page, right-hand side, for social media buttons.
It is important to understand that the impact of weather on economic activity varies from one place to another. In this article, we try to provide a broad view of the impacts focusing mostly on the U.S. but also to a lesser extent on the Rest of the World. |
Major Sources of Information Used in this Weekly Report
|
1. Special Reports and Highlights.
Severe Weather

Discussion
Short Range Forecast Discussion NWS Weather Prediction Center College Park MD 411 PM EDT Thu May 16 2019 Valid 00Z Fri May 17 2019 – 00Z Sun May 19 2019
…Severe thunderstorms possible from the northern Plains to Ohio Valley tonight…
…Severe thunderstorms likely for much of the Great Plains on Friday…
…Heavy snow over the Sierra Nevada through tonight…
…Heavy rain possible for parts of the northern Rockies through tonight…
…Much cooler than normal conditions for much of the western U.S. and the northern Plains…
New Drought Forecast

And the discussion
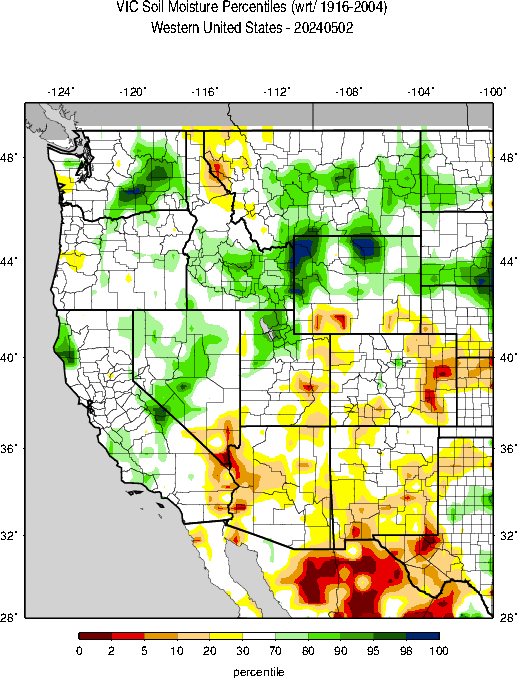
Latest Seasonal Assessment – Drought coverage continues to decrease across the Lower 48 states, after a relatively wet winter and early spring for many areas. CPC’s monthly and seasonal precipitation outlooks, valid for June and Jun-Jul-Aug (JJA) respectively, favor large areas of above normal precipitation across the CONUS, except parts of the Pacific Northwest, the Southwest and the Alaska Panhandle where below normal precipitation is favored. These outlooks, a generally favorable JJA climatology, and a wide array of dynamical and statistical models and tools, support drought improvement/removal over most residual drought areas over the Four Corners region. The exception is Washington state and northwestern Oregon, which recorded large precipitation deficits (12 to 16 inches) this past winter and early spring, unlike most other portions of the West. Although some precipitation is expected during the next few weeks, the Pacific Northwest is entering its dry season. Climatological considerations, in addition to CPC’s June and JJA 2019 precipitation outlooks convincingly tilt the odds towards drought persistence in north-central Washington, with parts of region of drought development expected. Drought coverage over the Southeast decreased recently. However, precipitation deficits in southeastern Georgia are on the order of 2-6 inches for the past 3-months. The CPC June and JJA precipitation and temperature outlooks favor above normal temperatures with no strong precipitation signal during both June and JJA. Drought persistence is favored.
The dry signal predicted over the Pacific Northwest during JJA is expected to also influence the Alaska Panhandle region. The southern Panhandle has been in hydrologic drought for many months, and the low reservoir levels have resulted in reduced hydropower production. Drought may extend northward during this JJA season to include parts of the northern portion of the Panhandle. In Hawaii, the climatological rainy season will soon give way to its dry phase, and this dry signal is expected to be reinforced by a weak El Niño. With increasingly persistent trade winds a common feature during the Hawaiian dry season, leeward slopes are expected to miss out on the heavy rainfall amounts that are usually received on the windward slopes. Drought persistent is forecast with possible drought development over parts of leeward areas of Lanai and Big Island. In Puerto Rico, the remaining area of moderate drought over the central part of Puerto Rico is expected to persist as the climatologically wet JJA season advances, but with warm and dry signals in the monthly and seasonal forecast tools.
And a peak at the new JJA NOAA precipitation forecast which now is more in line with the JAMSTEC forecast (more on that tomorrow and Saturday)

NOAA/NDIS Story Map click here to watch.
I found it hard to read so I extracted what I think are the key visuals and present them below. There is more animation at the link provided.

This is the 2012 drought

And now more recently


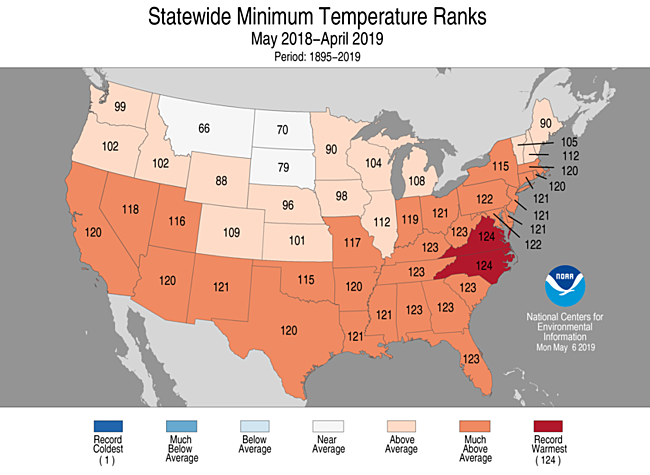
Twelve Month Cummulative Rankings
12 month (May 2018 – April 2019 ) rankings

By State
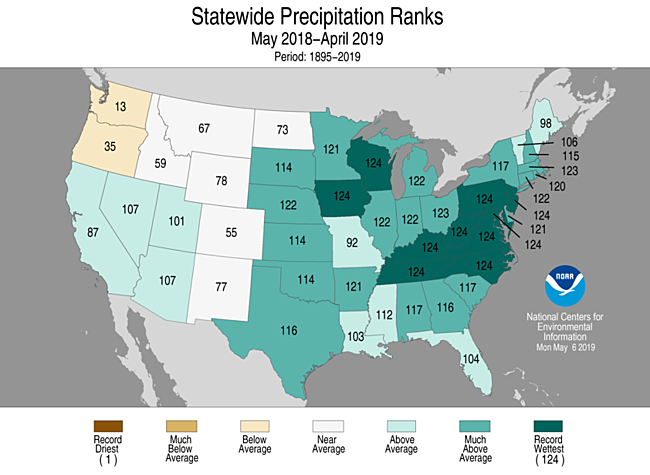

By State
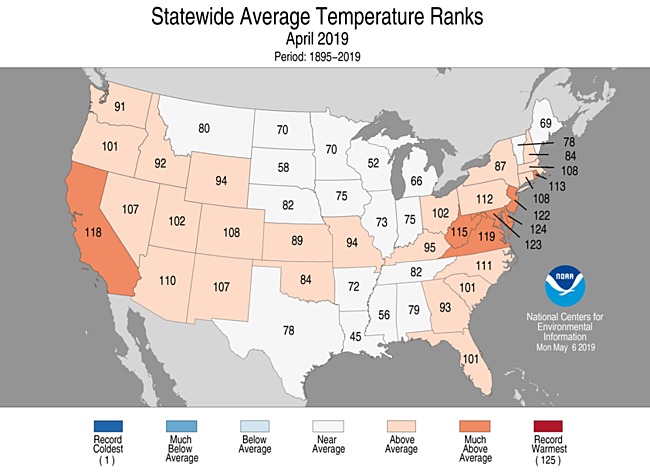
And now focusing on the single month of April
Temperature and here I am showing average temperature.
Precipitation

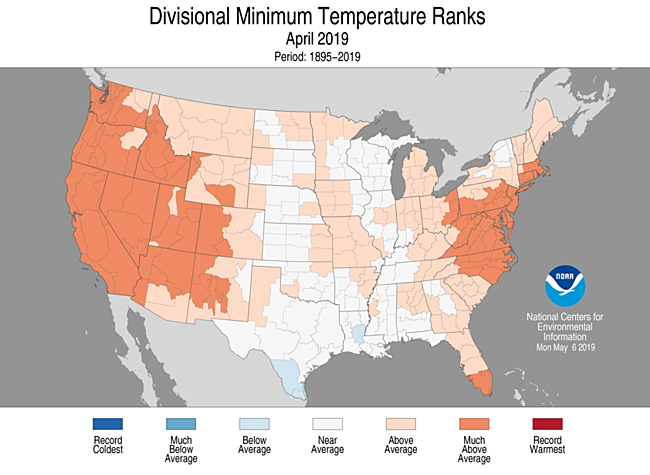
And another useful way to look at things is by climate division. Here is more information on climate divisions.
Temperature and not to confuse things too much I am showing minimum temperatures which are important this time of year for agriculture.
Precipitation

Here are the U.S. Climate Divisions which are actually shown above.
More information is available here.
Flooding
Here is the current status of flooding.
| Last Week | This Week |
|  |
More information can be found here.
The below shows one aspect of the current flooding risk.

Looking Ahead re Agriculture: Field Work
| Last Week | This Week |
|  |

2. Summary of Intermediate-Term Weather Forecast (helpful to predict drought and floods etc)
Here is the summary of the forecast for the next approximately twenty-five days. We provide this so that we can make our own assessment of the drought forecast. Here I provide the weather forecasts for different periods of time in which should allow the reader to assess the likelihood of this forecast working out as shown over the next three to four weeks. Since we publish this week on Thursday, we generally update the discussion for the Week 3 – 4 forecast when it is updated on Friday. This is important as the current Day 6 – 14 forecasts and the week-old week 3 – 4 forecast overlap to some extent.
Later we provide additional information relative to the weather forecast analysis but here is the summary.
First Temperature
|
|
|
|
The graphic above shows magnitude rather than the probability of being higher or lower than Normal and shows the middle day of the five day period. | Overall the pattern for both Week – 1 and Week – 2 is a cool west and warm east. The transition from the 8 – 14 day forecast shown above to the week 3/4 forecast seems feasible. The week 3-4 graphic was updated on May 17, 2019 | ||


And then Precipitation
|
|
| |
The five-day QPF is shown above. The units are different than the other maps i.e. in units of precipitation (inches) not probabilities of exceeding or being less than climatology. | Fairly stagnant but the Western wet anomaly is deamplifying slightly and the East looks mostly dry south of the Northeast. That is not good for North Carolina. The transition from the 8 -14 day forecast shown above to the week 3/4 forecast seems feasible. The week 3-4 graphic was updated on May 17, 2019 It reinforces the idea that the Northwest may have some drought risk. | ||


Additional Information on the forecast is provided later.
Here is the discussion that was released with the Week 3 – 4 Update.
Week 3-4 Forecast Discussion Valid Sat Jun 01 2019-Fri Jun 14 2019
The Week 3-4 Outlook is based primarily on dynamical model forecasts, including the NCEP CFS, ECMWF and JMA ensemble prediction systems, as well as the Subseasonal Experiment (SubX), a multi-model ensemble (MME) of both operational and experimental ensemble prediction systems. Statistical forecasts, including a multivariate linear regression (MLR) of lagged temperature and precipitation forecasts to current observed MJO and ENSO indices, were also consulted. Decadal timescale temperature trends are also a source of predictability in both dynamical and statistical forecast tools. The MJO has recently been active with subseasonal convective activity moving across the Western Pacific into the Western Hemisphere. Dynamical model forecasts indicate large uncertainty on the state of the MJO after week 2, such that MJO was not a large component of the forecasts. A weak El Nino continued into May, however the ENSO base state did not appear to be a primary source of predictability in dynamical and statistical model forecasts.
The CFS, ECMWF and JMA dynamical models exhibit considerable differences between their respective forecasts for the week 3 and 4 period, indicating significant uncertainty. The SubX also shows considerable uncertainty in the week 3 and 4 period with very weak 500-hPa height anomalies over the CONUS in the MME mean and considerable disagreement among the individual model forecasts that make up the SubX MME. The consensus of dynamical models generally indicates a transition of the circulation pattern forecast after week 2, leading to weak ridging over the central CONUS. The ECMWF ensemble and most ensemble members of the SubX predict weak troughing over the eastern CONUS. Models are in general agreement on the persistence of troughing near the Pacific coast into weeks 3 and 4. The consensus of the SubX MME predicts weak troughing over and south of the Aleutian Islands and positive 500-hPa height anomalies over mainland Alaska and the panhandle.
The Week 3-4 Outlook indicates enhanced probabilities of below normal temperatures over parts of the Great Plains, from the Rocky Mountains to the Central and Upper Mississippi Valley. Troughing over the western CONUS and ridging over the eastern CONUS in week 2 transitions to weaker troughing over parts of the west coast in weeks 3 and 4 in most dynamical model runs. Temperature forecasts from the ECMWF and several component models of the SubX predict a broader area of below normal temperatures across much of the CONUS, while the CFS and some individual models of the SubX, including the CCSM4 and Canadian models, predict likely above normal temperatures for much of the western and eastern CONUS. The area of greatest consensus among dynamical models for below normal temperatures is indicated in the Week 3-4 Outlook, with equal chances (EC) shown for significant portions to the southwest and northeast. Above normal temperatures are likely for much of the Pacific Northwest, under predicted above normal 500-hPa heights. Above normal temperatures are also likely for parts of the Southwest, where decadal temperature trends play a significant role. Continued ridging over the Southeast leads to likely above normal temperatures in the Week 3-4 Outlook. Above normal temperatures are most likely for Alaska under predicted positive 500-hPa height anomalies and where decadal temperature trends are relatively strong.
The Week 3-4 Outlook indicates likely above normal precipitation for parts of the Northern Rockies into the Northern Plains and for parts of the Southern and Central Plains, ahead of troughing in the forecast, primarily early in weeks 3 and 4. Dynamical model forecasts indicate a chance of storm systems moving up the Atlantic Coast during the period, leading to likely above normal precipitation for the Florida Peninsula and parts of New England. Below normal precipitation is likely for the remaining areas of the Gulf Coast northward into the Ohio Valley and parts of the Great Lakes region, under predominately northerly flow behind the predicted trough over the eastern CONUS in a consensus of models. Below normal precipitation is also likely for much of the Alaska Panhandle and the Pacific Northwest under above average 500-hPa heights. Above normal precipitation is likely for parts of the Aleutian Islands and Southwest Alaska, ahead of a predicted trough.
Surrounding above average sea surface temperatures and predicted positive 500-hPa height anomalies over Hawaii lead to enhanced probabilities of above normal temperatures for the Week 3-4 Outlook. A consensus of the SubX dynamical models predicts likely below normal precipitation for the northwestern Hawaiian Island and above normal precipitation for the southeastern islands.
3. Present Drought Conditions
The U.S. Drought Monitor is a comprehensive way of understanding the drought situation for the U.S. It is issued every Thursday and reflects the conditions as of the prior Tuesday. Drought is defined as a moisture deficit bad enough to have social, environmental or economic effects. Thus, more factors than recent precipitation are considered and more information on how it is done is found at the end of this report.

Something relatively new and concerns an area that is in drought probably due to the El Nino.

Below is the map for just CONUS and with statistics and below that map I have provided a cut-out of the statistics which I think you can click on to enlarge. When you click on graphics that I have set up to enlarge often with your mouse right click and then click on “view image” and that will work.
 |
 |
| Last Week | This Week |
| |

The graphic below shows the one-week change in drought intensity. Yellow is bad. Green is good.
|

Now we show the week to week change information by region. The yellow is where the drought has been upgraded. The green is where the level of drought has been downgraded.
 |
Improvement in Wyoming and Colorado. Not sure why Colorado shows up in two maps. |
 |
| No Change |
 |
| No Change |
 |
Mostly improvement in Texas. Slight improvement in Louisiana and Mississippi. |
 |
| Some deterioration in North Carolina and improvement in South Carolina, Georgia, Alabama, and Florida |
 |
Deterioration in Washington State. Improvement in Colorado and New Mexico. |
I do not think it is useful right now to think in terms of a core drought area so I am not including some of the graphics we have been showing that focused on the West and the Four Corners Area in particular
Some may find this way of looking at things useful and I hope these graphics are not too small to read. I did not make them so you could click on them individually but you can click on the whole graphic and it may enlarge. But I think you get the picture. It has been a rapid onset and demise. When you read these graphics, remember that the older graphics are not the drought conditions that existed then but the change from then until now.

Some might find this animation of twelve weeks of change useful;

Here is the discussion which was issued with the Drought Monitor today.
This Week’s Drought Summary
Widespread precipitation this week led mostly to improvements in moderate drought and abnormally dry regions across the Southeast and South, and in the Rocky Mountains in southern Colorado and northern New Mexico. In parts of central and western Washington where high evaporative demand and paltry precipitation amounts continued, conditions degraded to moderate drought. Moderate and severe drought continued in southeast Alaska and in parts of Hawaii, while moderate drought and abnormal dryness coverage was adjusted in Puerto Rico.
Northeast
Widespread precipitation occurred in the region over the last week, keeping the region free of abnormal dryness or drought.
Moderate to heavy rain engulfed much of the western Florida Panhandle and much of Alabama and southwest Georgia. As a result, short-term precipitation deficits were erased in many areas, leading to the removal of moderate drought that previously had extended from the Mobile area northeastward into southern Georgia. Some areas of abnormal dryness also improved in the Florida Panhandle, Alabama, and Georgia. Moderate drought was also removed in northeast Georgia and adjusted in parts of central and southern Georgia and South Carolina in response to changes in short-term precipitation deficits this week. The rest of the region remained free of abnormal dryness or drought.
South
Rainfall over the region was widespread and heavy in many areas, particularly Louisiana and southeast Texas, and this caused short-term precipitation deficits to improve in Texas and far southern Louisiana. Abnormal dryness in the Texas and Oklahoma panhandles was removed after rainfall this week. Abnormal dryness was also reduced and adjusted in southern Texas in response to recent rainfall. Abnormal dryness also ceased in southern Louisiana where heavy rainfall amounts of 3 to 5 inches were common this week.
Midwest
Light to moderate precipitation occurred over much of the Midwest, which was free of drought or abnormal dryness going into this week, and the region remains free of abnormal dryness or drought.
High Plains
Recent precipitation led to the removal of abnormal dryness in southeast Wyoming. Abnormally dry conditions continued from southwest Nebraska into northeast Colorado. Recent precipitation in the Wind River Range in Wyoming and improving surface moisture conditions led to a reduction of abnormal dryness in this area.
West
Precipitation over the past week in Colorado and New Mexico led to reduction of long-term precipitation deficits and improvement in conditions in southern Colorado and northern New Mexico. Moderate drought was completely removed from southern Colorado, and severe and moderate drought coverage was reduced in northwest New Mexico, where vegetation is prospering. A large area of long-term abnormal dryness also improved to normal conditions in south-central Colorado because of the continued precipitation. Abnormal dryness coverage in southwest Wyoming and northeast Utah was also reduced because of the effects of recent precipitation. Meanwhile, short- and long-term dry conditions, low streamflow, and high evaporative demand continue in western Washington, where moderate drought expanded to cover more of central and western Washington, including the coastal areas of the Olympic Peninsula.
Alaska, Hawaii, and Puerto Rico
Moderate drought continued in central Puerto Rico this week, though coverage was slightly reduced based on the location of short-term precipitation deficits. Abnormally dry conditions also expanded in southwest Puerto Rico. No changes were made this week in Alaska, and severe and moderate drought continued in southeast Alaska. Severe and moderate drought also continued on several islands in Hawaii, and no changes were made there this week.
Pacific Islands
The weather pattern during this USDM week (5/8/19-5/14/19) consisted of a couple weak circulations within a surface or near-equatorial trough across western (Yap State and Palau) to central (Kosrae to Chuuk States) Micronesia, trade-wind convergence over the Marshall Islands (RMI) and Kosrae State enhanced by the circulation (Invest 92W) which slowly moved across the eastern Federated States of Micronesia (FSM), and a dry trade-wind regime continuing across much of northern and western Micronesia. South of the equator, a northwest-to-southeast oriented surface trough remained nearly stationary near the Samoan Islands throughout the week. A surface low developed within the trough near the end of the week. This trough was a manifestation of the South Pacific Convergence Zone (SPCZ), with northerly winds to its north converging with southeasterly winds to its south. Satellite-based estimates of 7-day precipitation (QPE) showed a large area of 2 to 4+ inches of precipitation, with locally 10+ inches, across Kosrae to Pohnpei States associated with circulation 92W which tracked slowly across eastern FSM. A band of 1 to 2 inches of rainfall was indicated across parts of the RMI associated with the trade-wind convergence due to differential wind speeds. Small areas of 1-4 inches of precipitation were seen over parts of Palau and northwestern Yap State. Otherwise, little to no precipitation was indicated on the QPE maps for the rest of Micronesia. In the Southern Hemisphere, a large northwest-to-southeast region of 2-4 inches of precipitation, with locally higher amounts, stretched just north and east of the Samoan Islands, with its southern end engulfing American Samoa.
Extremely dry conditions persisted across the Mariana Islands, as weekly rainfall totals remained far below minimum requirements. During the first 2 weeks of May, passing showers delivered generally less than one-quarter inch of rainfall on Saipan, Rota, and at the Guam International Airport. According to the National Weather Service, “fuels remain dry [on Guam] and the Keetch-Byram Drought Index (KBDI) is now at 767 out of a maximum possible 800.” The Guam International Airport received rainfall totaling just 0.10 inch (5 percent of normal) from May 1-14 and 2.06 inches (25 percent) from March 1 – May 14. As a result, short-term drought continues across the Mariana Islands, with exceptional drought (D4-S) on Saipan and extreme drought (D3-S) on Rota and Guam.
Some beneficial showers occurred across the Republic of Palau, with more than 2 inches of rain reported during the week at the Palau International Airport. Still, given the fact that Palau has not met its monthly minimum requirement of 8 inches since the beginning of the year, more sustained rainfall will be needed to reduce the intensity of severe drought (D2-S).
Varying degrees of drought continued across several of the northern and western islands in the Federated States of Micronesia. For example, moderate drought (D1-S) developed on Chuuk Lagoon, where rainfall during the first 13 days of May totaled just 0.74 inch. Meanwhile, Yap received 3.39 inches of rain from May 1-10, helping to reverse a drying trend and resulting in an improvement from extreme to moderate drought (D3-S to D2-S). Recent rainfall data for Ulithi was missing. Meanwhile, Pohnpei experienced short-lived dryness early in the month, with 3.15 inches falling from May 1-13. However, Pohnpei received 1.56 inches on May 14 and retains a D-nothing designation. Heavy rain has fallen in early May on several other islands, including Pingelap and Kosrae, leaving the remainder of the FSM free of dryness and drought.
Drought relief arrived in Majuro in early May, where 11.73 inches fell during the first 14 days of the month. By May 12, Majuro’s reservoir storage rebounded to 33.96 million gallons, or 94 percent of capacity, which is above the critical threshold of 80 percent. As a result, Majuro’s drought intensity was reduced from extreme to severe (D3-S to D2-S). Serious drought conditions persisted, however, across the northern Marshall Islands of Wotje and Utirik (both D4-SL), where little rain has fallen this year. Beneficial rain (more than 5 inches) fell on Kwajalein in the last week; however, given the antecedent dryness on that island — with barely 2 inches of rain reported in March and April combined — severe drought (D3-S) is retained, pending further assessment of the impact of recent showers.
American Samoa has been very wet in May, with 12.28 inches reported in Pago Pago through the 13th. As a result, there are no concerns about dryness and drought.
Looking Ahead
This week, a strong jet stream with several embedded storm systems will move into the continental U.S. and will interact with copious amounts of moisture. Though the evolution of each of the storm systems remains in question, moderate to heavy rain is possible in parts of the Great Plains and Midwest from this weekend into next week, including in areas that have received heavy rain recently, in addition to a risk for severe storms. Moderate to heavy precipitation amounts are also forecast in the Sierra Nevada and in some other parts of the West as the storm systems move from west to east. Warmer temperatures are forecast to occur in parts of the Southeast from this weekend into early next week.
Western Water Situation
Here is part of the explanation for the overall situation in the West. Looking at the information from the network of SNOTEL sites. These are mainly in remote locations often at high elevations. they report by telecommunications hence their name.
First the last seven days.

Then we look at the Water Year.

Then we look at how much snow there is to melt when it is warmer.

Wildfires are becoming more of a problem as we move towards summer.


4. Recent Weather
There is much less snow this week..

Here is the SWE (water content of the snow) version.

Last Seven Days
For reference purposes here is the precipitation information for the prior seven days. It is not the same as what is shown in the USDA Crop Report since the crop week covers the Sunday to Saturday period which corresponds to the crop reports. To avoid confusion, I have not included in this article the weather graphics that correspond to the crop week. But it is important to understand that the crop reports cut off on a Saturday, are reported on the following Tuesday, and the Drought Monitor is issued on Thursday so here are different lags for different sets of information presented.
Below is the current seven-day period and updates in this article automatically every day. It is a better tool for making forecasts.


Current Month to Date.

And then temperature

You can generate a wide variety of different graphics here.
5. Current Forecast for Precipitation and Drought.
Here is the Seasonal Forecast through August 31 which was issued on April 18, 2019 with the full Seasonal Outlook.
Here is the May one-month drought forecast which was issued on April 30, 2019.

These two forecasts are issued by the same agency but to obtain them you need to access two different links here and here. The three-month Seasonal Drought Outlook will be updated on May 16, 2019.
Additional Information Relative to the Intermediate-Term Forecast
We provided the summary approximately 25 Day Forecast earlier. Here is additional information that relates to this forecast.
First, the weather hazards forecast.


Additional information can be obtained here. We also now publish a Live Severe Weather article. The link to our Severe Weather Events article changes every Sunday night and the current version can always be found in the Directory which can be accessed here.
And we do not want to ignore floods which we also discussed in Section I.

Let’s see if this animation works.

Here are additional useful graphics from my weekly report which update automatically. The forecast maps were shown in the Introduction.
First the Day 3 Mid-Atmosphere pattern.


The below is of interest.
6. Soil Conditions and Crop Reports

We will now start reporting on evaporation

| Topsoil | Subsoil |
 |  |
Soil Conditions
|

Here is another way to look at it based on model results.

| And looking at the West. |
|

| Corn | Very Bad | Rice | Very Bad |
| Soybeans | Very Bad | Oats | Vert Bad |
| Winter Wheat | Mixed | Barley | Bad |
| Cotton | Bad | Spring Wheat | Very Bad |
| Sourghum | Bad | Peanuts | OK |
| Sugarbeet | Very Bad | ||


A look at the areas impacted by drought in terms of crop. But this might be more useful with respect to floods and oversaturated soils.


7. International

A map helps and is not always available but is this week

8. Background Information


The sequence of drought occurrence and impacts for commonly accepted drought types. All droughts originate from a deficiency of precipitation or meteorological drought but other types of drought and impacts cascade from this deficiency. (Source: NDMC)
Source: National Drought Mitigation Center, University of Nebraska-Lincoln


