Written by Sig Silber
U.S. and World Agriculture: Plus an Expanded Weather Forecast Section
Updated at 4:20 p.m. EDT April 26, 2019 to reflect the updated Week 3 – 4 Forecast which is generally favorable except for Hawaii and could represent some severe weather issues for the Southern Plains States and Southeast.
The drought is essentially over (setting record low values of drought since the inception of the U.S. Drought Monitor in 2000) for most areas. The weather now has returned to normal for this time of the year – with of course variation across CONUS. But the crop reports continue to show a slow start or worse for most major crops. This may improve over time. We focus a bit on the Northwest in this report as they are the one area of CONUS most at risk for drought right now. We also take a look at the economic impact of hurricanes and tropical storms. As usual, this report has our mid-week 25 day weather forecast.

Please share this article – Go to the very top of the page, right-hand side, for social media buttons.
With near- to record wetness in many parts of the country this winter and in 2018, the April 16 USDM had the lowest percent of area in drought (D1-D4) for the lower 48 States (3.73%) and all 50 States (3.78%) since the inception of the U.S. Drought Monitor in 2000, surpassing the previous low drought standard of May 23, 2017. In fact, no dryness/drought (D0-D4) in both the lower 48 (85.88%) and all 50 States (87.06%) also set record low values last week. With more wet weather over D0-D2 areas this week, new USDM record lows will most-likely be set.
It is important to understand that the impact of weather on economic activity varies from one place to another. In this article, we try to provide a broad view of the impacts focusing mostly on the U.S. but also to a lesser extent on the Rest of the World. |
Major Sources of Information Used in this Weekly Report
|
1. Special Reports and Highlights.
There were two strong storms this past week.

Not reflected in the crop reports is the current storm happening right now.
A focus on one area impacted by drought

Digging Deeper as to why this area has drought and abnormally dry conditions.

Some research conducted in the PNW area

And here is one thing they developed.

Flooding.
Here is the current status of flooding.

More information can be found here.
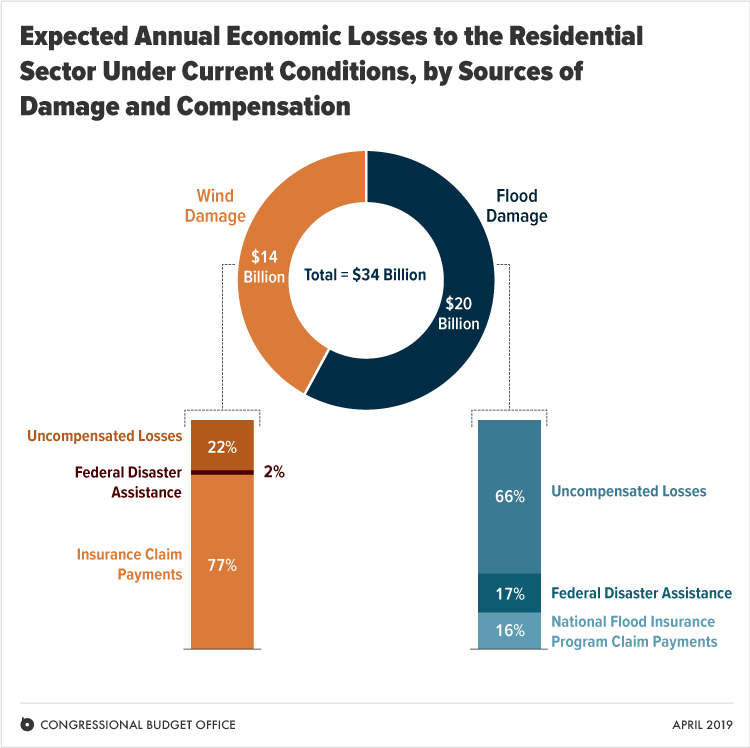
Looking ahead to Hurricane Season. The following is the estimate of the projected average annual costs related to Hurricanes and Tropical Storms.
Expected Costs Of Damage From Hurricane Winds And Storm-Related Flooding
from the Congressional Budget Office

Breaking down the impacts to the residential sector
Impact on the Public Sector

2. Summary of Intermediate-Term Weather Forecast (helpful to predict drought and floods etc)
Here is the summary of the forecast for the next approximately twenty-five days. We provide this so that we can make our own assessment of the drought forecast. Here I provide the weather forecasts for different periods of time in which should allow the reader to assess the likelihood of this forecast working out as shown over the next three to four weeks. Since we publish this week on Thursday, we generally update the discussion for the Week 3 – 4 forecast when it is updated on Friday. This is important as the current Day 6 – 14 forecasts and the week-old week 3 – 4 forecast overlap to some extent.
Later we provide additional information relative to the weather forecast analysis but here is the summary.
First Temperature
|
|
|
|
This shows magnitude rather than the probability of being higher or lower than Normal and shows the middle day of the five day period. | From Week -1 to Week – 2 the anomalies moderate. But we still see that cool anomaly which is not helpful with regards to crop progress. The transition from the 8 – 14 day forecast shown above to the week 3/4 forecast which was updated on April 26, 2019 seems feasible. | ||


And then Precipitation
|
|
| |
The five-day QPF is shown above. The units are different than the other maps i.e. in units of precipitation (inches) not probabilities of exceeding or being less than climatology. | From Week -1 to Week -2 the anomalies moderate. The transition from the 8 -14 day forecast shown above to the week 3/4 forecast which was updated on April 26,2019 now seems feasible. It is good news for the Northwest but may compound the too-wet situation and could create a severe weather risk for the Southern Plains and part of the Southeast. | ||


Here is the discussion which was issued with the Week 3 – 4 Update
Week 3-4 Forecast Discussion Valid Sat May 11 2019-Fri May 24 2019
The climate background state has evolved to include a more robust ongoing MJO event than in recent weeks. The strongly enhanced convection over the Indian Ocean is expected to interfere with and modulate the extratropical response to ENSO. The various dynamical models are in reasonably good agreement on the forecast circulation over the North Pacific, with a wave train of subtropical origin being evident the multi-model ensemble means (both operational and SubX). However, the forecast circulation over the CONUS is very close to climatology, perhaps an indication of this ENSO-MJO interaction. The best agreement is on the presence of a cyclonic upper-level circulation anomaly centered over interior Southwest.
The temperature forecast generally favors above-normal temperatures over much of the northern and eastern tier of the CONUS – a fairly persistent feature in recent Weeks 3-4 forecasts. An area slightly favoring below-normal temperatures is depicted over parts of the south-central and southwestern CONUS, shifted slightly northward relative to the seasonal temperature forecast. This again is consistent with some modulation of the ENSO response, and most evident in the ECMWF ensemble mean. Very high probabilities for above-normal temperatures are indicated for parts of Alaska (>80%), where all forecast tools are on board and in phase with both the ENSO and long-term trend footprints. The weakness in above-normal temperature probabilities over the Great Lakes and New England is likely due to some carryover from the Week-2 period, in which a -NAO pattern is forecast over the Northwest Atlantic and likely to displaced Canadian air masses southward. This is not forecast to continue into Weeks 3-4, but lingering high pressure early in the period leads to an equal chances forecast for some regions. Additionally, the constructed analog based on 200-hPa streamfunction has a colder solution for much of the Northeast.
The precipitation outlook falls out cleanly from the expected anomalous cyclonic circulation forecast over the Southwest, especially for parts of the Rockies and central Plains. Dynamical models are especially wet over much of the CONUS, with the ECMWF being a favored solution. Statistical guidance from the MJO favors a northward shift of the storm track relative to ENSO forcing alone, leading to a larger region of slightly enhanced odds of above-normal precipitation when combined with dynamical models.
Anomalous ridging continues to be expected around Hawaii during Weeks 3-4, and SST anomalies are back above normal around the entirety of the state. This results in a forecast of above normal temperatures for the entire state. The dynamical model consensus favors a very slight tilt toward below-normal rainfall, with odds increasing from east to west.
Additional Information on the forecast is provided later.
3. Present Drought Conditions
The U.S. Drought Monitor is a comprehensive way of understanding the drought situation for the U.S. It is issued every Thursday and reflects the conditions as of the prior Tuesday. Drought is defined as a moisture deficit bad enough to have social, environmental or economic effects. Thus, more factors than recent precipitation are considered and more information on how it is done is found at the end of this report.

Something new and concerns an area that is in drought.

Below is the map for just CONUS and with statistics and below that map I have provided a cut-out of the statistics which I think you can click on to enlarge. When you click on graphics that I have set up to enlarge often with your mouse right click and then click on “view image” and that will work.
 |
 |
| Last Week | This Week |
| |

The graphic below shows the one-week change in drought intensity. Yellow is bad. Green is good.
|

Now we show the week to week change information by region. The yellow is where the drought has been upgraded. The green is where the level of drought has been downgraded.
 |
Deterioration in Wyoming. |
 |
| No Change |
 |
| Almost no Change |
 |
Mostly improvement in Texas. Improvement in Louisiana and Mississippi. |
 |
| Improvement all over. This may explain the reduction in the number of people impacted. |
 |
Deterioration in Montana but small improvement in many states and major improvement in New Mexico. |
I do not think it is useful right now to think in terms of a core drought area so I am not including some of the graphics we have been showing that focused on the West and the Four Corners Area in particular
Some may find this way of looking at things useful and I hope these graphics are not too small to read. I did not make them so you could click on them individually but you can click on the whole graphic and it may enlarge. But I think you get the picture. It has been a rapid onset and demise. When you read these graphics, remember that the older graphics are not the drought conditions that existed then but the change from then until now.

Some might find this animation of twelve weeks of change useful;

Here is the discussion which was issued with the Drought Monitor today.
This Week’s Drought Summary
A series of storm systems moved quickly across the lower 48 States until reaching the East Coast as a strong ridge of high pressure over the western Atlantic Ocean blocked their eastward progression. Due in part to this slowdown, severe weather and heavy rainfall occurred in portions of the southern Great Plains, lower Mississippi Valley, Southeast, and mid-Atlantic during April 17-19. Moderate to heavy precipitation (1.5-4 inches) also occurred over the western Great Lakes region, Tennessee and central Ohio Valleys, parts of New England, and northwestern Washington. Light to moderate precipitation (0.5-2 inches) was widespread in the Northwest, eastern Great Basin, northern and southern thirds of the Rockies, northern Plains, and the eastern third of the Nation. Only portions of the Southwest, central Rockies and Plains, and western Corn Belt saw little or no precipitation. Weekly temperatures averaged above-normal for much of the contiguous U.S., except for subnormal readings across the Southeast and western and southern Alaska. Light to moderate precipitation along the southern and southeastern Alaskan Coast and light showers on the windward side of the Hawaiian Islands maintained conditions in both states. Changes were made in Puerto Rico as spotty heavy showers provided some relief to short-term D0 and D1 areas, but where the rains missed, some deterioration occurred.
With near- to record wetness in many parts of the country this winter and in 2018, the April 16 USDM had the lowest percent of area in drought (D1-D4) for the lower 48 States (3.73%) and all 50 States (3.78%) since the inception of the U.S. Drought Monitor in 2000, surpassing the previous low drought standard of May 23, 2017. In fact, no dryness/drought (D0-D4) in both the lower 48 (85.88%) and all 50 States (87.06%) also set record low values last week. With more wet weather over D0-D2 areas this week, new USDM record lows will most-likely be set.
Northeast
Most areas saw light to moderate precipitation (0.5-1.5 inches), although northern Maine, Massachusetts, Connecticut, and Long Island, central Pennsylvania, central New York, and southern West Virginia received 1.5-3 inches, with reports of severe weather, including tornadoes, in Maryland, Delaware, and Pennsylvania. The last remaining area of D0 in the Northeast (in southwestern New York) measured 1-2 inches of rain, bringing 90-day deficits close to zero as 7-day averaged USGS stream flows were in above (76-90th percentile) to much-above (>90th percentile) levels. In fact, much of the Northeast reported similar 7-day USGS average stream flows along with adequate to surplus topsoil and subsoil moisture (from USDA/NASS), and could use some drier conditions.
Southeast
As the storm system strengthened and slowed Thursday into Friday, a line of severe weather developed ahead of the cold front, dropping heavy rains (2-6 inches, locally to 8 inches) from south-central Alabama northeastward into western North Carolina and eastern Tennessee. The rains eased short-term deficits (where D0-D1 was) in south-central Alabama, southwestern Georgia, northeastern South Carolina (Myrtle Beach area), and southeastern North Carolina (Wilmington area). In the latter two areas, a narrow band of 1.5-3 inches of rain was enough to make a 1-category improvement. In southeastern Alabama, a narrow band of 2-category improvement was made (D1 to nothing) where flash flooding from 4-8 inches of rain was reported in Crenshaw, northern Pike, southern Montgomery, western Bullock, central Macon, and Lee counties. Further north, numerous reports of severe weather, including numerous tornadoes, slammed into the Carolinas and Virginia on April 19. To the south across southern South Carolina, eastern Georgia, and Florida, in addition to severe weather here, enough rain fell (0.5-1.5 inches) to prevent deterioration, but it was not sufficient to make any improvements, hence status-quo.
South
Two different storm systems brought welcome precipitation to the South. Early in the period, central and eastern Texas and the lower Mississippi and Tennessee Valleys received widespread moderate to heavy rains (1.5-3 inches, locally to 6 inches) that erased much of the short-term D1 and D0 in central Texas, eastern Louisiana, and southwestern Mississippi. The few areas that received less than an inch of rain, or where 60- to 90-day significant deficits still remained, were left unchanged. In contrast, parts of west-central Texas (Edwards Plateau) missed out on the rain, and some slight D1 and D0 expansion was made here, and additionally in northern Webb County. The second system which occurred late in the period dropped beneficial precipitation on the southern Rockies (New Mexico mountain snows) and south-central Plains (Texas Panhandle and west-central Oklahoma), easing dryness and drought there (see West for New Mexico). Some short-term (2-3 months) dryness was found in northern and central Oklahoma, but longer-term wetness has kept D0 development at bay so far. Elsewhere in the South, overall wet conditions prevailed.
Midwest
The Midwest remained D0 and drought-free as a wet 2018 and wet 2019 continued to dominate the soils. This week, moderate to heavy rains (1.5-4 inches) fell across southern Minnesota, northern Wisconsin, and the Upper Peninsula of Michigan, while another band of decent rain (1.5-3 inches) was measured from southeastern Michigan southwestward into central and western Kentucky. In contrast, little or no rain was observed across most of Iowa, northern Illinois, northern Missouri, and eastern Ohio. According to USDA/NASS on April 21, every Midwestern state reported little or no topsoil or subsoil moisture shortages (0-2% short or very short), with several states reporting 25-60% surpluses. Some hint of dryness at 1-2 months was showing up in southern Iowa and northern Missouri and it will be watched, but for now it was welcome news for farmers to get into the fields for preparation and planting.
High Plains
A fairly large area of light to moderate precipitation (0.5-1.5 inches) was observed across most of Montana, southern North Dakota, western and southeastern South Dakota, Wyoming, and western and northeastern Nebraska. Southern Kansas also received some decent rains (0.5-2.5 inches), as did southern Colorado (0.5-1.5 inches). The precipitation in Colorado was enough to improve D1 to D0 (see West summary with respect to New Mexico). In southwestern Wyoming, the additional precipitation boosted WYTD average basin precipitation and SWE to 112% and 123%, respectively, thus D1 and D0 was shrunk. In northern Wyoming, 0.5-1.5 inches of precipitation was enough to create WYTD and YTD surpluses near the northern and southern D0 edges, thus erasing some of the D0. However, the D1 in the Bighorn Mountains remained intact as both WYTD basin average precipitation and SWE still stayed around 75% of normal. In contrast, extreme northern Montana and North Dakota have missed out on the precipitation, and at 60-days, only 25-50% of normal precipitation has fallen, leading to deficits of 0.5-1.5 inches. In addition, a rapid snow melt during mid-March left much of the water to run off instead of percolating into the still frozen subsoil, thus D0(S) was added. Longer time periods were wet, but since this is the start of the wet season, it is critical that timely and adequate rains fall during the next few months for agricultural interests. Short-term (2-3 months) deficits in central Kansas were also accumulating, but large longer-term surpluses have kept D0 from developing so far.
West
Additional Pacific moisture spread across the Northwest, dropping light to moderate amounts (0.5-1.5 inches) on coastal Washington, the Cascades, northern Rockies, and the central Great Basin (eastern Nevada, western and northern Utah). As a result, some D0 was erased from central Oregon, northern Olympic Peninsula (Washington), and extreme northwestern Washington, while a bit of D1 (west edge) was improved in the extreme northern Cascades. From field reports of excessive moisture & standing water in northwestern and northeastern Utah (since station data can be scarce), D1 and D0 was improved by 1-category in the state and adjacent southwestern Wyoming. WYTD basin average precipitation and SWE are both well above normal as of April 23. Even New Mexico (and southern Colorado) received beneficial precipitation (0.5-2 inches) late in the period. For New Mexico, a reassessment was made based upon short-term (WYTD) wetness vs long-term (several years) drought, plus this week’s precipitation. With many SNOTEL WYTD basin average precipitation and SWE above normal, and most USGS stream flows at or above normal with good inflows into reservoirs, 1-cat improvements were made across most of the state, with the lone D2 area remaining in the northwest where ground observations confirmed worse conditions than the rest of the state. Although this WY has been quite favorable for New Mexico, multi-year strong summer monsoons and additional wet winters will be needed to make a full hydrologic recovery.
Alaska, Hawaii, and Puerto Rico
In Hawaii, mostly light scattered showers fell on the windward sides of the Hawaiian Islands while little or no rain was reported on the leeward sides during the last 6 days of the period, although day1 (24-hour totals ending 8am HST) totals were a bit more substantial and widespread on both the windward and leeward sides of the islands. After last week’s improvements to the windward sides of the Big Island and Maui and this week’s mostly lower precipitation amounts, no changes were made.
In Puerto Rico, scattered showers, some with moderate to heavy amounts (1.5-5 inches), fell on western, northeastern, and far eastern sections, greatly reducing 90-day deficits or producing small surpluses, and easing dryness (D0) and drought (D1) in these areas. In contrast, drier weather added onto existing short-term shortages, slightly expanding D1 in southeastern sections (Cayey, Aibonito, Cidra municipalities) as USGS 7-day average stream flows dropped below the tenth percentile (much below-normal) in most of the D1 area.
In Alaska, status-quo as light to moderate (1-4 inches) precipitation, with some locally heavy amounts (4-10 inches), fell along the southern and southeastern coasts, with lighter totals (0.25-1 inch) occurring in central and eastern interior sections. According to ACIS data, southeastern Alaska still had 6-month deficits of 5-15 inches, and well over 20 inches going back 9-months and longer. It will most-likely take a prolonged wet spell in southeastern Alaska to bring long-term deficits close to zero.
Pacific Islands
The overall weather pattern changed little during this USDM week (4/17/19-4/23/19) compared to last week. Scattered precipitation occurred in southern portions of Micronesia this week along a near-equatorial trough across parts of the Federated States of Micronesia (FSM) and in a region of trade-wind convergence in eastern Micronesia, and a weak circulation slowly migrated from southern Chuuk State into southern Yap State. These features comprised the Inter-Tropical Convergence Zone (ITCZ). Dry trade winds from the sub-tropical ridge (North Pacific High) inhibited precipitation across western and northern portions of Micronesia. South of the equator, a surface trough was mostly stationary just south of the Samoan Islands, but showers from the trough occasionally brushed the islands. This trough was part of the South Pacific Convergence Zone (SPZC). The ITCZ and SPCZ activity was reflected on satellite-based estimates of 7-day precipitation (QPE) as a broad band of 1+ inches of rain from eastern Yap State to the Marshall Islands (RMI), with patchy areas of 2-4 inches or more. The band was between 5 and 8 degrees North latitude over parts of Yap State, but mostly south of 6 N over eastern FSM and the RMI. Little to no rain was indicated on the QPE across the northern and far western portions of Micronesia. A band of 2-6 inches of rain was depicted on the QPE associated with the trough south of the Samoan Islands, with areas of 1-2 inches extending into American Samoa, and little to no precipitation further to the north.
Dry trades and subsiding air kept precipitation amounts low across the Marianas this week. A third of an inch of rain or less was recorded at Rota (0.35 inch), Saipan (0.28), and Guam (0.23). Spotty fires developed on Guam, with a Fire Weather Watch issued for a couple days and Red Flag Warning in effect near the end of the week. No change was made to the USDM depiction in the Marianas, with D4-S continuing at Saipan, D3-S continuing at Guam, and D2-S continuing at Rota.
It was another dry week in the Republic of Palau, with rainfall less than an inch on Koror (0.78 inch). Only 4.41 inches of rain has fallen so far in April, and this is the third consecutive dry month (less than the 8-inch monthly minimum needed to meet most water needs). Local reports have been received that water rationing has been implemented in parts of Palau, on the northern state in Babeldaob (the big island), so the USDM status at Palau was changed from D1-S to D2-S.
More than half of the days were missing this week for Kapingamarangi, Nukuoro, and Pingelap, and Ulithi has been missing for several months, so no analysis could be made for these 4 stations this week. However, reports of damage to coconut trees from the drought in Ulithi have been received, and coconut and breadfruit in the northern islands are drying up. In the Yap Main Islands, data from Yap were incomplete, but North Fanif received 0.25 inch of rain based on 4 days of data. Fananu recorded less than a tenth of an inch (0.07) of rain this week. The previous 2 weeks were wet, but 5 of the last 6 months (including April) have been dry at Fananu. Based on the agricultural impacts, and April marking the third consecutive dry month at these 2 stations, the USDM status was worsened to D3-S at Yap and D2-S at Fananu. Woleai reported 0.01 inch of rain this week with 3 days missing. Based on the agricultural impacts, and April marking the fourth consecutive dry month, the status at Woleai was worsened to D1-S. According to the data received by analysis deadlines, the week was wet only at Pohnpei (2.90 inches) and Kosrae (3.12 inches). D-Nothing continued at Chuuk, Pohnpei, Kosrae, and Lukonor.
It was a dry week across the Marshall Islands, with less than an inch of rain recorded at all of the regular reporting stations. The reservoir level on Majuro steadily declined during April. Due to reservoir water rationing and a few scattered showers, the decline was halted with the reservoir level holding mostly steady during this USDM week. But with the level at roughly 23.7 million gallons for the week, it is still only 65.8% of maximum, which is well below the 80% threshold for concern. A tenth of an inch, or less, of rain has fallen for each of the last 4 weeks at Ailinglapalap, with 0.17 inch for April so far and 6.90 inches for March, so the status was worsened to D1-S at Ailinglapalap. D3-S continued at Kwajalein and Majuro, and D4-S continued at Utirik and Wotje. The last 2 or 3 weeks have been dry, but, benefiting from ITCZ convection due to their southern location and with March being wet, D-Nothing continued at Jaluit and Mili.
The last 4 weeks have been dry (less than 2 inches) at Pago Pago, but enough rain has fallen each week (1.50 inches this week), and the previous several months have been wet, so D-Nothing continued for Tutuila.
Looking Ahead
During the next 5 days (April 25-29, 2019), two systems are expected to provide precipitation to the lower 48 States. One system will track from the southern Rockies northeastward into New England, bringing moderate to heavy rain(1-4 inches) and severe weather to the southern Plains, lower Mississippi, Tennessee, and Ohio Valleys, and Northeast, with another system moving southeastward out of southwest Canada across the northern Rockies and Plains, Midwest, and eastern Great Lakes region, dropping light to moderate totals (0.5-2 inches). Little or no precipitation is expected in the Far West, Southwest, south-central Plains, far upper Midwest, and along the southern Atlantic Coast. Temperatures should average below-normal across the northern third of the U.S., near normal in the Southeast, and above-normal in the Southwest.
The CPC 6-10 day extended range outlook (April 30-May 4, 2019) favors above-normal precipitation odds across much of the central U.S., from the Rockies eastward to the Appalachians, in western and northern Alaska, with subnormal totals likely along the West Coast and in southeastern Alaska, with near-normal chances elsewhere. Subnormal temperatures are likely in the North-Central States while chances of above-normal readings are favored in the Southeast and western Alaska.
Here is part of the explanation for the overall situation in the West. Looking at the information from the network of SNOTEL sites. These are mainly in remote locations often at high elevations. they report by telecommunications hence their name.
First the last seven days.

Then we look at the Water Year.

Then we look at how much snow there is to melt when it is warmer.

Wildfires are becoming more of a problem as we move towards summer.


4. Recent Weather
There is much less snow this week..

Here is the SWE (water content of the snow) version.

Last Seven Days
For reference purposes here is the precipitation information for the prior seven days. It is not the same as what is shown in the USDA Crop Report since the crop week covers the Sunday to Saturday period which corresponds to the crop reports. To avoid confusion, I have not included in this article the weather graphics that correspond to the crop week. But it is important to understand that the crop reports cut off on a Saturday, are reported on the following Tuesday, and the Drought Monitor is issued on Thursday so here are different lags for different sets of information presented.
Below is the current seven-day period and updates in this article automatically every day. It is a better tool for making forecasts.


Current Month to Date.

And then temperature

You can generate a wide variety of different graphics here.
5. Current Forecast for Precipitation and Drought.
Here is the Seasonal Forecast through July 31 which was issued on April 18, 2019 with the full Seasonal Outlook.

Here is the April one-month drought forecast which was issued on March 31, 2019. It will be updated for May on April 30, 2019.

These two forecasts are issued by the same agency but to obtain them you need to access two different links here and here. The three-month Seasonal Drought Outlook will be updated on May 16, 2019.
Additional Information Relative to the Intermediate-Term Forecast
We provided the summary approximately 25 Day Forecast earlier. Here is additional information that relates to this forecast.
First weather hazards


Additional information can be obtained here. We also now publish a Live Severe Weather article. The link to our Severe Weather Events article changes every Sunday night and the current version can always be found in the Directory which can be accessed here.
And we do not want to ignore floods.
Let’s see if this animation works.

Here are additional useful graphics from my weekly report which update automatically. The forecast maps were shown in the Introduction.
First the Day 3 Mid-Atmosphere pattern.


The below is of interest.

6. Soil Conditions and Crop Reports

| Topsoil | Subsoil |
 |  |
Soil Conditions
|

| And looking at the West. |
|


7. International


8. Background Information


The sequence of drought occurrence and impacts for commonly accepted drought types. All droughts originate from a deficiency of precipitation or meteorological drought but other types of drought and impacts cascade from this deficiency. (Source: NDMC)
Source: National Drought Mitigation Center, University of Nebraska-Lincoln


