Written by Sig Silber
U.S. and World Agriculture: Plus an Expanded Weather Forecast Section.
Updated at 4 PM EST February 15, 2019 to reflect newly issued Week 3 – 4 Forecast
Lots to report tonight. NOAA possibly confused by the MJO has declared that weak El Nino conditions are in place. We will report on that separately tomorrow. Not much has changed with the drought statistics. We have lots of data on January 2019 and 2018 State Rankings re historical temperature and precipitation. We present two interesting graphics on CONUS temperature and precipitation since 1895. We have the report on Crop Production for 2018. Plus we cover everything else we normally report on including a near-term weather forecast.

Please share this article – Go to very top of page, right hand side, for social media buttons.
1. Introduction and Special Reports.
EL NIÑO/SOUTHERN OSCILLATION (ENSO) DIAGNOSTIC DISCUSSION issued by CLIMATE PREDICTION CENTER/NCEP/NWS and the International Research Institute for Climate and Society 14 February 2019 ENSO Alert System Status: El Niño Advisory Synopsis: Weak El Niño conditions are present and are expected to continue through the Northern Hemisphere spring 2019 (~55% chance). |
NOAA released the below information Tuesday. It is state rankings. Some of it has been published before. The first row is January of this year, The second row is last year the full year. The next four rows are Winter of 2017/2018, Spring, Summer, and Fall of 2018. The maps should enlarge if you click on them. If not, right click and view image.
 |  |
 |  |
 |  |
 |  |
 |  |
 |  |
Now we take a look at 124 years of weather history. That is more than a century. It is useful since drought is a function mostly of low precipitation and also high temperatures. So it is useful to look at the trend


Later we have a full analysis but here is a summary.
Now the Temperature Forecast .
 |  |  |  |
| This shows magnitude rather than probability of being higher or lower than Normal and shows the middle day of the five day period. | Looks like the Western Third of CONUS will be cool* in both Week – 1 and Week – 2. The stagnant pattern persists. * warmer or cooler than climatology | ↑ ← The Week 3 – 4 forecast was updated on Friday February 15, 2019. May not make everyone happy but cool West is generally good for getting out of drought but it may delay mountain snowmelt to benefit valleys. | |
And then the Precipitation Forecast
|  |  | |
| The five day QPF is shown above. The units are different than the other maps i.e. in units of precipitation (inches) not probabilities of exceeding or being less than climatology. | It is generally wet. But at different times it will be dry in West Texas and the California Coast. The updated forecast on Friday indicates less so for Texas and more so in Week – 2 for the entire West Coast. | ↑ ← The Week 3 – 4 forecast will be updated on Friday February 15, 2019. We will update our comments at that time. Concern about possible Southeast flooding. | |


This report is now organized as follows:
- Special Reports and Introduction
- Present Drought Conditions
- Last Week’s Weather
- Information from our Weekly Weather Column (the forecast maps auto-update) and combined with brief commentary from me provides a forecast which I attempt to interpret re the likely change in drought conditions
- U.S. Crop Information
- International Crop Information and related weather
- Prior month’s weather and month-to-date weather excluding the prior week when I have that information. Drought is based on cumulative deficits.
- A science theme if we have one.
- Economic Impacts (it will time to get that part of the report going.
- Reference Information. (This includes a lot of information on reservoirs and river flows)
- The U.S. Drought Monitor (full report can be accessed here)
- Selected parts of our Weekly Weather and Climate Report (Monday’s full report can be accessed here) which has forecasts for the next 25 days and which auto-updates
- Selections from the Tuesday USD Weather and Crop Bulletin (full report can be accessed here). Selections from the USDA Office of the Chief Economist can be found here. Other useful sources of information that I regularly utilize are the National Integrated Drought Information System (NIDIS) which can be accessed here and the USDA NRCS Weekly and Weather Climate Update which can be accessed here.
Remember if you leave this page to go to links or if you have clicked to enlarge a graphic, in order to get back you need to hit the return arrow usually located on the left of your URL box on the upper left of the screen. Also most of the small graphics are designed to become full size when you click on them. If that does not work, an alternative way to view the larger graphics is to right click and then hit “view image”. That should always work.
1. Introduction.
2. Present Drought Conditions
The U.S. Drought Monitor is a comprehensive way of understanding the drought situation for the U.S. It is issued every Thursday and reflects the conditions as of the prior Tuesday. Drought is defined as a moisture deficit bad enough to have social, environmental or economic effects. Thus, more factors than recent precipitation are considered and more information on how it is done is found at the end of this report.

Below is the same map but just CONUS and with statistics and below that map I have provided a cut-out of the statistics which I think you can click on to enlarge.
 |
 |
| Last Week | This Week |
| |

The graphic below shows the one-week change in drought intensity. Yellow is bad. Green is good.

We are showing the change maps for the states that improved the most and deteriorated the most. (For technical reasons the ability to click on any of these maps and get a larger version is not available this week). Wyoming also deteriorated but did not notice in time and some NOAA problems would make it a lot of work to add Wyoming to the graphic below.

This pair of maps might make it easier to get a general idea of what is happening in the worst part of the drought area.
| Last Week | This Week |
 |  |
Here is one approach to thinking about this area.

This looks at evaporation

This map which covers the West may be useful also.

In the list of references there are links to a number of sources for that information including importantly the National Integrated Drought Information System (NIDIS) which can be accessed here. It makes it easier to find the regional and state reports. I am on the mailing list for some of them and found the regional report for the West via a search engine.

Here is part of the explanation for the overall situation in the West. Looking at the information from the network of SNOTEL sites. These are mainly in remote locations often at high elevations. they report by telecommunications hence their name.


Then we look at how much snow there is to melt when it is warmer.

Now we show the week to week change information by region. The yellow is where the drought has been upgraded. The green is where the level of drought has been downgraded.
 |
Better in North and South Dakota and Colorado. Deterioration in Wyoming |
 |
| No Change |
 |
| No Change |
 |
| Deterioration in Texas. Minor Deterioration in Louisiana and Mississippi |
 |
| No Change |
 |
Changes in many states. For most of these states we provided individual maps earlier. But they will not enlarge this week. |
Some may find this way of looking at things useful and I hope these graphics are not too small to read. I did not make them so you could click on them individually but you can click on the whole graphic and it may enlarge. But I think you get the picture. It has been a rapid onset and hopefully it’s demise will also be fairly rapid. When you read these graphics remember that the older graphics are not the drought conditions that existed then but the change from then until now.

Some might find this animation of twelve weeks of change useful;

Here is the discussion which was issued with the Drought Monitor today.
Northeast
The region remains devoid of significant dryness, so none is depicted in the Drought Monitor.
Southeast
Dryness and drought only exist in southeastern Florida. Several tenths of an inch fell on northern sections of the dry area, and little or none fell on central and southern portions. No substantial changes in conditions and impacts were noted, so the Drought Monitor depiction remained the same as last week.
South
Little or no precipitation fell again this week on the southern High Plains, prompting broad D0 and more limited D1 expansion across the Texas Panhandle into adjacent Oklahoma, west-central Texas, part of the Big Bend, and the southwestern tier of Texas as far north as Sutton and Kimble Counties. Over the last four weeks, only about 0.1 inch of precipitation has fallen on much of the dry area from the northern Big Bend into the Texas Panhandle and adjacent Oklahoma, with the wetter spots recording up to 0.25 inch. Farther south, four-week totals of 0.25 to locally approaching an inch covered the southern Big Bend and upper southwestern Texas near the Rio Grande River. South-central and Deep South Texas received 0.5 to over an inch. The dry weather allowed for enhanced chances of significant wildfire activity in the Texas Panhandle and western Oklahoma.
Parts of Louisiana and small areas of adjacent Mississippi have dried out over the past 30 to 60 days. Dry weather has been most acute for the past 30 days from south-central Louisiana up into the coastal plain north of the Delta. Meanwhile, the last two months as a whole have been driest in southeastern parts of the state. D0 has been introduced in both of these regions even though time scales beyond a few months are markedly wet statewide.
Midwest
Once again, moderate to heavy precipitation covered most of the region, leaving dryness limited to a small area in northwestern Minnesota. Cold weather and frozen ground doesn’t allow for much change during winter, and Drought Monitor changes were introduced this week. Since late November, the only change made was a slight reduction in D0 coverage on the southern fringes of the dry region, equal to approximately 0.5 percent of the state.
High Plains
Although only light precipitation fell last week, and 30-day totals generally range from 0.5 to 1.5 inches, rainfall for several months now has been generally above normal, with totals so far this water year considerably above normal, much of which has fallen as snow in the past few months. Significant dryness now exists only on time scales exceeding one year. For these reasons, all abnormal dryness was removed from South Dakota and southwestern North Dakota. Improvement is lagging somewhat farther to the north, where D0 was left in place. Farther west, wet-season precipitation continued to outpace normal in most of central and western Colorado and adjacent southern Wyoming. Widespread above-normal mountain snowpack covers most areas. Conditions have now improved enough to finally remove the lingering D4 area in south-central Colorado, and improve the northern fringes of the D3 and D2 areas in western Colorado. Deteriorating conditions were limited to north-central Wyoming, where subnormal precipitation over the past several months prompted D0 expansion into the region; but even here, mountain snowpack was generally near to slightly above normal.
West
Potent storms tracked through the West Coast States this past week, pushing year-to-date precipitation totals above 6 inches in most of a broad region that includes areas along and west of the Cascades, the California coastline, the Sierra Nevada, and the Sacramento Valley. A few spots in the central and northern Sierra Nevada recorded over 30 inches of precipitation since the beginning of the year. Storms this past week were unusually cold and wet, dropping over 17 inches snow on Seattle in four days. Combined with snowfall earlier in the month, the first half of February brought 20.2 inches of snow officially to Seattle, more than 50 of the past 54 reported full-winter snowfall totals there. Farther south, up to 60 inches of snow piled up in the Sierra Nevada, and the continued abundant precipitation prompted more improvement in the Drought Monitor. The westward extent of D1 and D2 was decreased in western Oregon, and all dryness was removed from west-central California, including the Bay Area and vicinity. Other areas notably benefiting from the surplus precipitation and abundant mountain snowpack were in north-central Utah (where D2 coverage declined), and across north-central Arizona and adjacent southern Utah (where improvements resulted from D1 and D2 areas being retracted eastward).
Alaska, Hawaii, and Puerto Rico
A strong Kona storm system impacted Hawaii last week, but while strong winds were observed (up to 191 mph on the highest peaks of the Big Island), precipitation was not enough to bring any improvement to the areas of dryness and drought. Most areas were unchanged, but a large part of the Big Island felt deterioration as agricultural impacts have slowly intensified over the past few weeks. D2 was expanded in north-central areas, and D1 was pushed broadly eastward to cover most of the Big Island in at least moderate drought. Conditions remained steady in southeastern Alaska, with the D1 and D2 areas persisting, but changes were necessary in Puerto Rico, more often for the worse. Decent rains did allow for the removal of D0 from eastern parts of the Island, but intensifying dryness elsewhere prompted D1 expansion from central Puerto Rico through the entire western half of the southern coastline. Farther north, D0 was expanded to cover the northwestern part of the Island. The region’s primary reservoir is dangerously depleted. To maintain supply, authorities plan to implement a plan to cut off water to different parts of the area in rotation for 24-hour periods.
Looking Ahead
During the next 5 days (February 14-18, 2019) a large storm system is expected to bring another round of heavy precipitation to the Far West. At least 2 inches are expected in a broad area from the central Oregon coast and Cascades southward through both the higher elevations and coastal areas of California, plus much of the Sacramento Valley. More than 6 inches are forecast in much of northwestern California, and even higher amounts (7 to locally 15 inches) are expected throughout the higher windward elevations of the Sierra Nevada. Farther east, 1.5 to locally over 3.0 inches of precipitation are forecast for the higher elevations of central and southeastern Idaho, west-central Wyoming, southwestern and north-central Utah, western Colorado, and central Arizona, with highest amounts most likely in north-central Utah and adjacent areas. The remaining areas from the Rockies westward should see anywhere from 1.5 inches to just a few tenths of an inch (amounts generally increase with elevation). In the Nation’s mid-section, not much precipitation (a few hundredths to under 0.2 inch) is anticipated in the dry areas of northern North Dakota and Minnesota, and even less is forecast for areas of dryness and drought in southern Texas and the southern High Plains (most areas precipitation-free with small, isolated spots getting up to a few hundredths of an inch). Moderate rains of 0.5 to near 1.5 inches are expected in the dry areas in southeastern Florida.
Meanwhile, the Dakotas and most of Montana can expect much colder than normal conditions. Temperatures should average at least 10°F below normal there, with daily high temperatures 21°F to 27°F below typical seasonal values. A broad area is expected to see daytime highs at least 3°F below normal, from the Great Lakes and northern Ohio Valley westward through the central and northern Plains and all areas from the Rockies westward. Nighttime readings, on the other hand, should remain near or a little above normal outside the northern half of the Plains and northern Rockies. To the south and east, above-normal temperatures should prevail. Five-day average departures of +5°F to near +10°F are expected to cover most of Texas, the central Gulf Coast, most of the Southeast, portions of Florida, and the southern mid-Atlantic region.
According to the 6- to 10-day forecasts from the Climate Prediction Center, February 19-23, 2019 will bring enhanced chances for surplus precipitation to most of the Nation. Odds tilt toward dryness only in Maine and northwestern California, and neither precipitation extreme is favored in the central West Coast States, part of the northern Rockies, most of the Great Lakes region, northern New England, and the southern Florida Peninsula. Wet weather is favored elsewhere, with the highest chances (70 percent, compared to a climatological frequency of 33.3 percent) in the Carolinas, northern Georgia, and adjacent areas. The Southeast is also expected to average warmer than normal, with odds exceeding 80 percent in the central and northern Florida Peninsula. A much larger proportion of the country has enhanced chances for subnormal temperatures, specifically across the Northeast, the Great Lakes, and from the Plains westward to the Pacific Ocean. Odds for colder than normal weather reach 90 percent in a large part of the interior West from eastern sections of the West Coast States through roughly the northwestern two-thirds of the Rockies. Like most other parts of the country, odds favor cooler and wetter than normal conditions, though with less extreme chances.

Soil Conditions as of January 31, 2019
|

| And looking at the West. |
|

Wildfires are still possible. But the risk is not high right now.


And we do not want to ignore floods. The updated map can be obtained here.

3. Last Week’s Weather
The maps in this section are synchronized with the crop report. We now have the weather information but not yet the crop reports.


This is more current but less informative.
 This
This
Current Week
For reference purposes here is the precipitation information for the prior seven days. It is not the same as what is shown in the USDA Crop Report when it is published since the crop week covers the Sunday to Saturday period which corresponds to the crop reports. The below is the current seven-day period and updates in this article automatically every day.


4. Current Forecast for Precipitation and Drought.
First we show the current month and then the Seasonal Forecast through April which was issued on January 17, 2019 with the full Seasonal Outlook. These two forecasts are sued by the same agency but to obtain them you need to access two different links here and here. We either show the latest or both in this report. Sometimes we show them in more than one place in this report for the convenience of the reader.

And here is the longer seasonal drought forecast which was issued on January 17, 2019. It will update on February 21, 2019. It will be discussed in more detail in our Two-Part Report on the new NOAA Seasonal Outlook.

And now the current precipitation forecasts so that we can make our own assessment of the drought forecast. Here I provide the weather forecasts for different periods of time in which should allow the reader to assess the likelihood of this forecast working out as shown over the next three to four weeks. Since we publish this week on Thursday, we update the discussion for the Week 3 – 4 forecast when it is updated on Friday. This is important as the current Day 6 – 14 forecasts and the week-old week 3 – 4 forecast overlap to some extent.
First weather hazards


Additional information can be obtained here. We also now publish a Live Severe Weather article which can be accessed here. The link to our Severe Weather Events article changes every Sunday night and the current version can always be found in the directory which can be accessed here.

Now the Temperature Forecast .
| | | |
| This shows magnitude rather than probability of being higher or lower than Normal and shows the middle day of the five day period. | Looks like the Western 2/3rds of CONUS will be cool* during Week – 1 and Week – 2. The stagnant pattern persists . * warmer or cooler than climatology | ↑ ← The Week 3 – 4 forecast was updated on Friday February 15, 2019. May not make everyone happy but cool West is good for repairing drought. It may delay mountain snowmelt however
| |
And then the Precipitation Forecast
| | | |
| The five day QPF is shown above. The units are different than the other maps i.e. in units of precipitation (inches) not probabilities of exceeding or being less than climatology. | It is generally wet. But at times, West Texas and California will be dry. The updated forecast on Friday indicates less so for Texas and more so in Week – 2 for the entire West Coast. | ↑ ← The Week 3 – 4 forecast was updated on Friday February 15, 2019. No impact on Core Drought Area other than ceasing of higher than climatology precipitation. Concern about Potential Southeast Flooding. | |
Here are two other useful graphics from my weekly report which update automatically.
First the Day 3 Mid-Atmosphere pattern.


The below is of interest.

5. U.S. Crop Information
 |
 |
 |
 |
| Good | OK | Bad |
| Oats, barley, spring wheat, rice, soybeans, canola, sugarcane, oranges | corn (equal to 2017 record yield but slightly less acres), sorghum, sunflowers | winter wheat, hay, peanuts, cotton, sugarbeets. |
Impact of drought on important crops (the percentage impacted is shown at the top of each graphic)


6. International Crop and Weather Related Information


7. Prior Month and when available the Current Month-to date Weather (excluding prior week)
Current Month to Date.

And then temperature:

You can generate a wide variety of different graphics here.
8. Science Theme When we Have One.
No Science Theme this week.
9. Economic Impacts
Energy prices depend on the weather. In this case the seem to depend on the forecasts which means model discrepancies.
10. Additional Reference Information
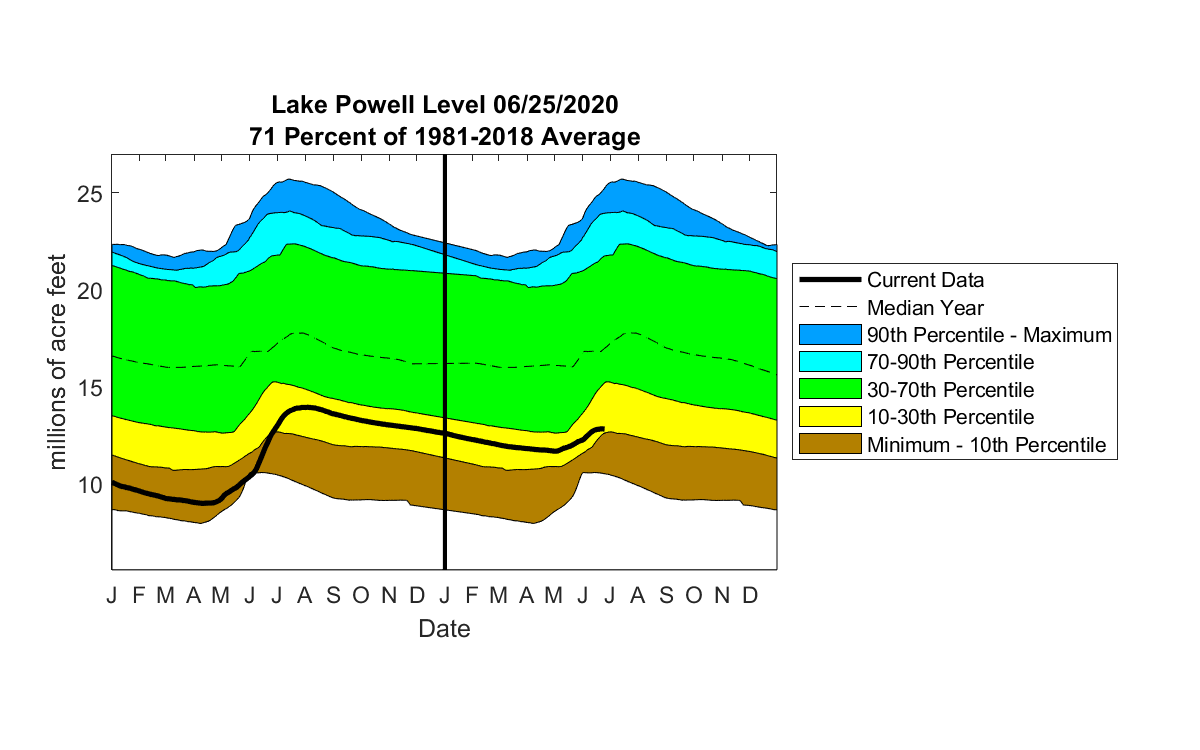
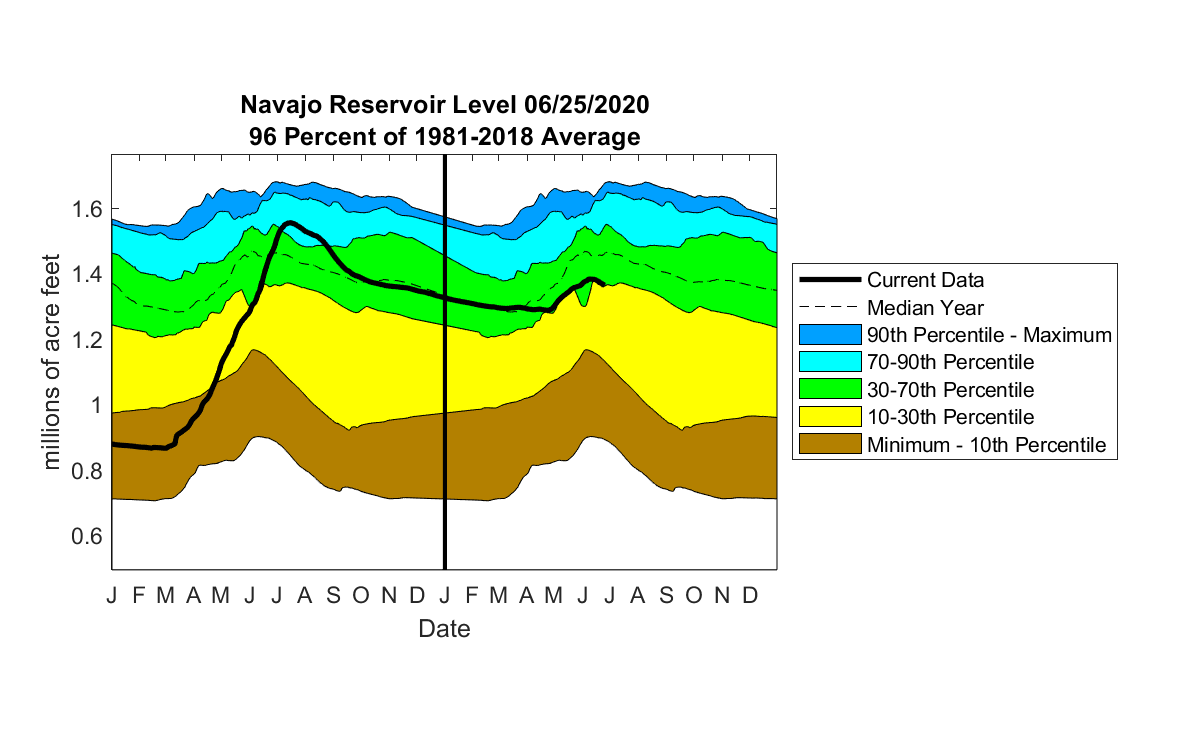
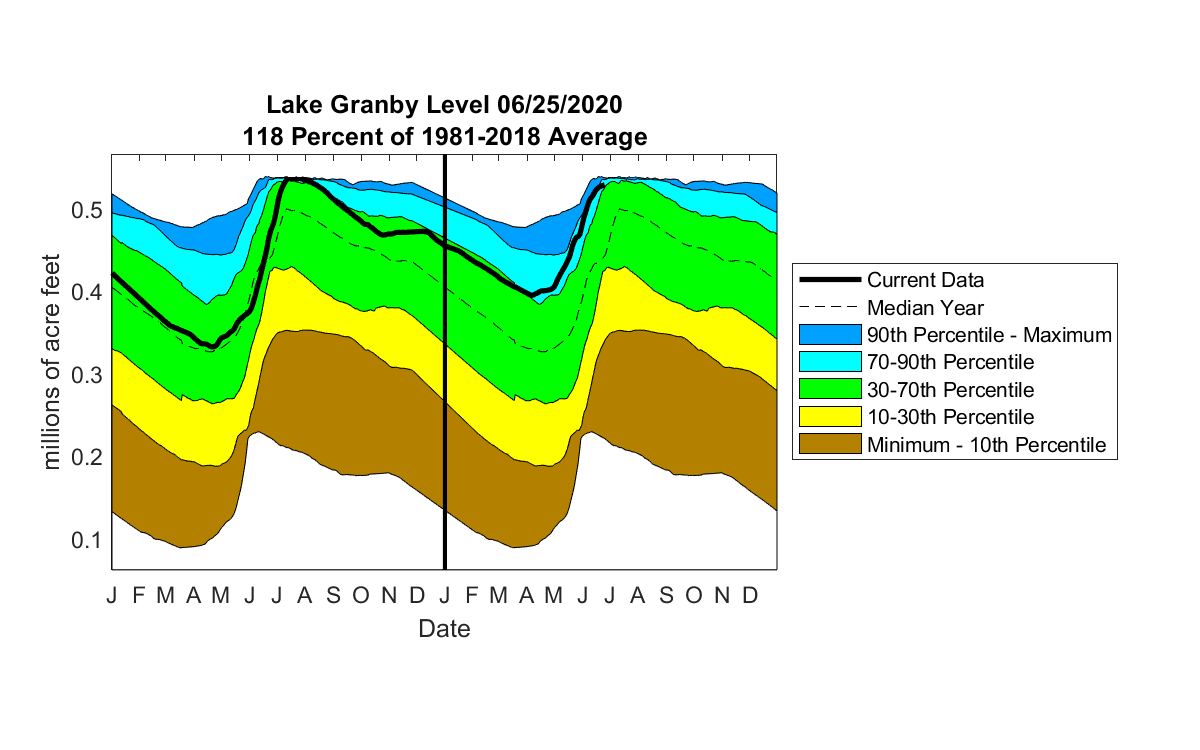
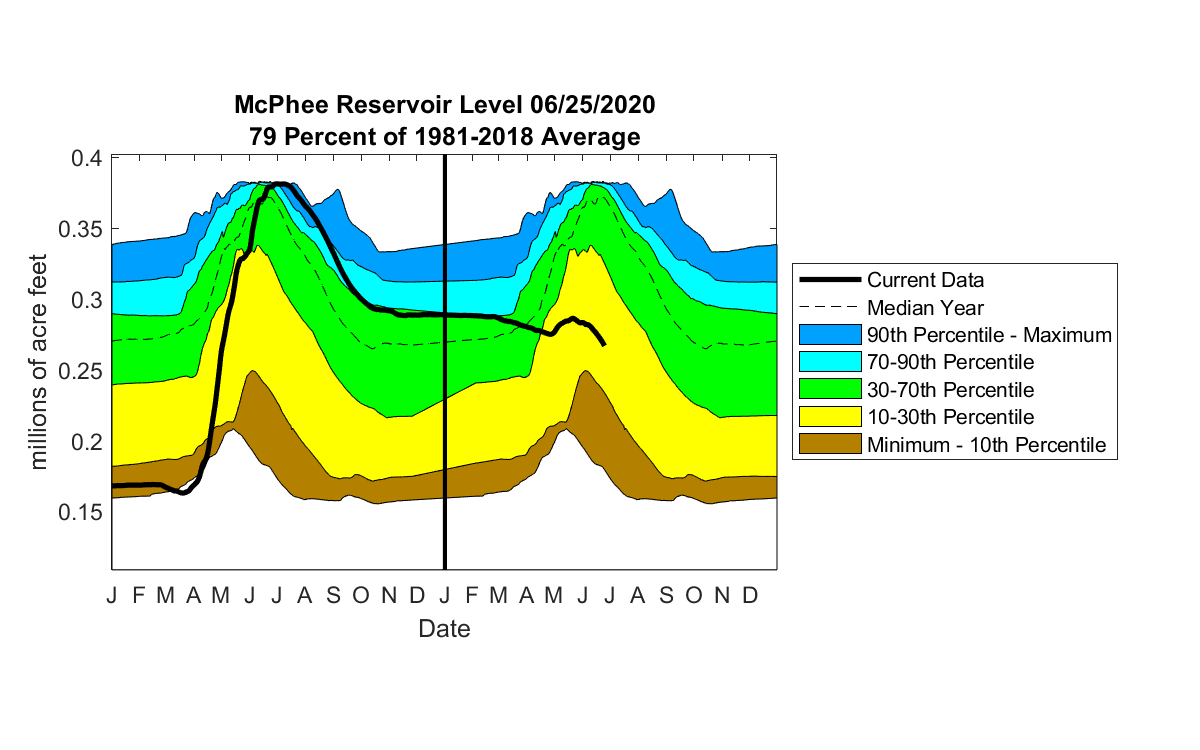
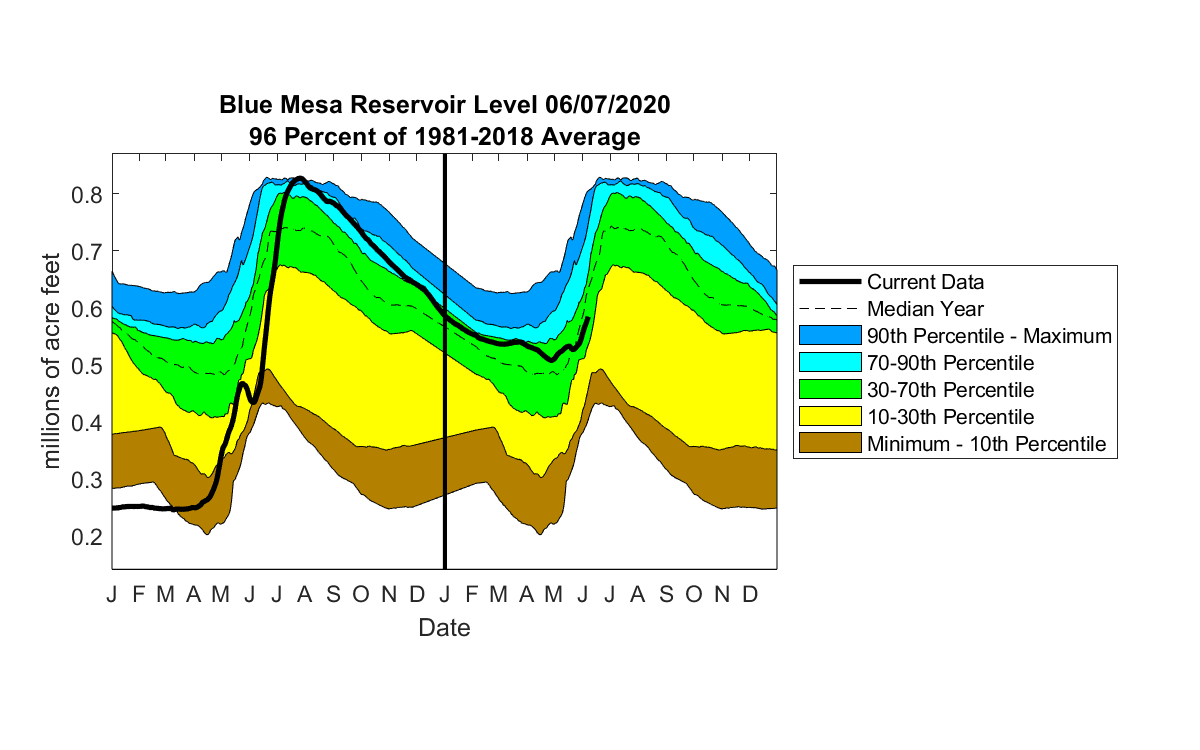
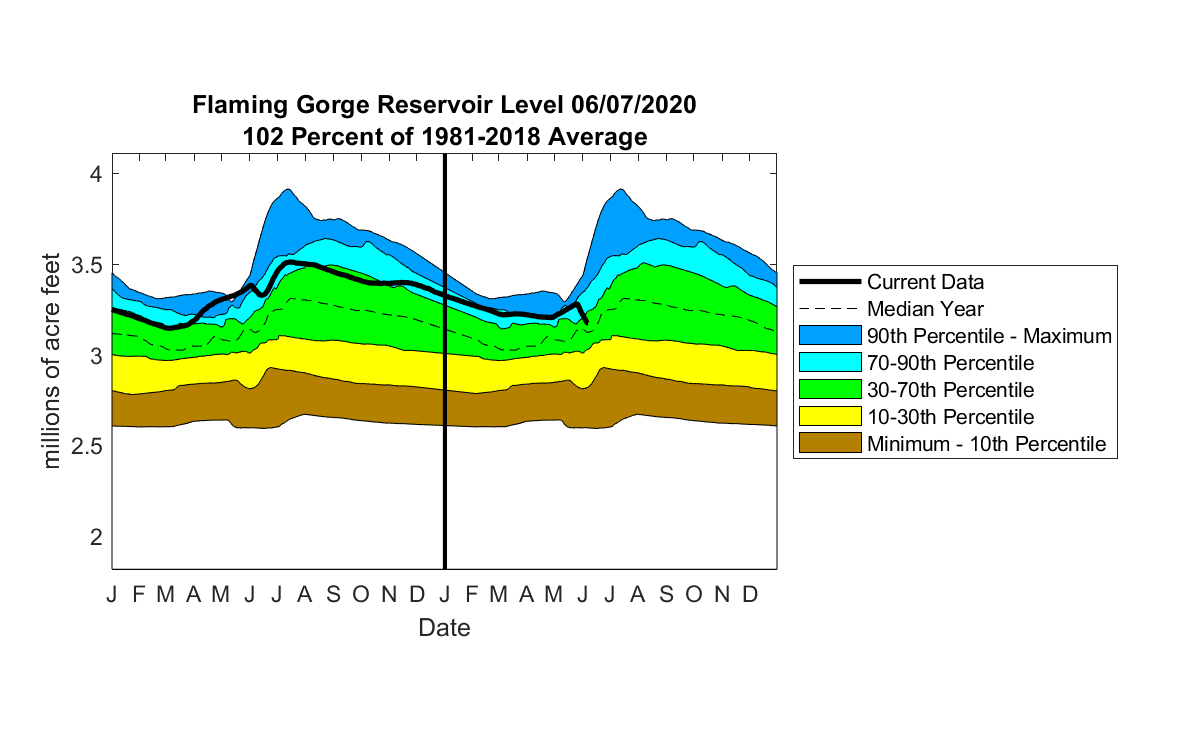
Reservoir Status. This will now be updated as we receive new graphics which is not weekly. We updated most of the graphics this week.
Reservoirs and Stream Flow

Let us look at California

We update these graphics when we receive new ones. They do not auto-update. They tend to change slowly.

This article provides a little background on the problem.
This is not as graphically pleasing. Updates can be obtained here.

We have added more rivers to the discussion. Above we have reservoirs and they are of course connected by rivers. Both are important and provide insight.
Below is a more complete description of


Sequence of drought occurrence and impacts for commonly accepted drought types. All droughts originate from a deficiency of precipitation or meteorological drought but other types of drought and impacts cascade from this deficiency. (Source: NDMC)
Source: National Drought Mitigation Center, University of Nebraska-Lincoln


