Written by Sig Silber
We compare the forecasts for CONUS and Alaska and also present the JAMSTEC forecasts for the rest of the World. It is a confusing situation. Somewhat subtle differences in the forecasts for the possible evolution of an El Nino may explain the substantial differences in the weather forecasts issued by these two respected agencies. In this report, we describe both the differences in how the two Agencies see this warm phase of ENSO evolving and the different weather forecasts that they have come up with for Spring, Summer and Fall.

Part of the explanation for the differences in the forecast is that when the state of ENSO is indecisive, the ability to made decisive forecasts is much reduced. JAMSTEC tends to be all in with their ENSO forecast while NOAA hedges their bets.
See also Part I of this article.
A key index regarding seasonal weather forecasting is the Nino 3.4 Index which measures sea surface temperatures (SST) in a particular part of the Eastern Pacific. NOAA forecasts stable or slowly declining Nino 3.4 Index levels from that which currently marginally qualifies as an El Nino pattern through Summer and into Fall. I do not have a longer forecast from NOAA. JAMSTEC forecasts a fairly step rise essentially immediately followed by a more rapid decline for four seasons arriving at the totally Neutral point by the end of this year and then next year approaching La Nina Levels. Both NOAA and JAMSTEC believe the atmosphere will “couple” with the Nino 3.4 El Nino pattern (respond to in a way that modifies the pattern of rising and subsiding air along the Equator) to create true El Nino Conditions. It seems that JAMSTEC is more certain of this than NOAA (see quote at the beginning of the body of this report).
Please share this article – Go to very top of page, right hand side for social media buttons.
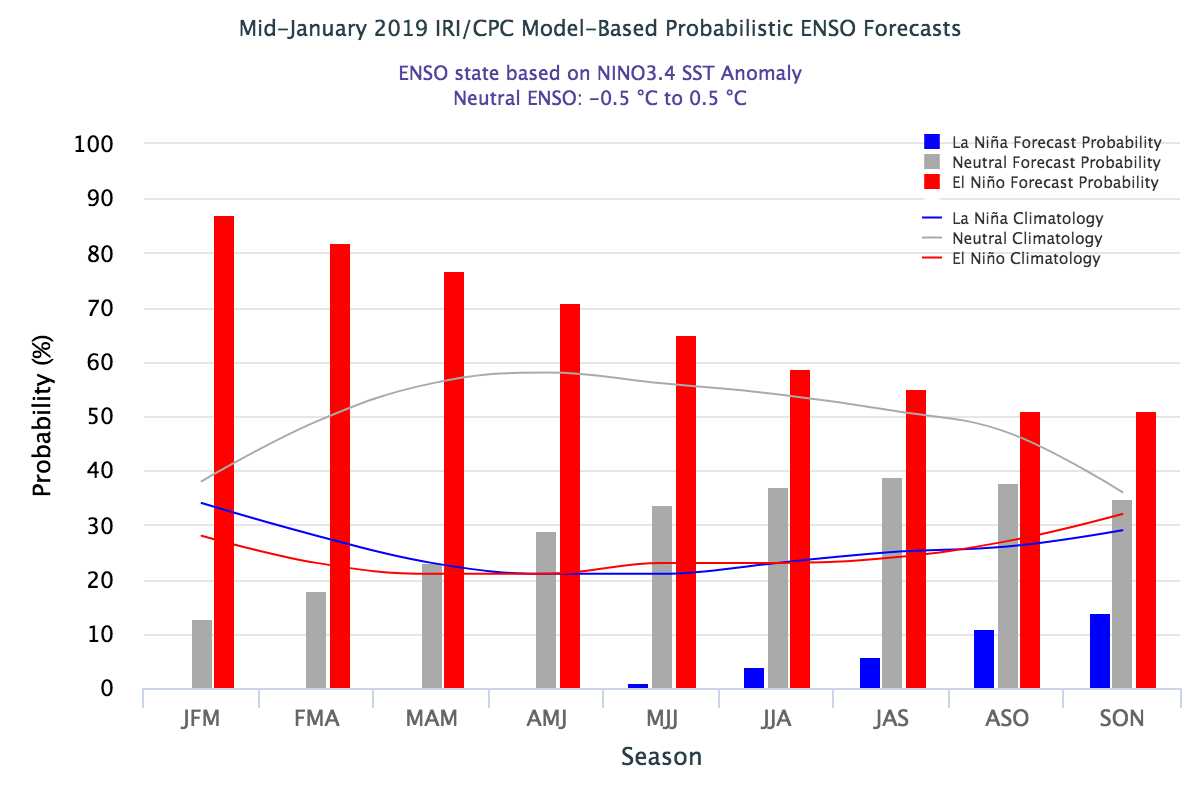
IN THE NEAR-TERM, THERE IS NO OBVIOUS INDICATION THAT THIS LONG-AWAITED OCEAN-ATMOSPHERE COUPLING WILL TAKE PLACE BEFORE THE END OF BOREAL WINTER. THE FMA 2019 SEASONAL OUTLOOK IS THEREFORE BASED PRIMARILY ON THE EXPECTATION OF CONTINUED ROBUST MJO ACTIVITY WITH LESS OF AN INFLUENCE ANTICIPATED FROM A WEAK (OR NOMINAL) EL NINO THAT MAY STILL FORM. ACCORDING TO THE LATEST ENSO DIAGNOSTIC DISCUSSION ISSUED BY CPC ON 10 JANUARY 2019, THERE IS A 65% CHANCE THAT EL NINO WILL FORM AND CONTINUE THROUGH THE NORTHERN HEMISPHERE SPRING 2019. HOWEVER, IT APPEARS THAT ANY EL NINO THAT DOES FORM WILL ONLY BE OF NOMINAL OR WEAK INTENSITY.
We previously published Part I of this report which included all of the NOAA maps that were issued on January 17, 2019. The full report can be accessed here but what we have below may be sufficient for most readers. The full report contains a longer-term forecast (15 months) but much of that (Spring, Summer and Fall) is repeated in this report via the comparison with JAMSTEC.
But for those who missed Part I and do not wish to go back to take a look, the below are the forecast maps for February and the three months of February/March/April. Remember that NOAA will update the February forecast on January 31, 2019 and we will report on that either that day or the following day. Part II of our report is more focused on the longer term of Spring, Summer and Fall. There is some overlap as Spring starts in March.
| Temperature | Precipitation | |
| February |  |  |
| Three Months |  |  |
The three-month drought forecast map was also issued on January 17. 2019. A drought forecast for February only will be issued on the last day of January which is just eight days from now. When issued, we will provide it that day as part of our “Weather Impacts on Economic Activity Report” formerly called our Drought Report but now gradually expanding to include other weather impacts on the economy.

This report is organized into a summary that has two tables of graphics that show the temperature and precipitation forecasts for the upcoming three seasons, A brief discussion of the ENSO assumptions by both NOAA and JAMSTEC and then the NOAA and JAMSTEC Agency discussions and then a comparison of the two forecasts which is basically an expansion of the summary table.
Summary of the NOAA and JAMSTEC Forecasts
For those who want a quick synopsis of the two forecasts, below is a summary of the temperature and precipitation forecasts for three time-periods and from left to right the NOAA forecast for Alaska and CONUS (the contiguous mid-latitude U.S), then JAMSTEC for North America (which includes Canada and Mexico), and then JAMSTEC for Europe and surrounding areas. Larger graphics are provided later in the report. (the graphics in the SummaryTable are not set up to be clicked on to enlarge but all graphics can generally be enlarged by right click and view image). The Summary Table is kind of a tease to keep you reading but you can see the evolution of the weather pattern through Spring, Summer and into Fall. For some readers, these two sets of summary graphics may be all the information they wish to look at and that is fine.
Temperature
| NOAA Alaska Plus CONUS | JAMSTEC North America | JAMSTEC Europe | |
Spring Temp MAM | 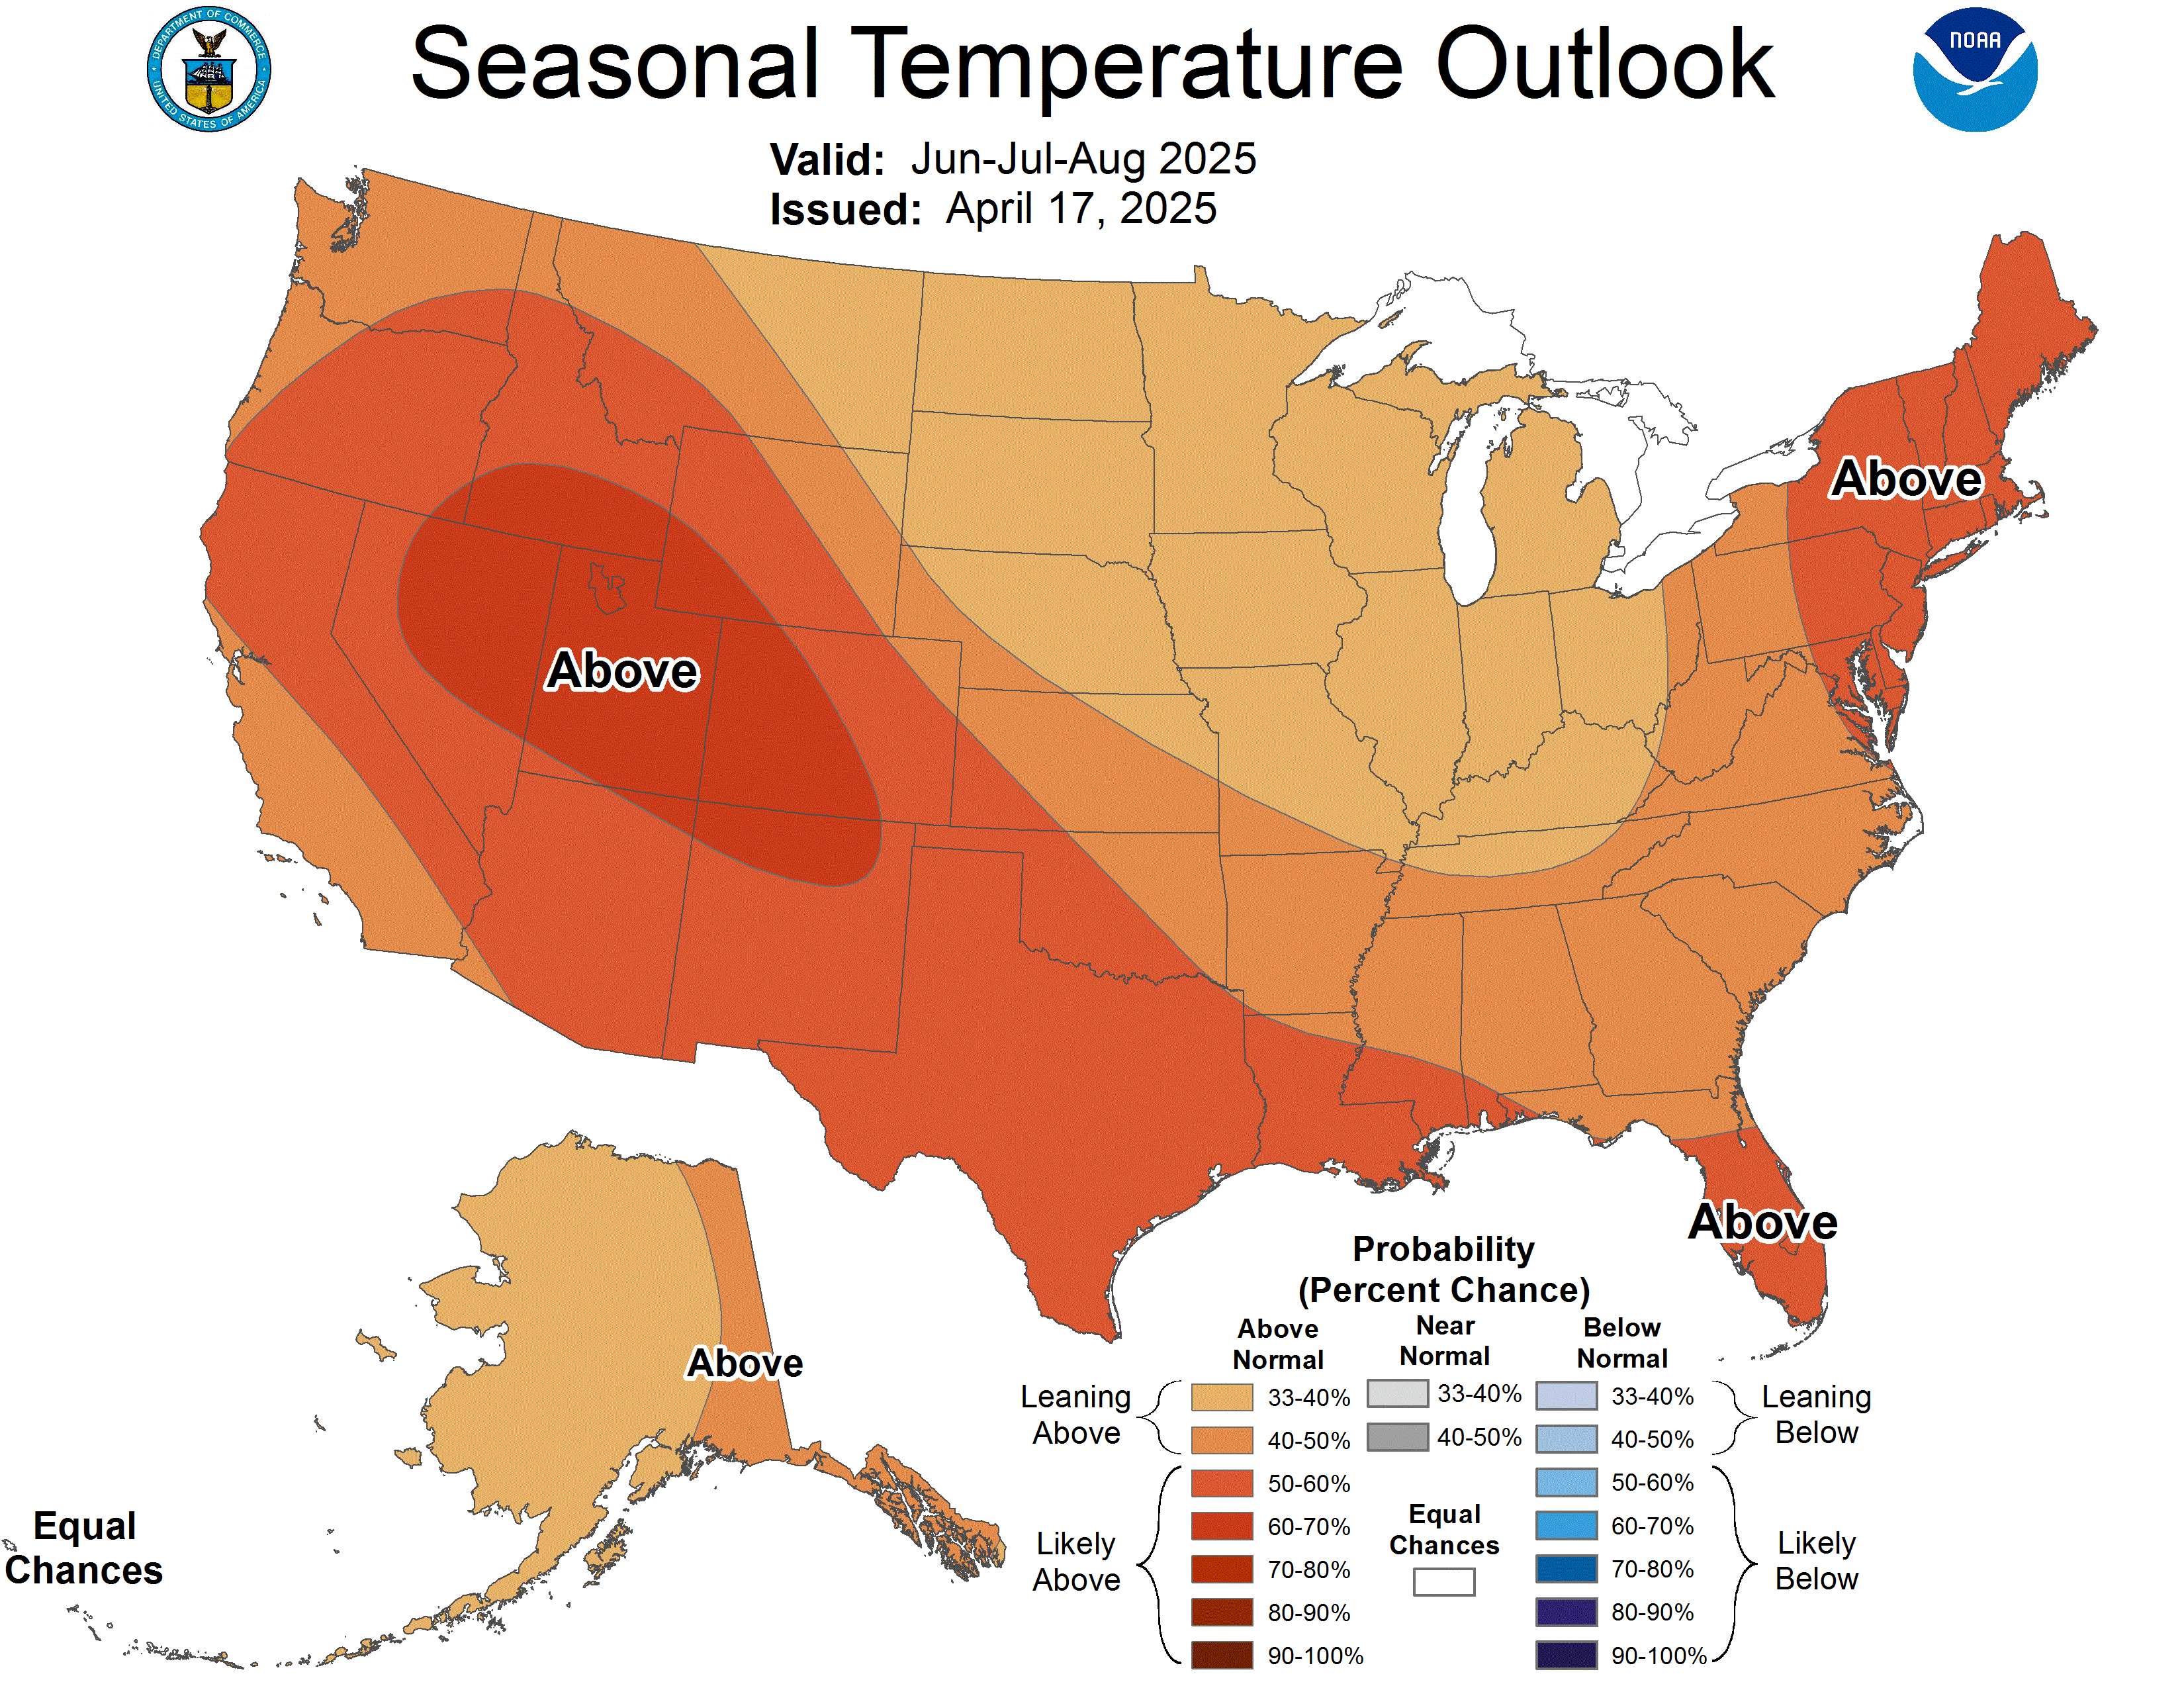 |  |  |
Summer Temp JJA 2019 | 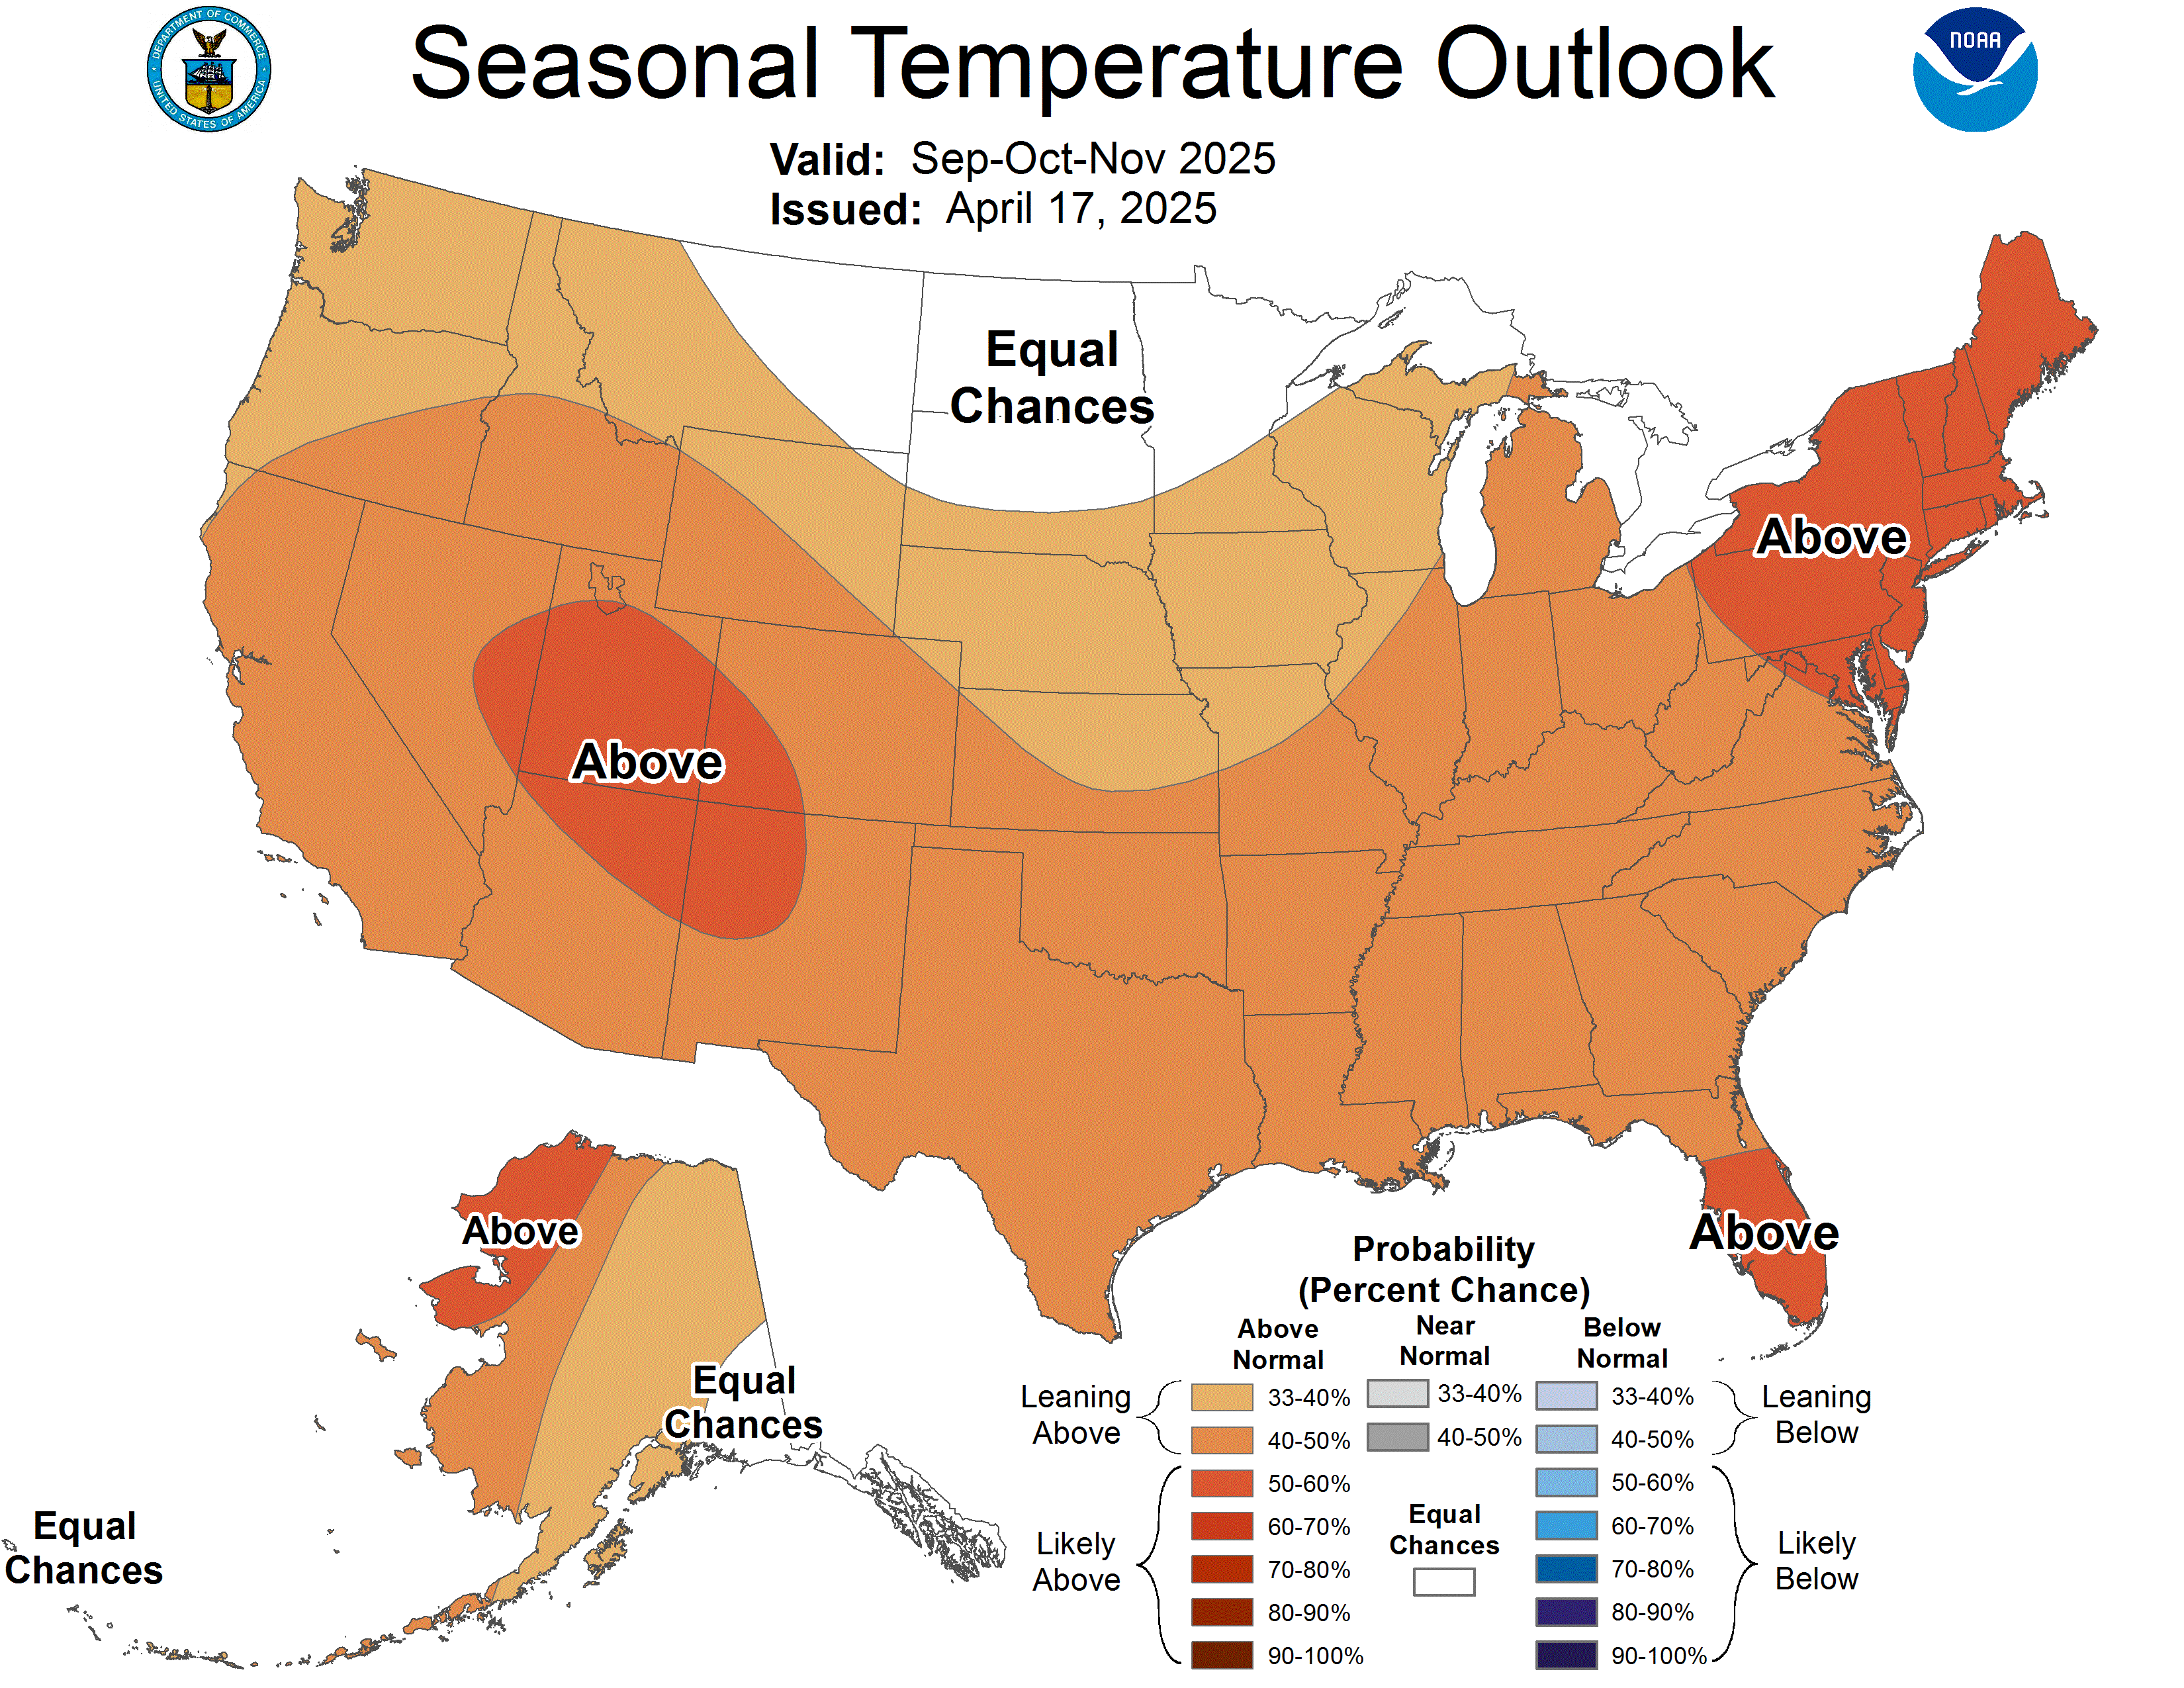 |  |  |
Fall SON 2019 | 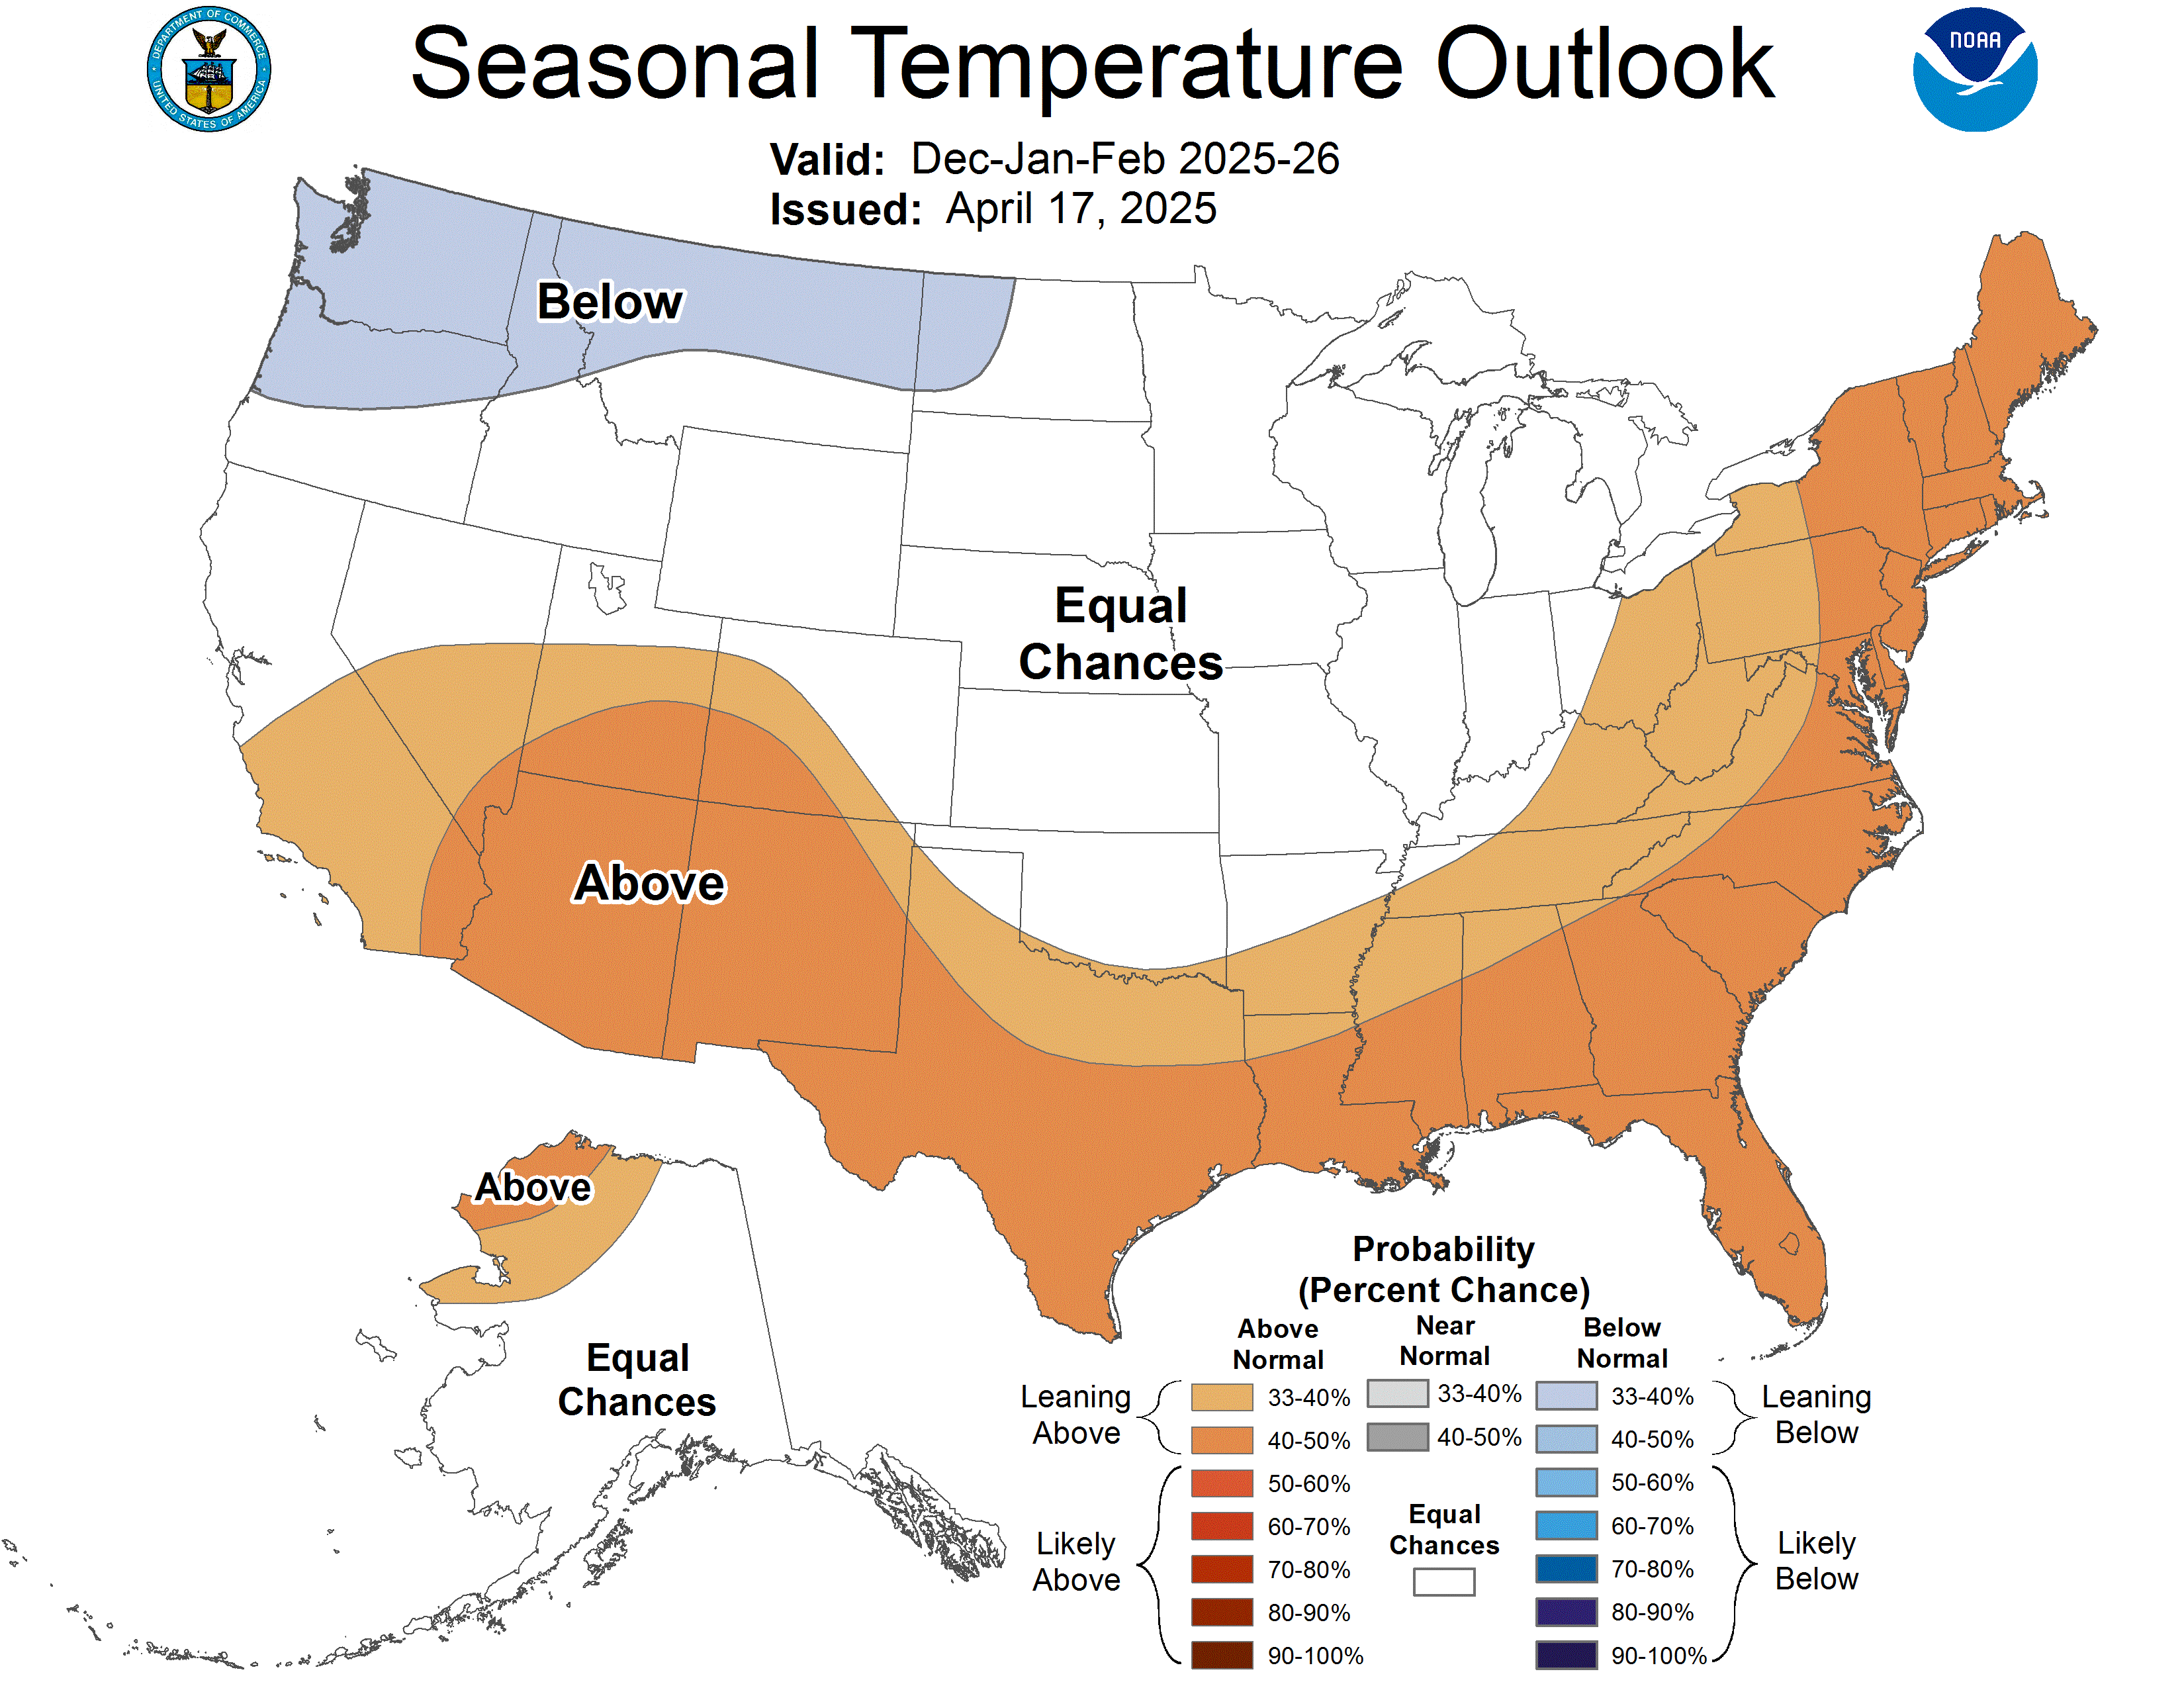 |  |  |
Precipitation
| NOAA Alaska Plus CONUS | JAMSTEC North America | JAMSTEC Europe | |
Spring Precip MAM 2019 | 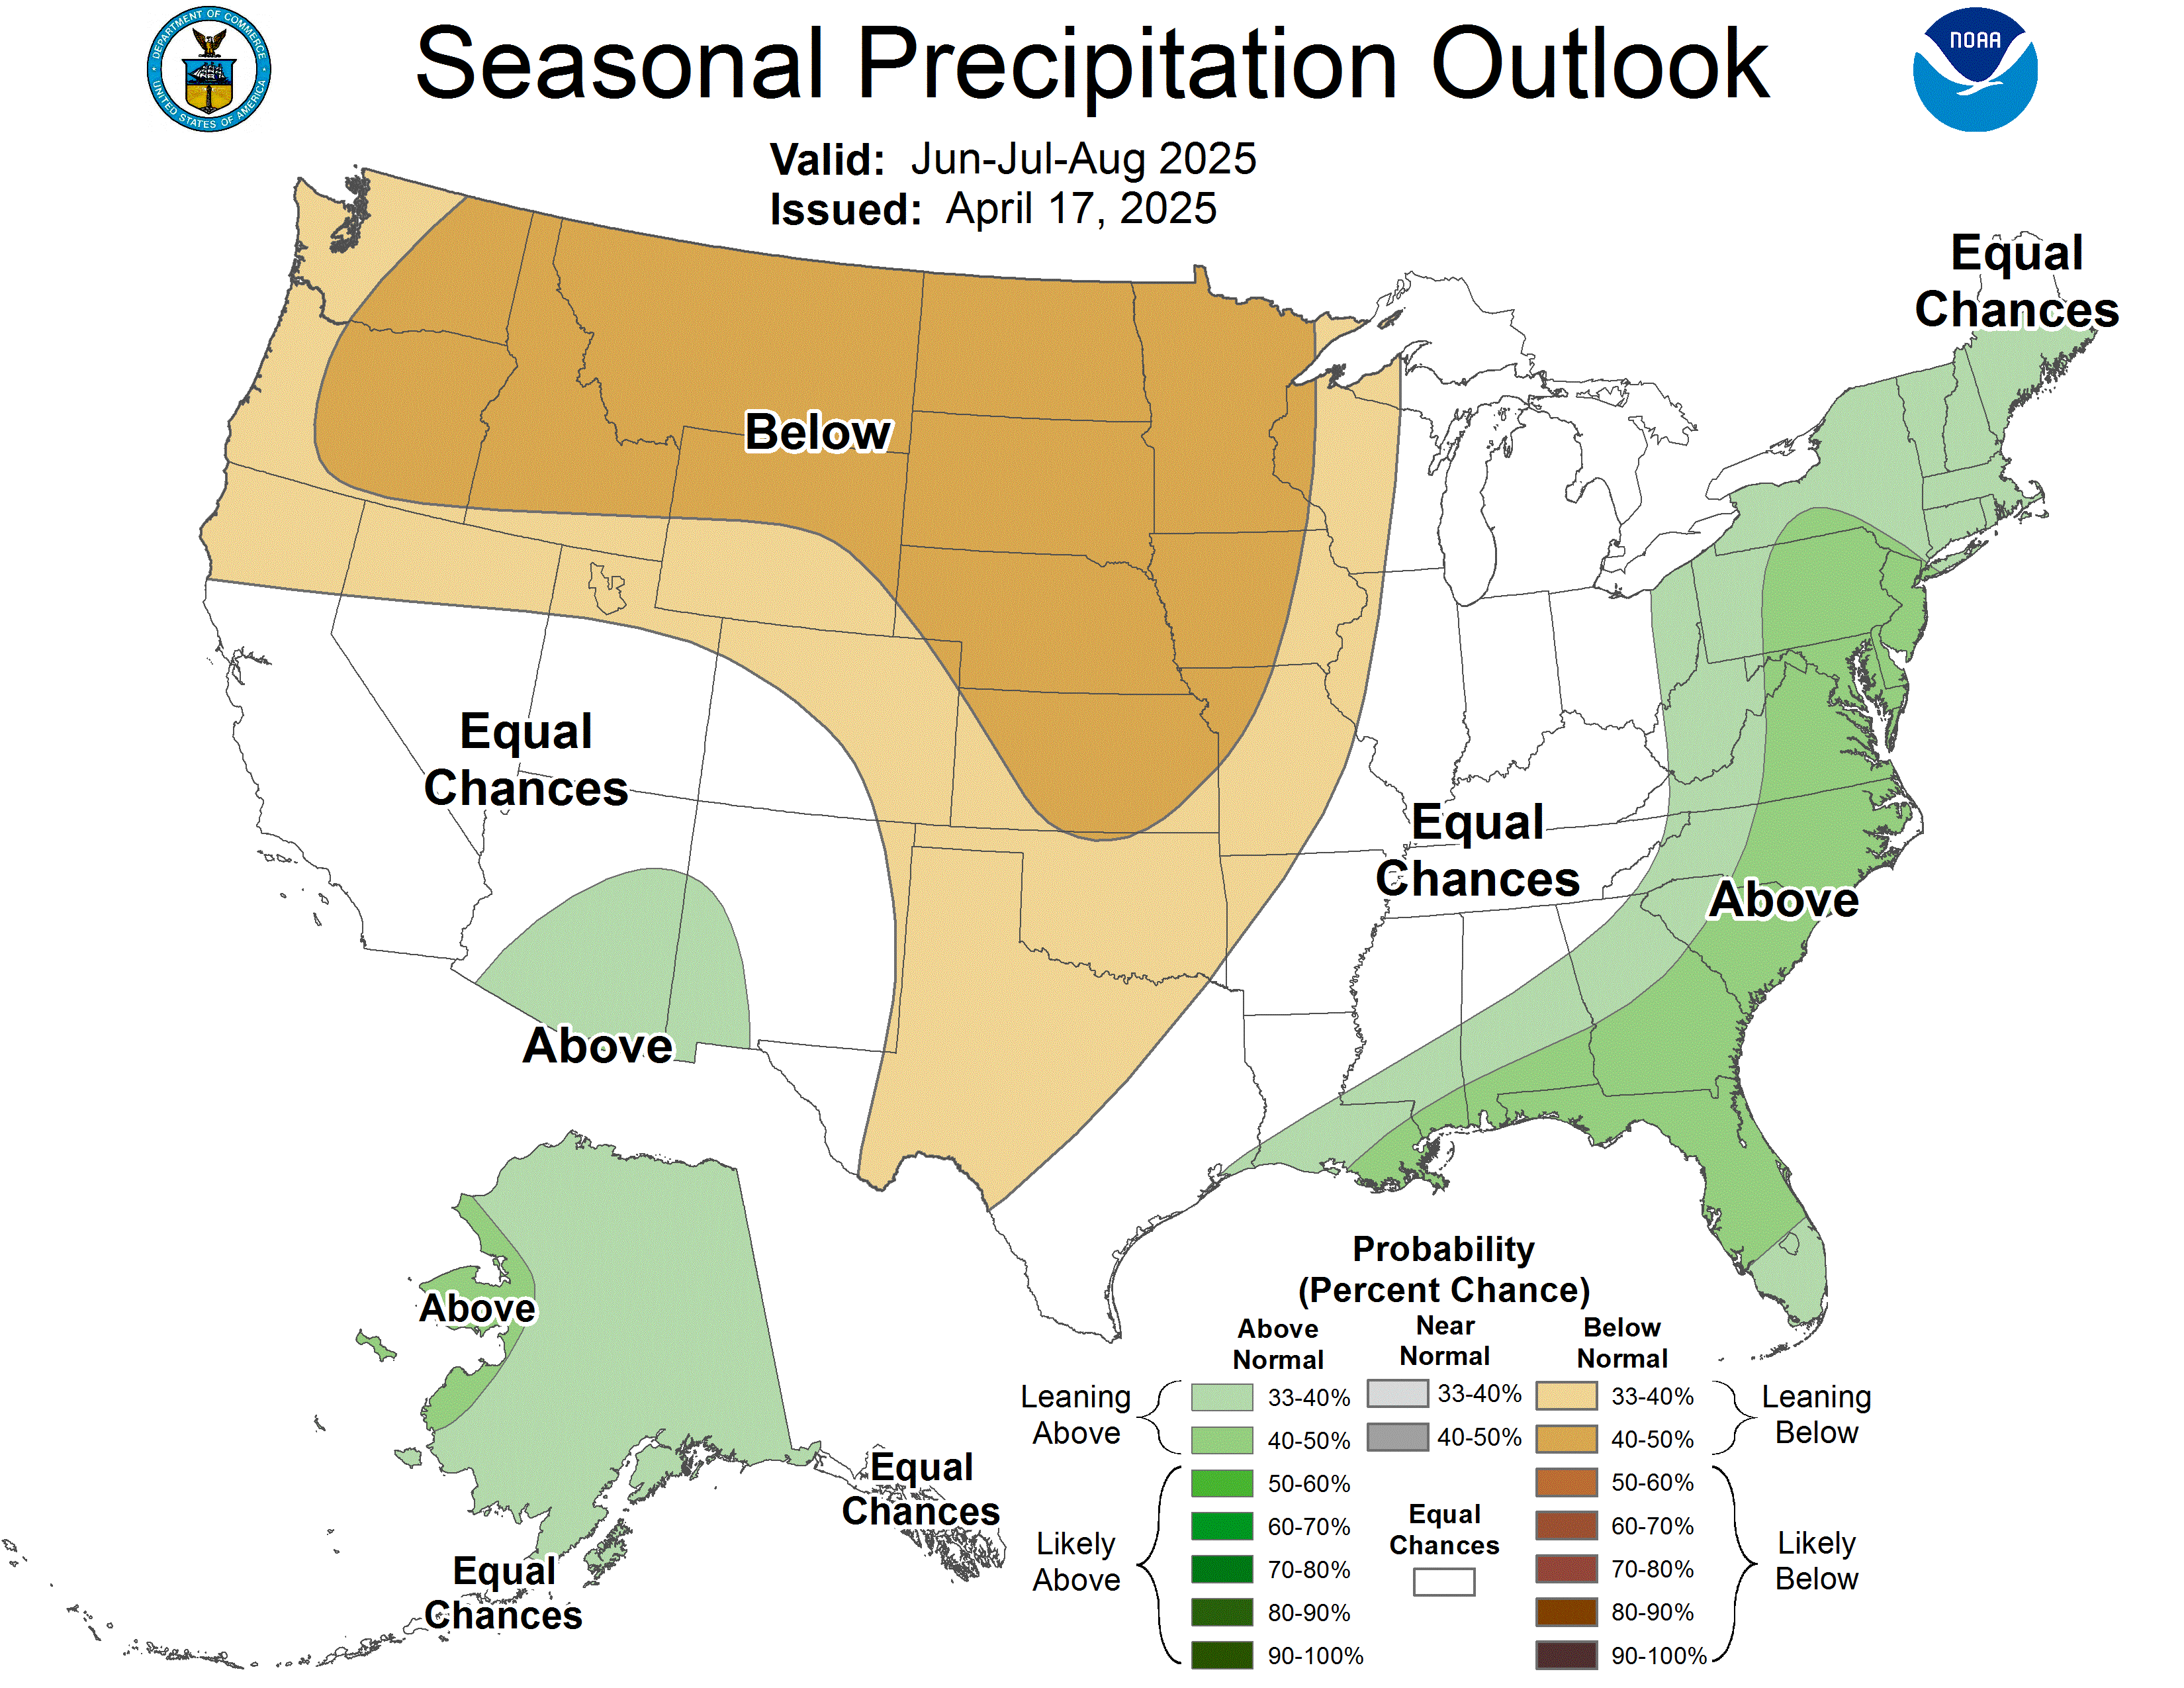 |  |  |
Summer Precip JJA 2019 | 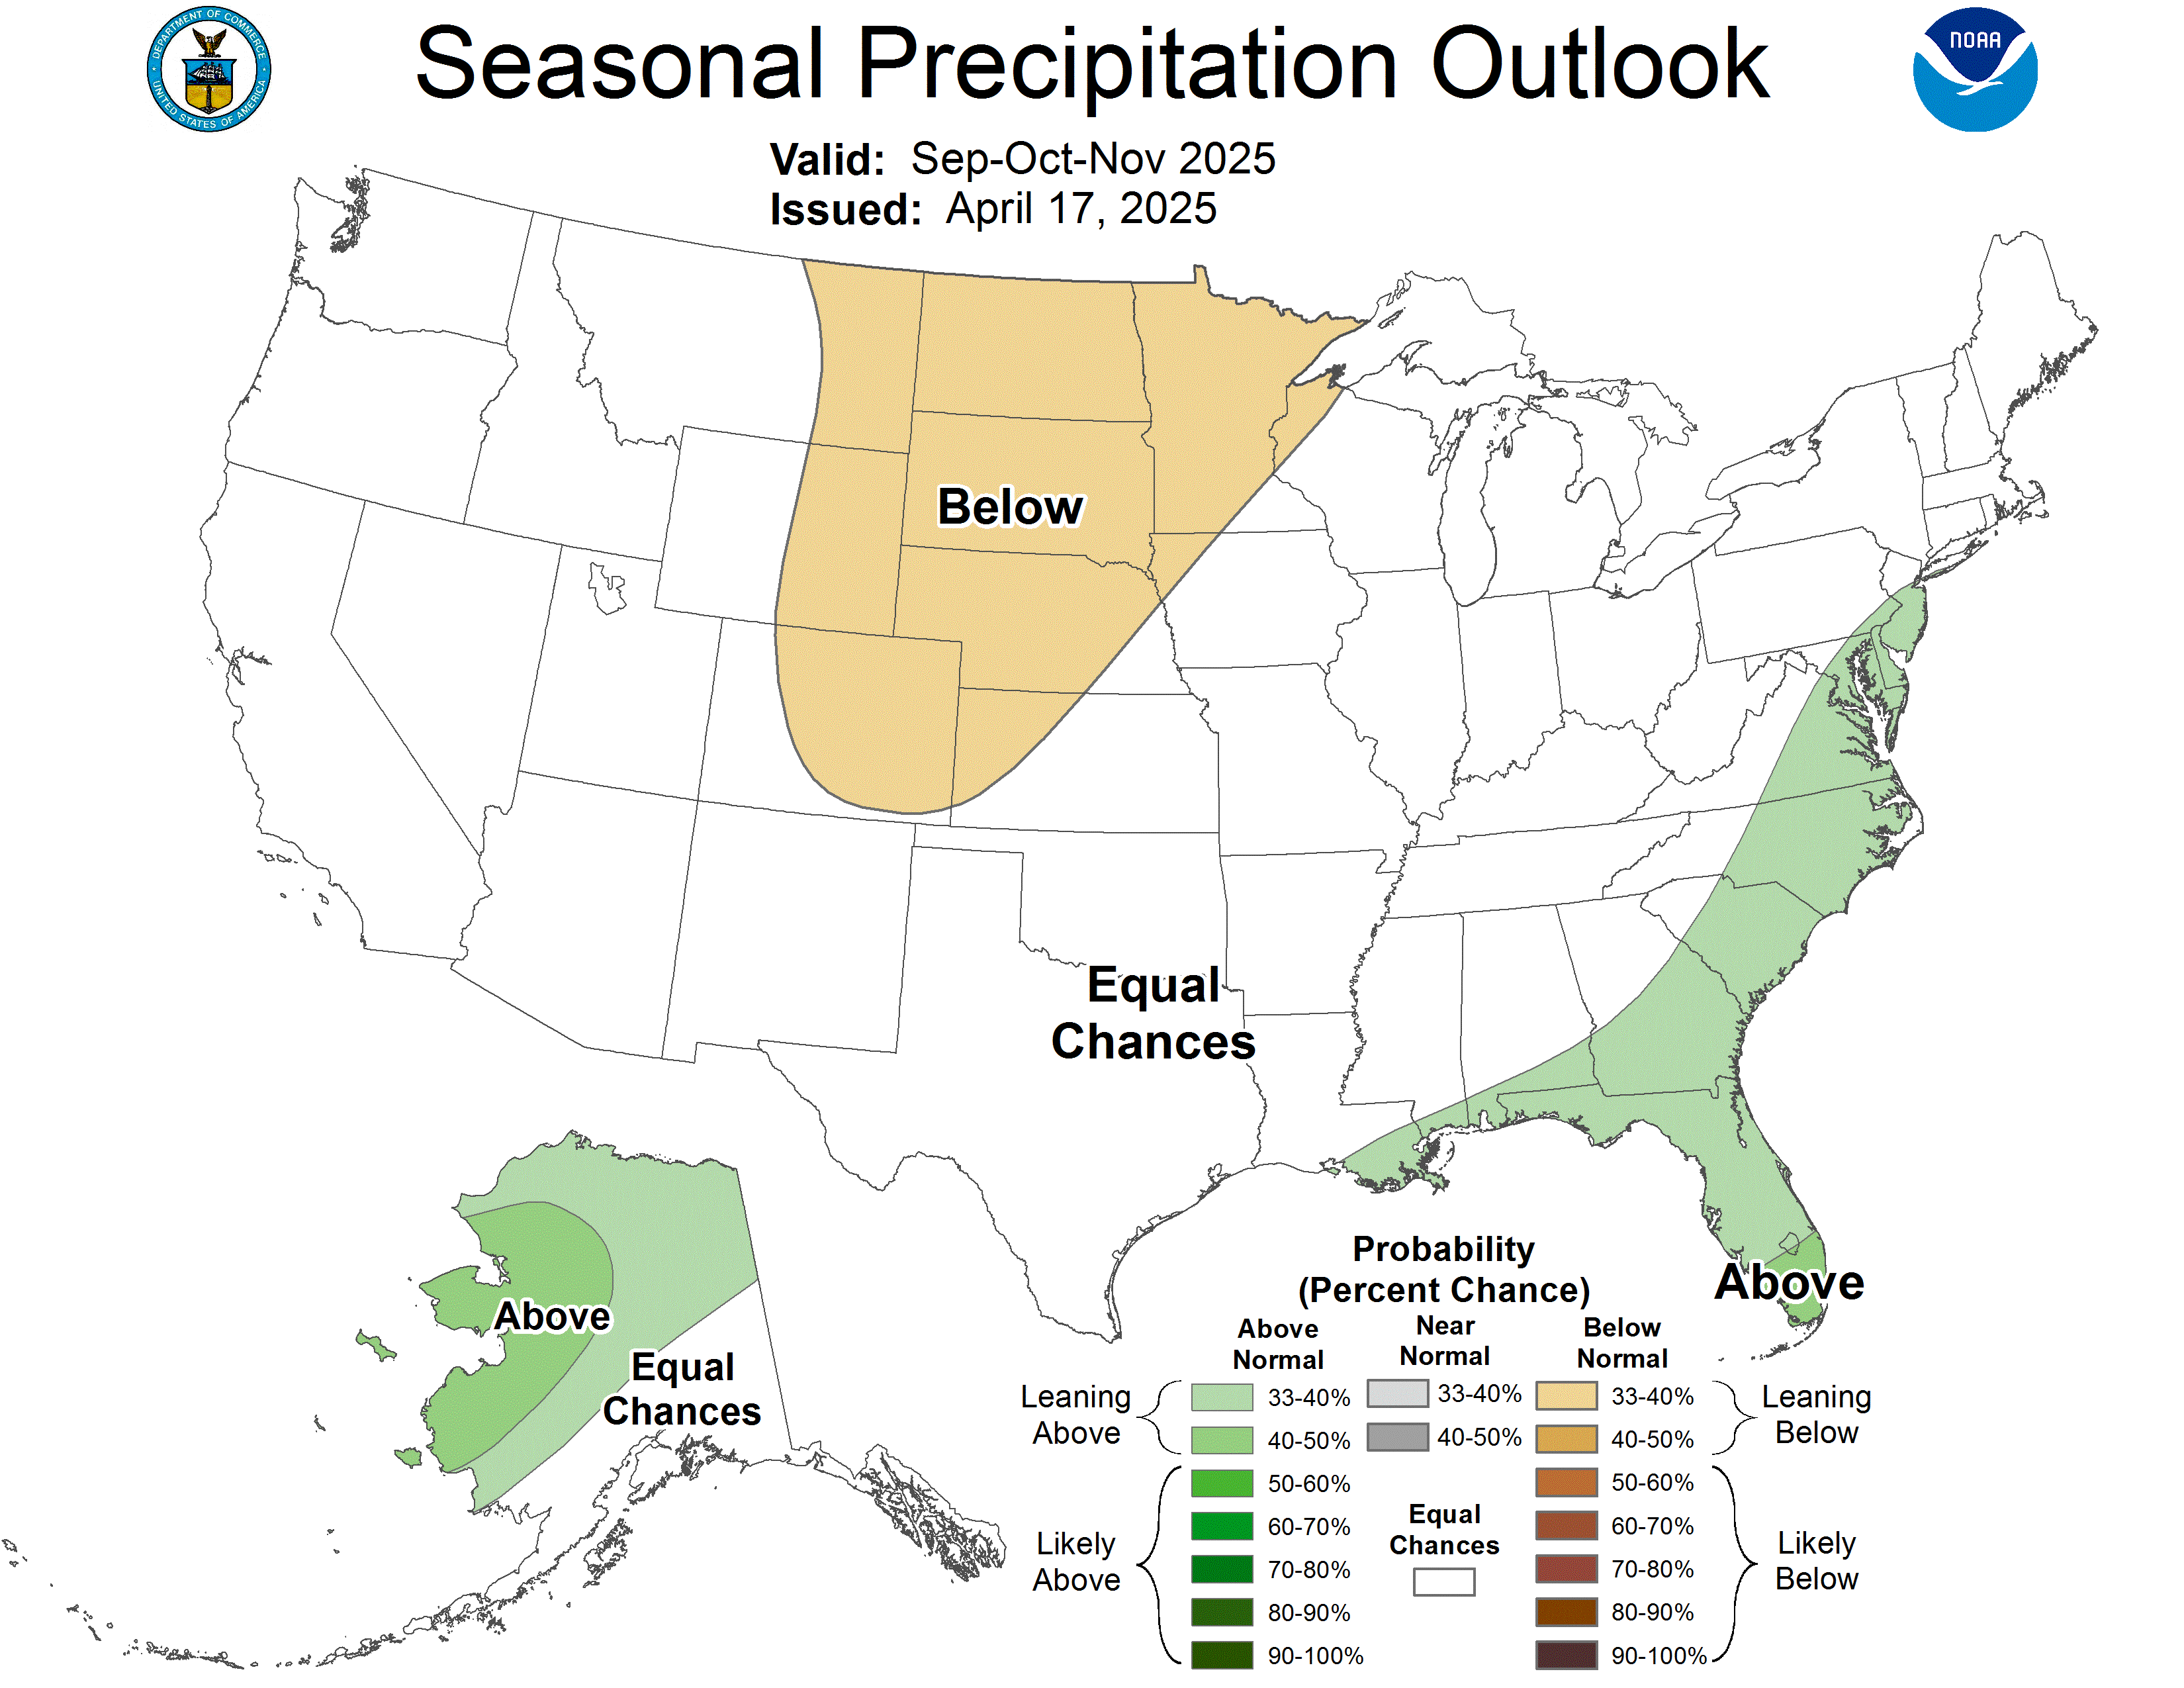 |  |  |
Fall SON 2019 | 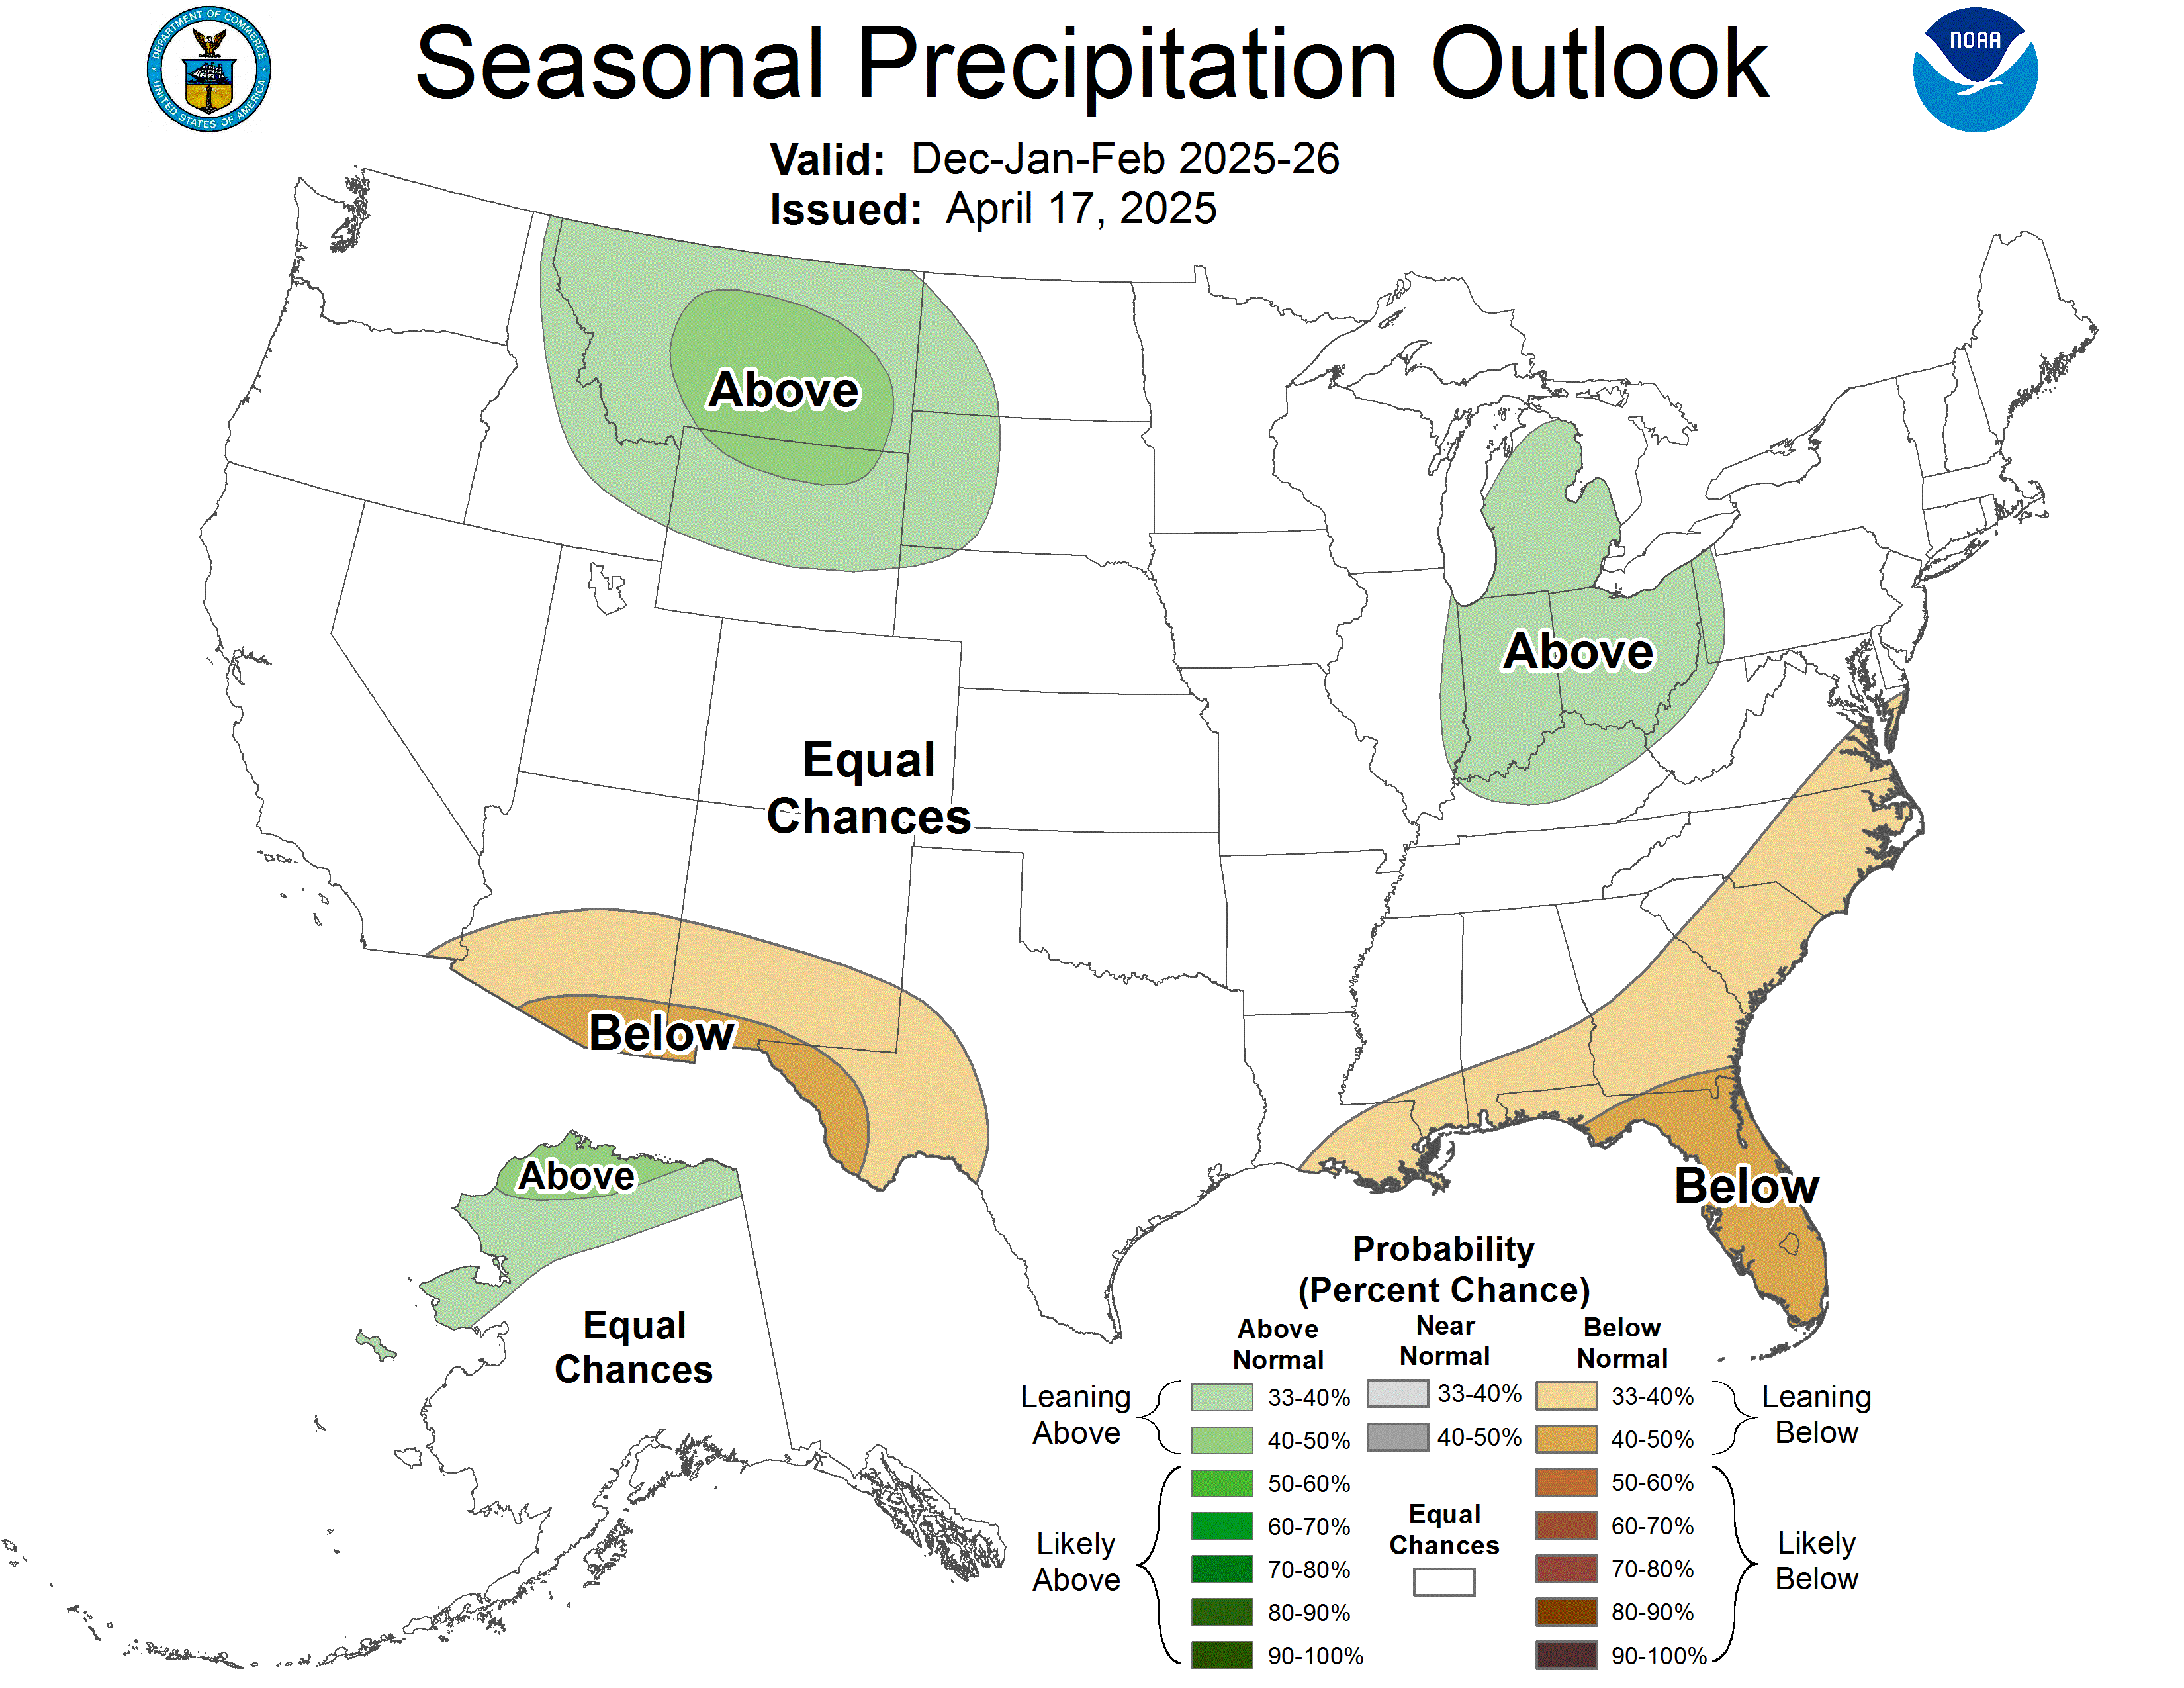 |  |  |
It is useful to look at the forecasts for the Nino 3.4 Index used to determine if the Sea Surface Temperatures meet the criteria for an El Nino(+0.5 C or higher). Here is a brief summary of the Indices of the two Agencies and how they compare.
| One Year | JAMSTEC Two Years | |
| JAMSTEC |
|
|
| CFS.v2 | CPC-IRI Probabilities | |
| NOAA |  |
|
| Comparing the one year JAMSTEC NINO 3.4 above to a similar period for the NOAA model one sees the difference between a peak and decline versus a more steady state. | The IRI/CPC forecast uses different units namely probabilities rather than absolute levels of the NINO 3.4 Index and is more consistent with the JAMSTEC forecast but does not decline as quickly and extends the El Nino longer. |


Indices use a single number to convey information. Sometimes it is useful to look at the forecast Sea Surface Temperatures that correlate to the indices. I believe that these SST’s directly correlated with the JAMSTEC model but NOAA uses a variety of tools so it is not so easy to understand exactly how they do their forecast but there is a lot of information on that in their lengthy discussion which is presented shortly.
| NOAA | JAMSTEC |
 |  |
|  |
 |  |
Updates from JAMSTEC can be found here. Updates from NOAA can be found here. You have to look for the SST row and go to the right where it says “normalized with mask” and click on E3 which provides the latest model run.
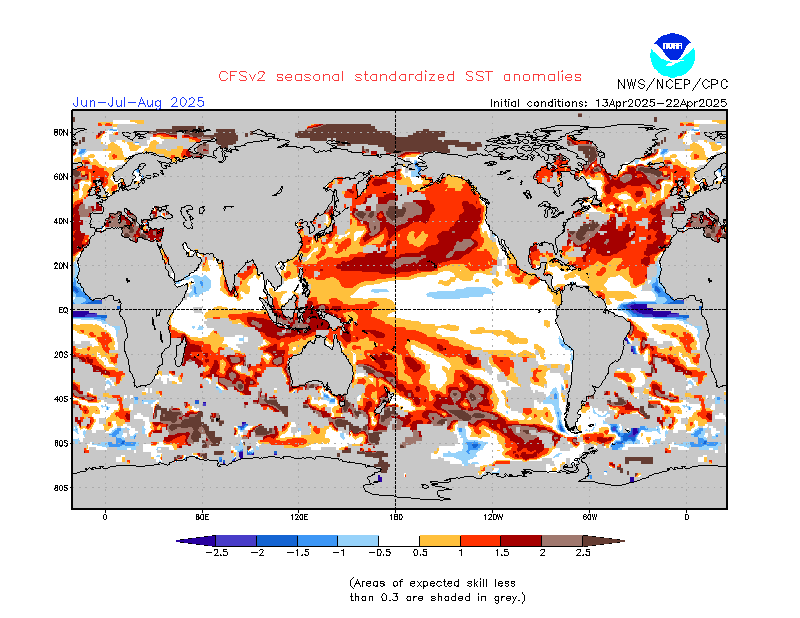
All of these forecasts depend to a large extent on what is known about subsurface temperature anomalies. Here is the latest analysis.

Now let us examine the extent to which the atmosphere has responded to the warming Eastern Pacific.

SOI = 10 X [ Pdiff – Pdiffav ]/ SD(Pdiff) where Pdiff = (average Tahiti MSLP for the month) – (average Darwin MSLP for the month), Pdiffav = long term average of Pdiff for the month in question, and SD(Pdiff) = long term standard deviation of Pdiff for the month in question. So really it is comparing the extent to which Tahiti is more cloudy than Darwin, Australia. During El Nino we expect Darwin Australia to have lower air pressure and more convection than Tahiti (Negative SOI especially lower than -7 correlates with El Nino Conditions). During La Nina we expect the Warm Pool to be further east resulting in Positive SOI values greater than +7).
A. Focus on the NOAA Update (We presented the NOAA Forecast in our Part I Report Published on December 21 which be accessed here.
Below are excerpts (slightly reorganized and with a bit of the redundancy and discussion of methodology removed) from the Discussion released by NOAA on January 17, 2019. Headings that are “Initial Cap” only rather than all caps were added by the Author of this Update Report for clarity. Also we have organized the sequence of the sections of NOAA Discussion to first present the new NOAA Summary for FMA, Atmospheric and Oceanic Conditions and then the Initial Month (February), and finally the remainder of the 15 Month Forecast. We have in the past reorganized some of the material to consolidate it into the first three months of the forecast. The new NOAA Summary is not very detailed but it performs that function. Overall the NOAA forecast discussion has shown continual improvement in being a very useful read.
SUMMARY OF THE OUTLOOK FOR NON-TECHNICAL USERS
THE FEBRUARY-MARCH-APRIL (FMA) 2019 TEMPERATURE OUTLOOK FAVORS ABOVE NORMAL TEMPERATURES FOR APPROXIMATELY THE WESTERN HALF OF THE LOWER 48 STATES, FAR SOUTHERN FLORIDA, AND ALASKA. PROBABILITIES EXCEED 60% OVER THE PACIFIC NORTHWEST, THE ALASKA PANHANDLE, AND SOUTHEASTERN MAINLAND ALASKA. BELOW NORMAL TEMPERATURES ARE FAVORED OVER THE OHIO AND TENNESSEE VALLEYS, AND PARTS OF ADJACENT STATES. THIS TEMPERATURE OUTLOOK IS BASED LARGELY ON RECENT DYNAMICAL AND STATISTICAL MODEL OUTPUT, TEMPERATURE TRENDS, AND TO A DECREASING EXTENT, EFFECTS RELATED TO AN EL NINO.
THE FMA 2019 PRECIPITATION OUTLOOK INDICATES ENHANCED ODDS OF ABOVE NORMAL PRECIPITATION AMOUNTS FROM SOUTH-CENTRAL ALASKA TO THE SOUTHERN ALASKA PANHANDLE, AND FOR THE SOUTHEASTERN CONUS. ABOVE NORMAL PRECIPITATION IS ALSO FAVORED FROM THE FOUR CORNERS REGION EASTWARD TO CENTRAL PORTIONS OF THE HIGH PLAINS. BELOW NORMAL PRECIPITATION IS FAVORED OVER NORTHERN CALIFORNIA, OREGON, AND PARTS OF ADJACENT STATES. ENHANCED ODDS OF LOWER TERCILE PRECIPITATION AMOUNTS ARE ALSO PREDICTED OVER THE MIDDLE AND UPPER MISSISSIPPI VALLEY, THE OHIO VALLEY, AND THE SOUTHERN GREAT LAKES REGION. THIS PRECIPITATION OUTLOOK IS BASED LARGELY ON RECENT DYNAMICAL AND STATISTICAL MODEL OUTPUT, HISTORICAL PRECIPITATION TRENDS, AND TO A DECREASING EXTENT, EFFECTS RELATED TO AN EL NINO.
EQUAL CHANCES (EC) OF BELOW, NEAR, AND ABOVE NORMAL SEASONAL MEAN TEMPERATURES OR SEASONAL ACCUMULATED PRECIPITATION AMOUNTS ARE EXPECTED TO BE SIMILAR TO CLIMATOLOGICAL PROBABILITIES.
BASIS AND SUMMARY OF THE CURRENT LONG-LEAD OUTLOOKS
CURRENT ATMOSPHERIC AND OCEANIC CONDITIONS
RECENT OBSERVATIONS SHOW SEA-SURFACE TEMPERATURES (SST) AND SUBSURFACE TEMPERATURES ACROSS MOST OF THE EQUATORIAL PACIFIC CONTINUE TO BE ABOVE AVERAGE. DURING THE PAST MONTH, SST ANOMALIES RANGED FROM +0.5C TO +2.0C OVER MOST OF THIS REGION, AND SUBSURFACE ANOMALIES RANGED FROM +0.5C TO +4.0C FROM NEAR THE SURFACE TO A DEPTH OF 175 METERS. THE UPPER-OCEAN (TOP 300 METERS) HEAT CONTENT ACROSS THE NEAR-EQUATORIAL CENTRAL AND EASTERN PACIFIC PEAKED IN MID-OCTOBER 2018, AND HAS DECLINED FAIRLY RAPIDLY SINCE THEN. THE LATEST WEEKLY SST DEPARTURE FOR THE NINO 3.4 REGION DROPPED THIS PAST WEEK FROM +0.7C TO +0.4C . ENHANCED ATMOSPHERIC CONVECTION REMAINED RELATIVELY STATIONARY WEST OF THE DATE LINE DURING THE PAST 30-DAYS, AND CONCURRENTLY FLARED UP ALONG THE SOUTH PACIFIC CONVERGENCE ZONE. SUPPRESSED CONVECTION WAS OBSERVED EAST OF THE DATE LINE; AND NEAR TO BELOW NORMAL CONVECTION WAS NOTED OVER INDONESIA. LOW-LEVEL (850-HPA) AND UPPER-LEVEL (200-HPA) WINDS WERE GENERALLY CLOSE TO THE LONG-TERM AVERAGE OVER MUCH OF THE TROPICAL PACIFIC.
DESPITE RELATIVELY WARM OCEAN TEMPERATURES OVER THE TROPICAL PACIFIC, THERE IS STILL NO CLEAR COUPLING BETWEEN THIS WARM WATER AND OVERLYING ATMOSPHERIC CONVECTION. THIS LACK OF COUPLING HAS INTERFERED WITH THE TYPICAL MATURATION PROCESS OF A DEVELOPING EL NINO. INSTEAD, SUBSEASONAL VARIABILITY ASSOCIATED WITH EPISODES OF ROBUST MJO ACTIVITY HAVE DOMINATED THE U.S. CLIMATE SINCE OCTOBER 2018. THE COMBINED EFFECT OF THE OCEAN-ATMOSPHERE SYSTEM IS MORE CONSISTENT WITH ENSO-NEUTRAL THAN IT IS WITH EL NINO.
IN THE NEAR-TERM, THERE IS NO OBVIOUS INDICATION THAT THIS LONG-AWAITED OCEAN-ATMOSPHERE COUPLING WILL TAKE PLACE BEFORE THE END OF BOREAL WINTER. THE FMA 2019 SEASONAL OUTLOOK IS THEREFORE BASED PRIMARILY ON THE EXPECTATION OF CONTINUED ROBUST MJO ACTIVITY WITH LESS OF AN INFLUENCE ANTICIPATED FROM A WEAK (OR NOMINAL) EL NINO THAT MAY STILL FORM. ACCORDING TO THE LATEST ENSO DIAGNOSTIC DISCUSSION ISSUED BY CPC ON 10 JANUARY 2019, THERE IS A 65% CHANCE THAT EL NINO WILL FORM AND CONTINUE THROUGH THE NORTHERN HEMISPHERE SPRING 2019. HOWEVER, IT APPEARS THAT ANY EL NINO THAT DOES FORM WILL ONLY BE OF NOMINAL OR WEAK INTENSITY.
PROGNOSTIC DISCUSSION OF SST FORECASTS
THE CPC SST CONSOLIDATION TOOL FOR NINO 3.4 (WHICH INCLUDES THE CFS, CA, CCA, AND MARKOV SST PREDICTIONS) DEPICTS A MARGINAL EL NINO DURING FMA AND MAM 2019, BECOMING ENSO-NEUTRAL FOR THE REMAINDER OF 2019. THE CFS MODEL PRODUCES THE WARMEST SOLUTION OVERALL, WITH A PREDICTED NINO 3.4 SST ANOMALY CLOSE TO +1.0C (FMA), SLOWLY DROPPING TO ABOUT +0.7C BY JAS. HOWEVER, INDIVIDUAL ENSEMBLE MEMBERS FORECAST A LARGE SPREAD IN SOLUTIONS, FROM NEAR +2.3C DOWN TO -0.5C, WITH THE COOLEST OUTLYING MEMBER PREDICTING -1.5C. THE NMME AND IMME SST PLUMES FORECAST AN SST ANOMALY AT OR SOMEWHAT ABOVE +0.5C THROUGH JUNE 2019.
30-DAY OUTLOOK DISCUSSION FOR FEBRUARY 2019
THE TEMPERATURE AND PRECIPITATION OUTLOOKS FOR FEBRUARY 2019 ARE BASED ON THE BACKGROUND ENSO STATE, POTENTIAL MJO ACTIVITY, AS WELL AS DYNAMICAL MODEL GUIDANCE. DYNAMICAL MODEL GUIDANCE AND STATISTICAL TOOLS THAT TYPICALLY SUPPORT THE WEEK 3-4 PERIOD, WHICH COVERS THE FIRST HALF THE MONTH, WERE ALSO USED.
Temperature
THE OBSERVED TEMPERATURE ANOMALY PATTERN DURING EARLY DECEMBER OVER THE CONUS EXHIBITED A DIPOLE STRUCTURE WITH COLDER THAN NORMAL EAST AND WARMER THAN NORMAL WEST. THE PATTERN THEN FLIPPED DURING LATER DECEMBER. JANUARY STARTED WITH A WARM EAST, BUT IS LIKELY TO FINISH WITH A COOLER THAN AVERAGE EAST AND WARMER THAN AVERAGE WESTERN CONUS. THE MJO LIKELY PLAYED A ROLE IN THESE NOTED SWITCHES, AND THE MJO IS PREDICTED TO REMAIN ACTIVE INTO FEBRUARY, THOUGH THE AMOUNT OF INFLUENCE CAN VARY MONTH TO MONTH DUE TO SEVERAL FACTORS. THE COLDER EASTERN CONUS ANTICIPATED IN LATER JANUARY IS CONSISTENT WITH A SUDDEN STRATOSPHERIC WARMING EVENT THAT TOOK PLACE IN EARLY JANUARY. ATTRIBUTION OF THE PATTERN IS STILL ONGOING.
THE COLDER THAN NORMAL CONDITIONS ACROSS THE EASTERN CONUS ARE LIKELY TO CONTINUE FOR THE FIRST HALF OF FEBRUARY, WITH TEMPERATURES DURING THE LATTER HALF OF THE MONTH BEING LESS CERTAIN. DYNAMICAL MODELS DEPICTING THE FULL MONTH OUTLOOK INDICATE NEAR TO BELOW NORMAL CONDITIONS FOR MUCH OF THE EASTERN CONUS, WITH THE STRONGEST SIGNALS FOR COLD FROM THE GREAT LAKES TO TENNESSEE VALLEY AND TO THE SOUTHEAST. THE MULTIPLE LINEAR REGRESSION (MLR) TOOL THAT EXPLICITLY ACCOUNTS FOR THE MJO INFLUENCE INDICATES WARMER SIGNALS OVER THE EASTERN CONUS, SO THE PROBABILITIES IN THE OFFICIAL OUTLOOK ARE TEMPERED FROM THAT IN MANY OF THE DYNAMICAL MODELS, ESPECIALLY THOSE TOOLS GEARED TOWARD THE FIRST HALF THE MONTH. ACROSS THE WESTERN CONUS, A FORECAST FOR ABOVE NORMAL TEMPERATURES IS SUPPORTED BY DYNAMICAL MODEL PREDICTIONS AND TRENDS. THE MLR TOOL HAS A MUCH WEAKER SIGNAL ACROSS THE WESTERN CONUS, SO PLAYS LESS OF A ROLE. ACROSS ALASKA, TRENDS AND DYNAMICAL MODEL GUIDANCE FAVOR ABOVE NORMAL TEMPERATURES, THOUGH THE EXACT PLACEMENT OF THE AREAS WITH THE HIGHEST ODDS HAVE VARIED WITH RECENT MODEL RUNS. THE OFFICIAL OUTLOOK PLACES THE HIGHEST ODDS ACROSS SOUTHERN ALASKA AND THE ALASKA PANHANDLE AS THOSE LOCATIONS ARE LIKELY TO EXPERIENCE SOUTHERLY MEAN FLOW AT THE SURFACE. THERE IS SOME POTENTIAL FOR PERIODS OF COLD AIR TO SPILL INTO THE ALASKA PANHANDLE IF RIDGING OVER WESTERN CANADA SLIPS WESTWARD.
Precipitation
THE PRECIPITATION OUTLOOK LARGELY REFLECTS DYNAMICAL MODEL GUIDANCE AND TRENDS, AS EXPRESSED IN BOTH THE SEASONAL OCN AND THE MLR TOOL. A MEAN STORM TRACK INTO SOUTHERN ALASKA FAVORS ABOVE NORMAL PRECIPITATION FOR SOUTHERN ALASKA AND THE ALASKA PANHANDLE, WITH THE MEAN STORM TRACK THEN DIPPING DOWN OVER THE NORTHERN GREAT PLAINS. ANOMALOUS RIDGING IS LIKELY TO PREVAIL ALONG THE WEST COAST DURING THE EARLY PORTIONS OF FEBRUARY, LIMITING THE POTENTIAL FOR LONG PERIODS OF WET WEATHER DURING A CLIMATOLOGICALLY WET PERIOD, SO BELOW NORMAL PRECIPITATION IS FAVORED FOR MUCH OF OREGON, CALIFORNIA, PORTIONS OF THE GREAT BASIN, AND PARTS OF THE SOUTHWEST. MEAN NORTHERLY FLOW, SUPPORTING THE COLDER THAN NORMAL TEMPERATURE OUTLOOK, ALSO FAVORS BELOW NORMAL PRECIPITATION FROM THE GREAT LAKES TO THE TENNESSEE VALLEY. ALONG THE GULF COAST AND EAST COAST, THE PLACEMENT OF THE MEAN FRONTAL ZONE COULD RESULT IN ABOVE NORMAL PRECIPITATION, BUT UNCERTAINTY IS TOO HIGH TO DEPICT A SIGNAL.
PROGNOSTIC TOOLS USED FOR U.S. TEMPERATURE AND PRECIPITATION OUTLOOKS
THE TEMPERATURE AND PRECIPITATION OUTLOOKS WERE BASED ON DYNAMICAL MODEL GUIDANCE WHICH INCLUDED THE CFS ALONG WITH THE NMME AND ITS CALIBRATED PROBABILITIES THROUGH JJA 2019. THE IMME WAS USED THROUGH MJJ 2019. STATISTICAL FORECAST MODELS SUCH AS THE COMBINED ENSO-OCN TOOL, THE EXPERIMENTAL CBAM, SMLR, CCA, AND OCN WERE CONSIDERED. LONG-TERM TRENDS WERE WEIGHED MORE HEAVILY IN THE LATER OUTLOOKS, FROM ASO 2019 THROUGH FMA 2020.
THE MJO IS EXPECTED TO REMAIN A MAJOR CONTRIBUTOR TO ANOMALOUS TROPICAL CONVECTION AND ITS ASSOCIATED INTERACTION WITH THE MID-LATITUDE CIRCULATION PATTERN, ESPECIALLY IN FEBRUARY 2019. UNCERTAINTY REMAINS ON HOW MUCH BLOCKING AT THE HIGH LATITUDES DEVELOPS BY FEBRUARY AND ITS LONGEVITY WITH LIMITED CONFIDENCE ON THE FUTURE EVOLUTION OF THE ARCTIC OSCILLATION (AO) AND NORTH ATLANTIC OSCILLATION (NAO). CLIMATE EFFECTS TYPICALLY ASSOCIATED WITH EL NINO DURING THE WINTER AND SPRING WERE CONSIDERED, BUT DOWNPLAYED SIGNIFICANTLY.
PROGNOSTIC DISCUSSION OF OUTLOOKS – FMA 2019 TO FMA 2020
TEMPERATURE
THE GREATEST UNCERTAINTY WITH THE FMA 2019 SEASONAL TEMPERATURE OUTLOOK IS IN THE PREDICTED COVERAGE OF FAVORED BELOW NORMAL TEMPERATURES IN THE EAST. THIS IS BASED ON SEVERAL CONSIDERATIONS WHICH INCLUDE: THE EXPERIMENTAL CBAM TOOL, LAGGED MJO COMPOSITES BASED ON THE EXPECTATION OF ENHANCED TROPICAL CONVECTION PROPAGATING ACROSS THE WESTERN PACIFIC (RMM PHASES 6 AND 7), AND THE GEFS CONSISTENTLY FORECASTING AN IMPRESSIVELY NEGATIVE AO AT LEAST FOR THE START OF FEBRUARY. AS MENTIONED EARLIER, THE LACK OF CLEAR OCEAN-ATMOSPHERE COUPLING MAKES SIGNIFICANT ENSO-RELATED IMPACTS MUCH LESS LIKELY ACROSS THE U.S. AS IS OFTEN THE CASE, WHEN ENSO IS WEAK, OTHER CONTRIBUTORS SUCH AS THE AO AND MJO CAN PLAY A LARGER ROLE IN U.S. WINTER CLIMATE VARIABILITY. THE EXPECTATION OF A HIGHLY VARIABLE TEMPERATURE PATTERN DURING THE 3-MONTH PERIOD RESULTS IN A FORECAST OF EC ACROSS MOST OF THE REMAINDER OF THE EASTERN CONUS. THE WIDESPREAD AREA OF FAVORED ABOVE NORMAL TEMPERATURES, WHICH INCLUDES MOST OF THE WESTERN CONUS AND ALASKA, IS SUPPORTED BY MANY OF THE TOOLS, SUCH AS THE CFS, THE CALIBRATED NMME (PAC) AND MOST OF ITS INPUT MODELS, ENSO-OCN, SMLR, CCA, AND OCN, AND TO A LESSER EXTENT, THE EXPERIMENTAL CBAM TOOL.
IN MAM AND AMJ 2019, THE OUTLOOKS DEPICT THE EXPANSION OF FAVORED ABOVE NORMAL TEMPERATURES ACROSS THE EASTERN CONUS, AS PREDICTED BY ENSO-OCN, CBAM, THE NMME PAC, AND THE IMME. IN AMJ AND MJJ, PROBABILITIES FOR ABOVE NORMAL TEMPERATURES REACH A MAXIMUM ACROSS NORTHERN ALASKA, IN PART DUE TO THE EARLIER BREAKUP OF ICE IN RECENT DECADES AND WARMING TEMPERATURE TRENDS. BY JJA AND JAS, ABOVE NORMAL TEMPERATURES ARE FAVORED ACROSS MUCH OF THE LOWER 48 STATES AND ALASKA, PRIMARILY RELATED TO HISTORICAL TEMPERATURE TRENDS, BUT ALSO SUPPORTED BY CBAM. TRENDS FOR WARMTH ARE PROMINENT ACROSS THE NORTHEAST DURING THE SUMMER AND EARLY AUTUMN (JJA THROUGH OND). FOR JJA AND JAS, EC IS FAVORED ACROSS THE NORTH-CENTRAL CONUS, SUPPORTED BY CBAM (WHICH ALSO PREDICTS BELOW NORMAL TEMPERATURES ACROSS PART OF THIS REGION), NMME (PAC) TO SOME EXTENT, ENSO-OCN, AND CCA. FOR THE REMAINING SEASONS, ASO 2019 THROUGH FMA 2020, THE OUTLOOKS ARE BASED PRIMARILY ON HISTORICAL TEMPERATURE TRENDS AS EXPRESSED IN THE ENSO-OCN TOOL.
PRECIPITATION
THE FMA 2019 SEASONAL PRECIPITATION OUTLOOK FAVORS ABOVE NORMAL (UPPER TERCILE) PRECIPITATION FROM SOUTH-CENTRAL ALASKA TO THE SOUTHERN ALASKA PANHANDLE, AND CENTRAL AND SOUTHERN PORTIONS OF BOTH THE ROCKIES AND HIGH PLAINS. ABOVE NORMAL PRECIPITATION IS ALSO FAVORED ACROSS THE SOUTHEAST AND EAST GULF REGIONS. THESE AREAS ARE SUPPORTED BY THE NMME (PAC), CBAM, AND TO SOME EXTENT THE IMME AND CFS. THE GFDL FLOR AND NCAR MODELS ALSO LEND SOME SUPPORT FOR THESE PREDICTED REGIONS OF FAVORED ABOVE NORMAL PRECIPITATION. BELOW NORMAL (LOWER TERCILE) PRECIPITATION IS FAVORED OVER OREGON, NORTHERN CALIFORNIA, AND PARTS OF NEIGHBORING STATES, AND THE MID-UPPER MISSISSIPPI VALLEY, SOUTHERN GREAT LAKES REGION, AND OHIO AND TENNESSEE VALLEYS. THE UN-CALIBRATED NMME AND SOME OF ITS INPUTS PREDICT THESE TWO DRY SIGNALS. THE IMME, CBAM, AND CFS ALSO CONTRIBUTE TOWARD THESE PREDICTED PRECIPITATION ANOMALIES. THE FMA 2019 PRECIPITATION OUTLOOK ACKNOWLEDGES THE DECREASING CHANCES OF SIGNIFICANT ENSO-RELATED ANOMALIES, AND THESE DEPARTURES HAVE BEEN SUBSTANTIALLY SCALED BACK IN SPATIAL COVERAGE. STILL, THERE REMAINS AN OUTSIDE CHANCE THAT THE OCEAN-ATMOSPHERE SYSTEM COULD COUPLE LATE THIS WINTER, SO EL NINO EFFECTS CAN NOT BE RULED OUT ENTIRELY AT THIS TIME FOR THE U.S.
IN MAM, THE PRECIPITATION OUTLOOK RETAINS THE WET SIGNAL OVER SOUTHERN PORTIONS OF ALASKA, THOUGH THE COVERAGE DIMINISHES. FROM MAM THROUGH MJJ 2019, VARIOUS STATISTICAL AND DYNAMICAL MODELS, AND HISTORICAL PRECIPITATION TRENDS, TEND TO SLOWLY DECREASE THE COVERAGE OF FAVORED ABOVE NORMAL PRECIPITATION OVER THE SOUTHEAST, WHILE INCREASING IT OVER THE WEST-CENTRAL CONUS, AND THEN INTO THE MIDDLE AND UPPER MISSISSIPPI VALLEY AND OHIO VALLEY. BY JJA AND JAS, LONG-TERM TRENDS (AND THE CBAM TOOL TO SOME DEGREE) FAVOR DRYNESS IN THE NORTHERN ROCKIES AND NORTHERN INTERMOUNTAIN REGION, AND WETNESS IN MUCH OF ALASKA AND FROM THE MIDDLE MISSISSIPPI VALLEY EASTWARD TOWARDS THE MID-ATLANTIC AND NORTHEAST. FOR THE REMAINING SEASONS ASO 2019 THROUGH FMA 2020, THE SEASONAL PRECIPITATION OUTLOOKS ARE ALMOST EXCLUSIVELY BASED ON LONG-TERM PRECIPITATION TRENDS
We also have the brief JAMSTEC Discussion
Jan. 20, 2019 Prediction from 1st Jan., 2019
ENSO forecast:
As predicted earlier, El Niño/El Niño Modoki-like state has actually emerged in October. Now, warmer-than-normal sea surface temperature is observed for the whole tropical Pacific. The SINTEX-F predicts that the current state will continue in spring. Then the tropical Pacific will return to a normal state by summer.
Indian Ocean forecast:
As predicted earlier, the Ningaloo Niña off the west coast of Australia has actually emerged and the amplitude quickly amplified in November. The model predicts that the Ningaloo Niña will continue in early austral autumn, then quickly decay in late austral autumn.
Regional forecast:
On a seasonal scale, SINTEX-F predicts that most part of the globe will experience a warmer-than-normal condition in boreal spring, while some parts of Alaska, southern U.S.A., northeastern Brazil, eastern Russia, southwestern China, northern India, northwestern Africa, and most part of Western Europe will experience a colder-than-normal condition.
As regards to the seasonally averaged rainfall in boreal spring, a wetter-than-normal condition is predicted for most part of the western coast of Canada, southeastern/western U.S.A., northeastern Brazil, western equatorial part of Africa, eastern China, Korean Peninsula, southeastern India, Indonesia, and Europe. In contrast, northeastern U.S.A., Mexico, region around Venezuela, Brazil (except for northeastern part), Australia, most part of southern Africa, West Africa, western Russia, most part of Southeast Asia, and the Philippines will experience a drier-than-normal condition. We notice that Australia may continue to experience extremely hotter and drier than normal condition.
The model predicts most part of Japan will experience warmer and wetter-than-normal condition in spring as a seasonal average.
B. Now we begin our comparison of the NOAA and JAMSTEC Forecasts (Focus on next nine months i.e. three seasons)
In this Update, we compare the JAMSTEC temperature and precipitation forecast maps, which are for the World, with the NOAA temperature and precipitation forecast maps that cover only CONUS and Alaska. We do this primarily for educational purposes.
JAMSTEC works in three-month intervals which correspond to seasons and does not change the selection of months each time they update but does so every three months. At that time they drop one season and add another season further in the future. So for JAMSTEC we have Spring (MAM), Summer (JJA) and Fall (SON). NOAA provides maps for each three-month period starting with JFM. JAMSTEC only provides three sets of maps and they only change every three months. So one out of three months the first season lines up perfectly and this is not that month. In one month the JAMSTEC first season is already underway and in another month it starts one month out. We decided to handle that by using the NOAA MAM forecast to compare with the JAMSTEC MAM forecast. So we are not addressing February in this report with respect to a comparison with JAMSTEC but February is addressed in detail in the NOAA discussion which is in this report.
The timing of the forecasts is something to consider. NOAA releases their Seasonal Outlook on the third Thursday of the month so one expects that the material was compiled perhaps two days earlier than the date when it is published. JAMSTEC does not have a consistent time for releasing their forecast but their Nino 3.4 forecasts are dated the 1st of the month. Their Nino Index graphic and their forecast maps are usually placed on their web site just before NOAA issues their Seasonal Outlook but this month they were posted four days after the NOAA release probably (our guess) to have the maps and the JAMSTEC discussion appear at the same time which has not been the case in the past. So one is not sure that the “initial conditions” for both forecasts are the same. It is not possible for me to know exactly what information the two agencies used in the preparation of their forecasts although the NOAA discussion provides a lot of information on that. I have assured myself that this detail of the way the two forecasts are produced has not had a major impact this month but I am not sure of that. I believe the differences have more to do with the subtle differences in the forecast for Nino 3.4.
I show the NOAA Maps first followed by the JAMSTEC maps. I extract North America from the Worldwide JAMSTEC map and use that to compare with the NOAA Maps. I also extract Europe including parts of North Africa and Western Asia from the Worldwide JAMSTEC maps and include those excerpted maps in the summary table at the beginning of this article.
Spring MAM 2019.
Temperature
NOAA
And here is the MAM 2018/2019 temperature forecast for North America that I extracted from the JAMSTEC World Forecast.
And now the JAMSTEC WORLD FORECAST (for this graphic my comments are mostly related to areas other than Alaska and CONUS as those comments appear with the larger graphics above)

Precipitation
NOAA
And here is the MAM 2019 Precipitation Forecast for North America that I extracted from the JAMSTEC World Forecast.
JAMSTEC WORLD FORECAST

Summer (JJA – 2019)
Temperature
NOAA
And here is the JJA – 2019 Temperature Forecast for North America that I extracted from the JAMSTEC World Forecast.
JAMSTEC WORLD FORECAST

Precipitation
NOAA
And here is the JJA – 2019 Precipitation Forecast for North America that I extracted from the JAMSTEC World Forecast.
JAMSTEC WORLD FORECAST

Fall (SON 2019)
Temperature
NOAA
And here is the JJA 2019 Temperature Forecast for North America that I extracted from the JAMSTEC World Forecast.
JAMSTEC WORLD FORECAST

Precipitation
NOAA
And here is the JJA 2019 Precipitation Forecast for North America that I extracted from the JAMSTEC World Forecast
JAMSTEC WORLD FORECAST

C. Progress of ENSO
We are not including this section this month but we have addressed it early in this report and it is addressed in some detail in the NOAA Discussion. Sea Surface Temperatures (SST’s) are already at El Nino levels so there is not much point in looking at the forecasts as to if and when that will happen as it has happened. It is really not possible to forecast the rate and the extent at which the Atmosphere and the sea surface temperatures will couple.
NOAA will be updating the February forecast at the end of this month and they will be discussing the state of ENSO at that time. They will be issuing a new ENSO update on February 14, 2019. We will use that opportunity to go into more detail on the status of a possible El Nino which may be declared on February 14, 2019. Either way we will have something to say on that topic at that time. But to some extent we cover this topic every Monday Night in our Intermediate-Term Forecast. It will also be addressed after NOAA updates their February forecast maps.
One can find the links to all of our reports here.


