Written by Sig Silber
Updated at 9:20 PM EST December 20, 2018 to reflect the updated Week 3 – 4 Forecast
With no change in the Drought this week, we focus on the newly released November and three-month Weather data (for the U.S. and the World) that has just been released. It is not exactly a record but for CONUS the second wettest autumn in 124 years with average precipitation at 145% of average. But yet we still have a lot of CONUS in drought. Re temperature it was a slightly cooler than average at 55th out of 124 years with an average temperature that was only 0.25F warmer than the 20th Century Mean. But we remain with a large area in drought. All of this and more is in this week’s report.

Please share this article – Go to very top of page, right hand side, for social media buttons.
First we will start with the New Seasonal Drought Forecast.

And the discussion released with it.
Latest Seasonal Assessment – Near- to above-normal precipitation again prevailed from the High Plains to the East Coast, leaving the eastern and central parts of the Nation nearly drought-free. Here, moderate drought is restricted to southeastern Florida, northern North Dakota, a small part of northeast Oklahoma and adjacent Missouri, and the central Texas Panhandle. Farther west, precipitation was sufficient to keep most of Idaho, Montana, and Wyoming out of drought as well. As of mid-December, 37 states were at least 95 percent drought-free, and only 7 states were more than one-third drought covered. But in stark contrast to the rest of the country, these states (The Four Corners States, Nevada, California, and Oregon) still have extensive drought coverage (over 70 percent in 6 states), and a large swath centered near the Four Corners remains locked in an entrenched, long-term drought. Extreme to exceptional drought blankets much of this region, as it has since mid- to late-spring in many areas. The only other area of drought covers southeast Alaska, usually one of the wettest areas in the country. Through mid-December, 2018 brought just over 100 inches of precipitation to Ketchikan in the far southern Panhandle. This is more than 3 feet below normal, and 2018 will end up about the eighth driest of the 105 years on record there.
In accord with the developing El Niño development, above-normal precipitation (and drought removal) is expected in southern Florida. Farther west, the patches of drought in the Plains are expected to persist. The three-month outlook favors drier than normal weather in the Pacific Northwest and northern California through March, so persistence is forecast here despite heavy late-December precipitation expected in western Oregon. Drought improvement and removal is expected in the rest of California, most of Nevada and Utah, the west half of Arizona, and western Colorado, though with low confidence from the Great Basin westward. Farther east, across the entrenched long-term drought near the Four Corners to the High Plains, drought is expected to persist despite a three-month forecast favoring above-normal precipitation. January-March is a drier time of year here, and given the extreme and long-term nature of the drought here, wetter-than-normal weather during a drier time of year probably won’t be enough to bring notable improvement. Southeast Alaska should also remain in drought; it’s unlikely that enough precipitation will fall to boost streamflows and end the threat to hydroelectric power production
Now we look back at the Autumn Season based on new information released on Tuesday.
Autumn Weather Review Weather summary provided by USDA/WAOB
Highlights: Despite some weather challenges, U.S. corn and soybeans achieved record-high yields of 178.9 and 52.1 bushels per acre, respectively, based on November data released by USDA’s National Agricultural Statistics Service. Some other crops, including cotton, did not fare quite as well, in part due to drought (on the southern High Plains) and hurricanes (in the Southeast).
In fact, Hurricanes Florence and Michael grabbed headlines for their adverse impacts on Southeastern agriculture. Florence resulted in catastrophic mid-September flooding in eastern North Carolina and portions of neighboring states, followed by Michael’s devastating storm-surge strike on western Florida and subsequent wind-related inland impacts on cotton, pecans, timber, and other commodities in western Florida, southwestern Georgia, and southeastern Alabama.
As autumn progressed, colder, wetter conditions developed across the central and eastern U.S. In particular, cold, wet weather resulted in extensive fieldwork delays – including summer crop harvesting and winter wheat planting – across the Plains and Midwest. Those conditions also hampered winter wheat emergence and establishment.
From January to November, U.S. wildfires burned more than 8.5 million acres of vegetation, nearly 140 percent of the 10-year average. In California, devastating November wildfires struck both northern and sections of the state. In particular, northern California’s Camp Fire became the nation’s deadliest wildfire in a century, with at least 85 fatalities reported in Butte County. The Camp Fire also scorched more than 153,000 acres of land and destroyed nearly 14,000 homes.
In the contiguous U.S., warm-season drought (D1 to D4) coverage peaked at 36.21 percent on August 14, according to the U.S. Drought Monitor. However, there was a marked autumn decrease in drought coverage, especially across the central and eastern U.S. By November 13, drought covered just 20.94 percent of the Lower 48 States. By December 4, drought was nearly non-existent across the central and eastern U.S., but covered 54 percent of the eleven Western States. A core area of extreme to exceptional drought (D3 to D4) persisted into early December across the Four Corners region, covering 27 percent of Colorado, 21 percent of New Mexico, 13 percent of Arizona, and 8 percent of Utah. Elsewhere on December 4, extreme drought (D3) was reported across 34 percent of Oregon and 4 percent of California.
Historical Perspective: Autumn generally started warm and ended cold, leading to near-average temperatures. Regionally, the nation’s mid-section experienced a cool autumn, while warmth covered the Far West and the Southeastern and Mid-Atlantic States. Overall, it was the 55th -warmest autumn during the 1895-2018 period of record, but the coolest since 2006. The nation’s autumn average temperature of 53.8°F was one-quarter degree above the 20th century mean. State temperature rankings ranged from the 12th-coldest autumn in North Dakota to the third-warmest autumn in Florida (figure 1). Six states – California, Georgia, Maryland, Delaware, and the Carolinas – joined Florida in having a top-ten ranking for autumn warmth.
Meanwhile, the contiguous U.S. weathered its second-wettest autumn, behind only 1985. September-November precipitation averaged 9.61 inches, 140 percent of normal. Oregon noted its 26th-driest autumn, but top-ten wetness covered 22 states from the central and southern Plains into the Midwest and East. It was the wettest autumn on record in Maryland, New Jersey, North Carolina, Rhode Island, Texas, Virginia, and West Virginia (figure 2).
September: Tropical moisture, most directly associated with Hurricane Florence but also provided by Tropical Storm Gordon and Tropical Depression Nineteen-E, contributed to heavy rain in various parts of the country. Florence, which struck the southern Mid-Atlantic coast as a Category 1 hurricane on September 14, produced catastrophic flooding in parts of the eastern Carolinas. Agricultural losses due to flooding included poultry and hogs, as well as immature row crops such as cotton, peanuts, and soybeans.
More than a week earlier, on September 4, Gordon had made landfall along the central Gulf Coast and eventually merged with a cold front to spark heavy rain from the Ohio Valley into the northern Mid-Atlantic region. Finally, Tropical Depression Nineteen-E arrived across northwestern Mexico on September 19 and later helped to boost rainfall totals in the south-central U.S. Periods of heavy rain also soaked the upper Midwest, triggering additional rounds of lowland flooding and locally slowing early-season corn and soybean harvest efforts, despite earlier-than-normal crop maturation. By September 30, roughly one-quarter of the Nation’s corn (26 percent) and soybeans (23 percent) had been harvested, slightly ahead of the respective 5-year averages of 17 and 20 percent. In addition, the early crop maturation protected upper Midwestern corn and soybeans in late September, when freezes struck North Dakota, Minnesota, and Wisconsin.
The widespread rain east of the Rockies reduced drought coverage in the contiguous U.S. from 34 to 29 percent during the 4-week period ending October 2, according to the U.S. Drought Monitor, with the most substantial improvement occurring on the southern Plains. In contrast, drier-than-normal conditions dominated the West. In particular, little or no September precipitation fell across California, the Great Basin, and the Intermountain West, accompanied by mostly above-normal temperatures. Despite the warm, dry conditions, wildfires burned less than a million acres of Western vegetation during September. Still, nearly 7.8 million acres had burned nationally by the end of September, roughly 130 percent of the 10-year average.
Cool weather prevailed in September from the Pacific Northwest to the northern Plains. Most of the remainder of the country experienced near- or above-normal monthly temperatures, with record-setting warmth affecting many locations in the Ohio Valley and the Southeast. For some communities in Florida, including Lakeland, it was the hottest September on record – and the warmest month of 2018.
October: Cool weather and relentless rains early in the month across the central and southern Plains and the upper Midwest curtailed fieldwork and resulted in the nation’s slowest soybean harvest since 2009. During the week ending October 14, five percent or less of the corn and soybeans were harvested in Iowa, Kansas, Minnesota, Missouri, Nebraska, Wisconsin, and the Dakotas. Producers were able to resume fieldwork operations during the second half of the month; by October 28, nearly three-quarters (72 percent) of the nation’s soybeans had been harvested – still below the 5-year average of 81 percent.
On October 10, powerful Hurricane Michael became the third-strongest storm on record, in terms of central barometric pressure, to strike the U.S. mainland, behind the Florida Keys’ Labor Day hurricane of 1935 and Hurricane Camille in 1969. Category 4 Michael ripped across the Gulf Coast near Panama City, Florida, with a devastating storm surge and sustained winds near 155 mph. Hurricane-force winds (74 mph or greater) extended inland across western Florida, southwestern Georgia, and the southeastern corner of Alabama, causing significant damage to timber and crops such as cotton and pecans. Nearly one-half (46 percent) of Georgia’s cotton crop, which was just one-fifth harvested when Michael hit, was rated in very poor to poor condition on October 28, up from a pre-storm value of 9 percent.
Michael also produced heavy rain and gusty winds in the Carolinas and the Mid-Atlantic, but generally did not compound the damage that previously had been caused by Hurricane Florence. Meanwhile, the Plains’ heavy rain hampered harvest activities and winter wheat planting. On October 28, the Kansas sorghum harvest was just 32 percent complete, versus the average of 55 percent. On the same date, winter wheat in Kansas was 76 percent sown, behind the average of 89 percent. Due to wetness and poor conditions for establishment, a notable portion of the emerging wheat crop was rated very poor to poor in Oklahoma (26 percent), Texas (22 percent), and Kansas (18 percent).
In contrast to the central and southern Plains’ excessive wetness, drought persisted in parts of the West. On October 28, topsoil moisture was rated at least one-half very short to short in Nevada (95 percent), California (80 percent), Oregon (77 percent), and Washington (50 percent). Oregon led the Northwest on that date with 18 percent of its winter wheat rated in very poor to poor condition. In contrast, precipitation in part associated with the remnants of eastern Pacific Hurricanes Rosa, Sergio, and Willa provided some Southwestern drought relief.
Late-season warmth dominated the Southeast, especially prior to Michael’s arrival. Monthly temperatures locally averaged more than 5°F above normal in the lower Southeast. Meanwhile, tem-peratures averaged more than 5°F below normal across parts of the Plains and upper Midwest, despite some late-month warmth. At the height of the cool spell, some early-season snow blanketed the nation’s mid-section, especially on October 10 and 14.
November: Overall, weather patterns remained similar to those observed during September and October, though there were subtle changes. For example, generally wet weather continued across the central and eastern U.S., although drier conditions developed across southern Florida and the southern Plains. In addition, drier-than-normal weather persisted for much of the month in the western U.S., contributing to an historic wildfire outbreak in California. However, late-November storminess eased Western drought and curbed the wildfire threat.
California’s wildfires, many of which started on November 8, caused extensive destruction and loss of life. In fact, northern California’s Camp Fire became the nation’s deadliest wildfire in a century, with at least 85 fatalities reported in Butte County. The Camp Fire also scorched more than 153,000 acres of vegetation and destroyed nearly 14,000 homes. Concurrent fires in southern California collectively burned nearly 100,000 acres and destroyed more than 400 homes.
Cold air, which had begun to settle across the nation’s mid-section and the Northeast in October, became more fully entrenched during November. Monthly temperatures averaged at least 5°F below normal across parts of the Plains, Midwest, and mid-South, contributing to slow rates of drying and extensive fieldwork delays. On November 25, national harvest progress for crops such as cotton (70 percent complete) and soybeans (94 percent) was less advanced on that date than any of the previous 25 years.
In the East, excessive rainfall also caused fieldwork interruptions. On November 25, more than one-third (35 percent) of the cotton in South Carolina and 36 percent of the soybeans in North Carolina had not yet been harvested. On the same date, topsoil moisture was rated at least one-half surplus in Louisiana (59 percent surplus) and North Carolina (50 percent). Ohio led the Midwest with topsoil moisture rated 65 percent surplus, while seven of the ten Atlantic Coast States from Maine to Maryland – all but New Hampshire, New Jersey, and Rhode Island – reported topsoil moisture ranging from 50 to 100 percent surplus.
Farther west, mid- to late-month precipitation frequently fell as snow, maintaining abundant to locally excessive moisture reserves across the Plains and Midwest and curtailing fieldwork such as summer crop harvesting and winter wheat planting. Cool, wet conditions also limited wheat emergence and establishment. During the weekend after Thanksgiving, an early-season winter storm snarled transportation from the central Plains into the lower Great Lakes region. Another winter storm began to unfold across the Plains and Midwest on November 30, with effects carrying into early December.
Most of the information in this report comes from five sources, but other sources are used also.


- The U.S. Drought Monitor (full report can be accessed here)
- Selected parts of our Weekly Weather and Climate Report (Monday’s full report can be accessed here) which has forecasts for the next 25 days and which auto-updates
- Selections from the Tuesday USDA Weather and Crop Bulletin (full report can be accessed here). Selections from the USDA Office of the Chief Economist can be found here. Other useful sources of information that I regularly utilize are the National Integrated Drought Information System (NIDIS) which can be accessed here and the USDA NRCS Weekly and Weather Climate Update which can be accessed here.
Remember if you leave this page to go to links or if you have clicked to enlarge a graphic, in order to get back you need to hit the return arrow usually located on the left of your URL box on the upper left of the screen. Also most of the small graphics are designed to become full size when you click on them. If that does not work, an alternative way to view the larger graphics is to right click and then hit “view image”. That should always work.
This report is now organized as follows:
- Present Drought Conditions
- Last Week’s Weather
- Information from our Weekly Weather Column (the forecast maps auto-update) and combined with brief commentary from me provides a forecast which I attempt to interpret re the likely change in drought conditions
- U.S. Crop Information
- International Crop Information and related weather
- Prior month’s weather and month-to-date weather excluding the prior week when I have that information. Drought is based on cumulative deficits.
- A science theme if we have one.
- Reference Information. (This includes a lot of information on reservoirs that we are not focusing on this week)
1. Present Drought Conditions
The U.S. Drought Monitor is a comprehensive way of understanding the drought situation for the U.S. It is issued every Thursday and reflects the conditions as of the prior Tuesday. Drought is defined as a moisture deficit bad enough to have social, environmental or economic effects. Thus, more factors than recent precipitation are considered and more information on how it is done is found at the end of this report.

Below is the same map but just CONUS and with statistics and below that map I have provided a cut-out of the statistics which I think you can click on to enlarge.
 |
 |
| |

The graphic below shows the one-week change in drought intensity. Yellow is bad. Green is good.

This pair of maps might make it easier to get a general idea of what is happening in the worst part of the drought area.
| Last Week | This Week |
|  |

This map which covers the West may be useful also.

Because there has been almost no change we are not going into more details state by state this week. In the iist of references there are links to a number of sources for that information including importantly he National Integrated Drought Information System (NIDIS) which can be accessed here
Here is part of the explanation for the overall situation in the West. Looking at the last seven days of precipitation as reported by the network of SNOTEL sites. These are mainly in remote locations often at high elevations.

We will probably now show the Water Year to Date Graphic just monthly as it does not change that ra
And this graphic which looks at the eastern part of the Western Region might also be useful

Now we show the week to week change information by region. The yellow is where the drought has been upgraded. The green is where the level of drought has been downgraded.
 |
| Slight deterioration in the South |
 |
| No Change |
 |
| No Change |
 |
| Some changes here on balance deterioration. Most of the changes were in Oklahoma |
 |
| A small area of improvement there. Where you are not in drought, precipitation does not change this map as there is no such thing (right now) to negative drought. |
 |
One small area of improvement in Northern NM east of the Sangre de Cristos Mountains probably and oversight i.e. should have been changed last week. |
Some may find this way of looking at things useful and I hope these graphics are not too small to read. I did not make them so you could click on them individually but you can click on the whole graphic and it may enlarge. But I think you get the picture. It has been a rapid onset and hopefully it’s demise will also be fairly rapid. When you read these graphics remember that the older graphics are not the drought conditions that existed then but the change from then until now.

Some might find this animation of twelve weeks of change useful;

Here is the discussion which was issued with the Drought Monitor today.
This Week’s Drought Summary
This week, another strong storm system crossed the southern continental United States, delivering moderate to heavy precipitation from parts of Texas and Oklahoma east and northeastward through the Ohio Valley and Southeast to the Atlantic Coast. Moderate to heavy precipitation also occurred from the central California coastline northward to the Canadian border, and in the interior northwest in northeast Oregon, eastern Washington, and the Idaho Panhandle. Elsewhere, little to no precipitation fell. With the exception of southern Texas, Louisiana, Mississippi, Alabama, Florida, northern New England, and a few pockets in the Intermountain West, most of the continental United States experienced warmer than normal weather this week. The warmest conditions with respect to normal occurred in the central and northern Plains and Upper Midwest. Relatively minor changes were made to the drought depiction this week. Abnormal dryness expanded over much of the southern Plains in response to increased short-term precipitation deficits and windy conditions. Areas of the South and Southeast that were in drought were adjusted in response to where the moderate to heavy rain fell and missed this week. Any changes to the map in the Northwest have been deferred to next week, when the effects of recent precipitation on meteorological and hydrological drought in the region can be more thoroughly evaluated. Moderate drought was added to the leeward sides of some of the Hawaiian Islands, where short-term dryness and windiness led to agricultural impacts. Abnormal dryness expanded in Puerto Rico, where soil moisture, streamflow, and short-term precipitation deficits worsened. Precipitation in the Alaska Panhandle this week was insufficient to improve any of the areas experiencing short- and long-term drought or abnormal dryness.
Northeast
During the past week, the storm system that traversed the southern U.S. delivered precipitation ranging from a half inch to 3 inches to parts of the Northeast. The largest amounts fell in West Virginia, Pennsylvania, and New Jersey, while precipitation totals were much lower in interior parts of New York and New England. Temperatures in northern New England were mostly below normal by a few degrees, while temperatures in the rest of the Northeast were warmer than normal. Drought conditions remained unchanged this week, with short-term precipitation deficits continuing in northern Maine, where abnormal dryness remains. Abnormally dry conditions also continued in northern parts of New York and Vermont.
Southeast
Near or slightly below normal temperatures were common in Florida and southern Georgia, while above-normal temperatures occurred from northern Alabama and Georgia northward through the spine of the Appalachians in the Carolinas and Virginia. As the aforementioned storm system moved across the southern U.S. this week, moderate to heavy rain fell in much of the Southeast region. The heaviest amounts, with isolated totals as high as 5 to 6 inches, occurred in the Florida Panhandle and northern Florida Peninsula. The southern edge of this heavy rain alleviated abnormally dry conditions in the north-central Florida Peninsula, while areas to the southeast of the heavy rain axis saw degradation to abnormal dryness due to increased short-term rainfall deficits. The rest of the region remained drought free this week.
South
Widespread moderate to heavy precipitation from this week’s storm system occurred from central Oklahoma eastward through Arkansas into Tennessee and northern Mississippi. Western north Texas, east Texas, and Louisiana also received moderate to heavy precipitation, while the dry slot of the storm system kept precipitation amounts minimal from central Texas to the Dallas-Fort Worth area. Generally warm conditions prevailed from the Texas Panhandle eastward through Tennessee this week, while more moderate temperatures and a few areas of below-normal readings were common in southern Texas, Louisiana, and Mississippi. With continuing dry conditions on short and long timescales, abnormal dryness expanded from the Amarillo area to cover more of the Texas Panhandle. Continued dryness in the 1- to 2-month timeframe in western Oklahoma and the Texas and Oklahoma panhandles, combined with very high winds associated with this week’s strong storm system increasing evaporative stress, led to the introduction and expansion of abnormal dryness over parts of western Oklahoma and the panhandles. The short-term dryness and depleted soil moisture here is beginning to apply stress to wheat, and fires are starting to become a concern in the region too. Adjustments to moderate drought and abnormal dryness were made in central and northeastern Oklahoma in response to where the heavy rain fell and where it missed this week. Areas that missed out on the heavier rains saw status quo or degradations as short- and long-term precipitation deficits increased, while deficits decreased and conditions improved in areas that received more rainfall. Short-term dryness also continued in the Lower Rio Grande Valley, where abnormal dryness expanded.
Midwest
Moderate to heavy precipitation occurred this week, generally along and southeast of the I-44 corridor in Missouri and the I-70 corridor in Illinois, Indiana, and Ohio. Above-normal temperatures occurred in the entire region, with the warmest weather compared to normal taking place in northern Minnesota, where temperatures spiked to more than 10 degrees above normal. Relatively dry conditions over the last couple months continued in northern Wisconsin and parts of Michigan, though precipitation surpluses beyond the last two months in these areas prevented degradation. Aside from a slight expansion of moderate drought and abnormal dryness in southwest Missouri, no changes were made to the drought depiction for this week in the Midwest.
High Plains
Warm and dry conditions dominated the region this week, with the warmest weather compared to normal occurring in the Dakotas. Dry conditions continued this week in southern Kansas, which led to the introduction of abnormal dryness where 1- to 2-month precipitation deficits increased and high winds increased evaporative demand. Outside of southern Kansas, no changes to the drought depiction were made this week.
West
Widespread heavy rain and snow fell along much of the Pacific Coast this week, from central California northward to the Canadian border. As much of this precipitation fell around the data cutoff for this week, any changes to the drought depiction are being deferred to next week’s map, when the effects of this precipitation on ongoing meteorological and hydrological drought can be more thoroughly evaluated. Elsewhere in the region, precipitation also fell in northeastern Oregon, eastern Washington, and much of the Idaho Panhandle. Above-normal temperatures were common this week in the West, particularly in eastern Washington and Oregon, while near or cooler than normal temperatures occurred in northern Utah, southeastern Wyoming, northeastern Nevada, and southeastern New Mexico. Low snowpack is evident in some of the mountainous regions of central Idaho, northwestern Montana, and the region around Yellowstone National Park, though overall conditions in these areas were not sufficient for degradation this week. Short-term and long-term precipitation deficits in the Sangre de Cristo mountains and adjacent foothills and high plains in northeastern New Mexico had improved enough for small improvements to the drought depiction here. Abnormal dryness was also slightly expanded near Laramie, Wyoming. Elsewhere, no changes to the drought depiction were made.
Alaska, Hawaii, and Puerto Rico
Precipitation continued this week in the Alaska Panhandle, though amounts were insufficient to allow for any improvement to the drought depiction here. In Puerto Rico, low soil moisture, low streamflow, and short-term precipitation deficits led to the expansion of abnormal dryness over a much larger section of the island. Strong winds and short-term dryness in the leeward sides of Hawaii, Maui, Molokai, and Kauai led to adverse impacts on vegetation and pastures. In these areas, abnormal dryness continued, and some pockets of moderate drought were introduced.
Looking Ahead
For the rest of this week, the National Weather Service Weather Prediction Center is forecasting widespread moderate to heavy precipitation, with the highest amounts generally confined to an area ranging from eastern Texas northeast to the Atlantic Coast. Moderate to heavy precipitation is also forecast in the Pacific Northwest. Primarily warmer than normal temperatures are also expected in the Lower 48 this week.
Soil Conditions

Wildfires are happening. But the risk is rapidly declining. More Information here.

The below are the forecasts by month for wildfires. Notice the area of risk is shrinking.


Additional information can be found here.
And we do not want to ignore floods. The updated map can be obtained here.

Reservoirs and Stream Flow

Let us look at California

2. Last Week’s Weather
Here is what happened with precipitation during the most recent week. The maps are in sync with the crop reports in terms of the period of time covered.

It is useful to look at temperature in a few different ways.
First let’s look at the Minimum Temperature.

and here is the snow situation.
 This
This
And this relates snow depth to where winter wheat is grown which benefits from the protection of snow.

And now the weekly maximum temperature

And for many purposes the average deviation from Normal or Climatology is very useful.

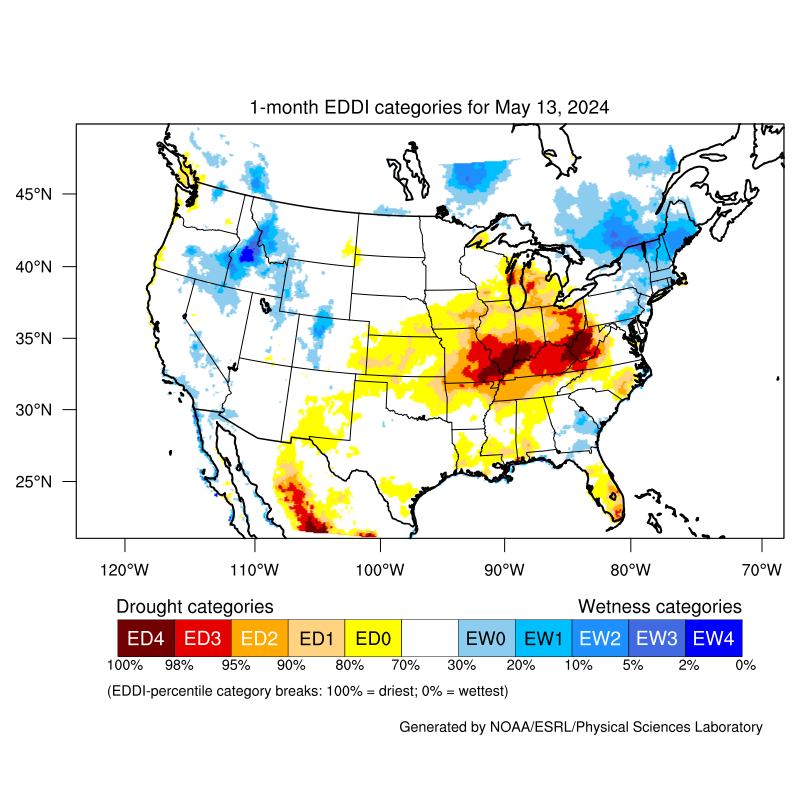
And here is a graphic that pulls a lot of information together. Image provided by the NOAA/ESRL Physical Sciences Division, Boulder, Colorado see website. It shows the demands of the atmosphere for moisture from the ground and is based on temperature, wind, relative humidity and solar radiation. It tells you nothing about how much precipitation you will get but how much you need to retain the same level of soil moisture.

3. Current Forecast for Precipitation and Drought.
First we show the current month and then the Seasonal Forecast through February which was issued on November,15 with the full Seasonal Outlook. These two forecasts are sued by the same agency but to obtain them you need to access two different links here and here. We either show the latest or both in this report. Sometimes we show them in more than one place in this report for the convenience of the reader.

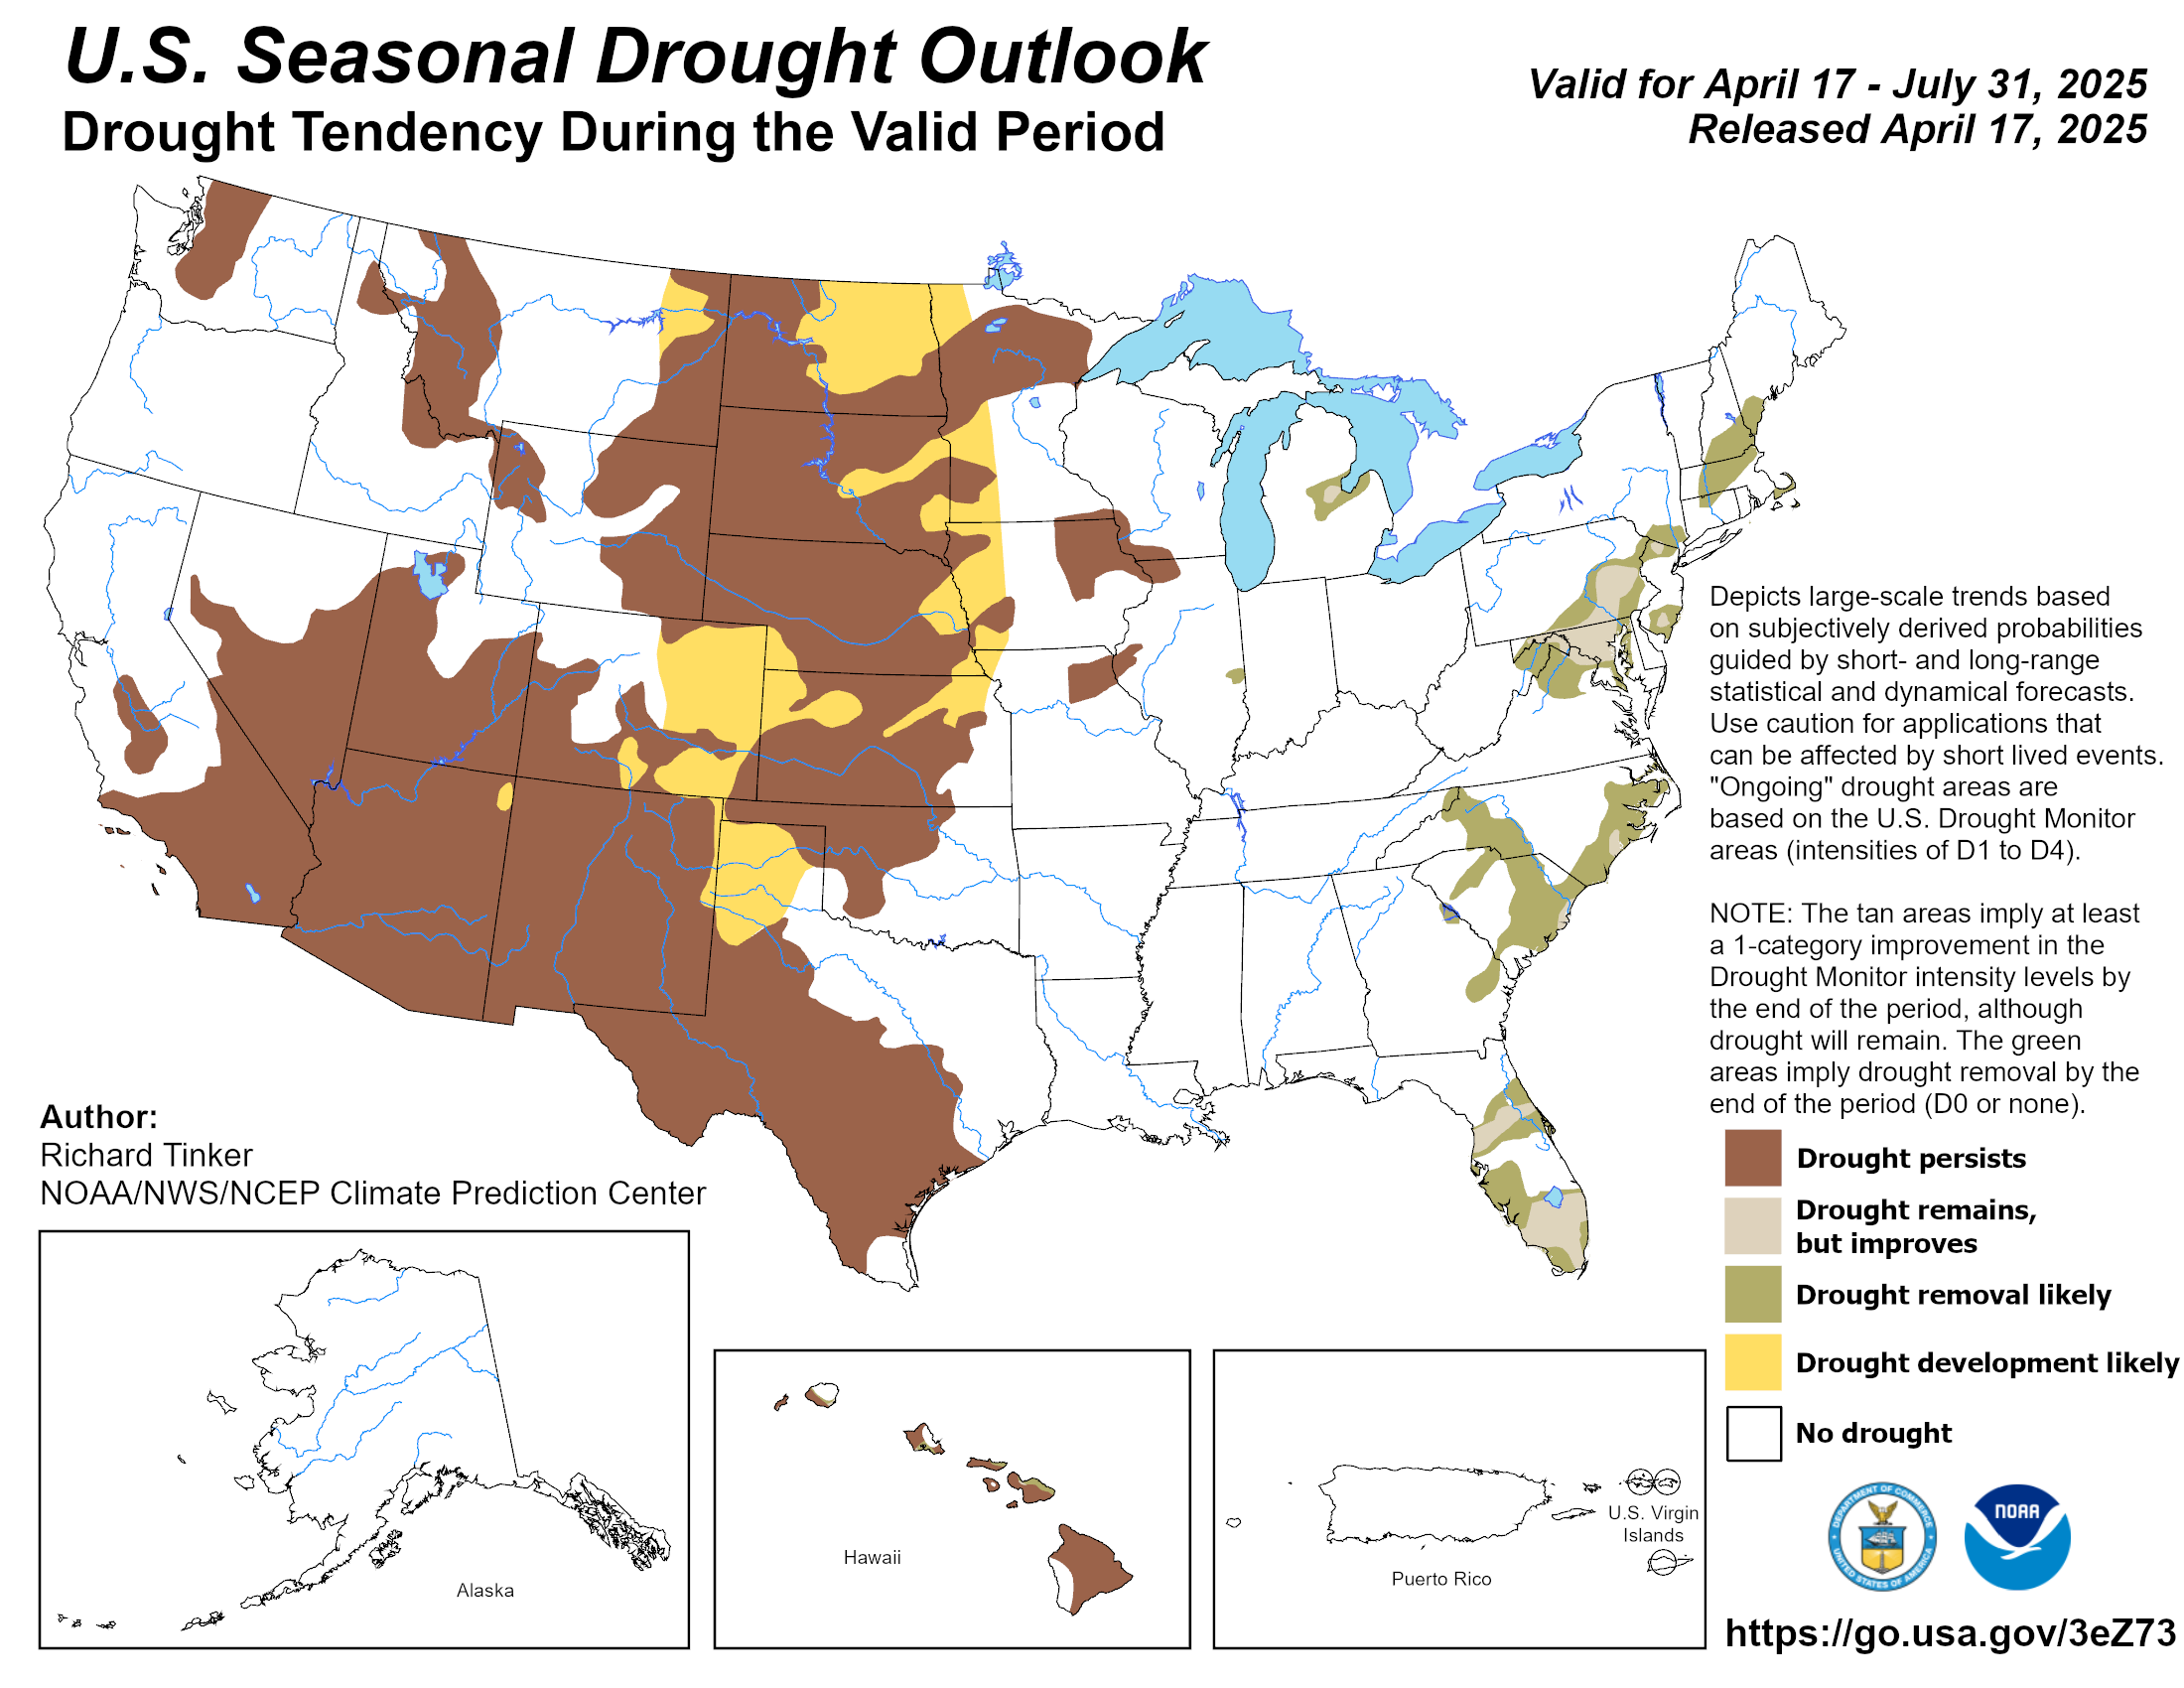
And here is the longer seasonal drought forecast which was issued on December 20, 2018. It will update on January 17, 2019. It will be discussed in more detail in our Two-Part Report on the new NOAA Seasonal Outlook.
And now the current precipitation forecasts so that we can make our own assessment of the drought forecast. Here I provide the weather forecasts for different periods of time in which should allow the reader to assess the likelihood of this forecast working out as shown over the next three to four weeks. Since we publish this week on Thursday, we update the discussion for the Week 3 – 4 forecast when it is updated on Friday. This is important as the current Day 6 – 14 forecasts and the week-old week 3 – 4 forecast overlap to some extent.
First weather hazards

Additional information can be obtained here. We also now publish a Live Severe Weather article which can be accessed here. The link to our Severe Weather Events article changes every Sunday night and the current version can always be found in the directory which can be accessed here.
This was predicted and happened.

Now Temperature Forecast .
 |  |  |  |
| This shows magnitude rather than probability of being higher or lower than Normal and shows the middle day of the five day period. | Looks like the Northern Plains States will tend to be warm* in Week – 1 (Days 6 – 10). But the pattern is shifting east. * warmer than climatology | ↑ ← The Week 3 – 4 forecast was updated on Friday December 21, 2018. . | |
 |  |  |  |
The five day QPF is shown above. The units are different than the other maps i.e. in units of precipitation (inches) not probabilities of exceeding or being less than climatology. | It starts out mostly wet* in Week – 1 (Days 6 – 10) dry but tends to become a bit less wet in Week – 2 (days 8 – 14) especially in the far west and across the Northern Tier up to the Great Lakes. * wetter than climatology It does not look like Oregon or Nevada will receive any significant drought relief. | ↑ ← The current Week 3 – 4 forecast was updated on Friday December 21, 2018. Certainly a mixed picture. | |

The below is of interest.

4. U.S. Crop Information


5. International Crop and Weather Related Information
This comes out late but drought for the whole North American Continent.


Sometimes a map is useful.

And now the weekly reports.


Here is the six-month result of these dry weeks.


Monthly International Graphics.


6. Prior Month and when available the Current Month-to date Weather (excluding prior week)
Prior Month (it helps to understand the pattern)
Looking back at November. We reported this last week but it is worth taking a look at again.
| Temperature | Precipitation |
|
|
| No records set but there is a large group of states that were very cool. | Again no records but a lot of much average precipitation on the East Coast. |


We covered the Season in the Introduction. But here are three more graphics of the past Autumn season.
Min and Max Temperature

Average Temperature

Precipitation

Current Week
For reference purposes here is the precipitation information for the prior seven days. It is not the same as what is shown earlier which covers the Sunday to Saturday period which corresponds to the crop reports. The below is the current seven day period and updates in this article automatically every day.

Current Month to Date.

And then temperature:

You can generate a wide variety of different graphics here.
7. Science Theme When we Have One.
No Science Theme this week.
8. Additional Reference Information
Reservoir Status. This will now be updated as we receive new graphics which is not weekly. We updated some of the graphics this week in some cases with more recent information and in other cases the same information but with better graphic quality.
We update these graphics when we receive new ones. They do not auto-update. They tend to change slowly.


This article provides a little background on the problem.
This is not as graphically pleasing. Updates can be obtained here.

We have added more rivers to the discussion. Above we have reservoirs and they are of course connected by rivers. Both are important and provide insight.
Here is another way of looking at it by considering the cumulative flow.


Below is a more complete description of


Sequence of drought occurrence and impacts for commonly accepted drought types. All droughts originate from a deficiency of precipitation or meteorological drought but other types of drought and impacts cascade from this deficiency. (Source: NDMC)
Source: National Drought Mitigation Center, University of Nebraska-Lincoln


