Written by Sig Silber
More than likely, the betting line at Vegas is that El Nino is 80% likely this year. But it is now November 22, 2018 and so far El Nino is a “No Show”. I am not suggesting that anyone lay down good money to bet on La Nada i.e. no El Nino but an El Nino of any significant impact or duration is not a sure thing. It will not be La Nina but it may not really be El Nino either. On the other hand JAMSTEC is convinced that El Nino is already here
As predicted earlier, El Nino/El Nino Modoki-like state has actually emerged in October. The SINTEX-F continues to predict a moderate-to-strong El Nino event that reaches its peak in late winter. This El Nino is more or less of Modoki-type and we need to be careful of its impact as it may be different from that of the canonical El Nino.

Please share this article – Go to very top of page, right hand side for social media buttons.
Introduction
Weather can be thought of as determined to a very extent by
A. Secular Trends: The big one right now is Global Warming and
B. Various patterns that can be usefully described as cycles. They tend to be grouped by how frequently they repeat.
These patterns include:
B1. High Frequency Cycles such as the AO, NAO, PNA, MJO, certain combinations especially interactions with the Northern Pacific NP such as the NPO/WP.
B2. Medium Frequency Cycles such as ENSO and for the Indian Ocean the IOD. There are others but they tend to cover smaller geographies.
B3. Low Frequency Cycles such as the AMO and PDO and some components of the NAO and the counterparts in the Indian Ocean.
For CONUS, ENSO is very important. ENSO has three phases: La Nina, Neutral and El Nino.
Of great interest right now is whether or not we will enter the El Nino Phase of the ENSO Cycle.
It is complicated but there are two major criteria for determining which Phase of the ENSO Cycle is present:
* The pattern of Sea Surface Temperatures anomalies (deviations from what is considered normal for this time of the year) in the Equatorial Pacific especially as measured in a particular area called Nino 3.4 Neutral is anomalies being between -0.5C and +0.5C. La Nina is when the anomalies are colder than this Neutral range and El Nino is when the anomalies are warmer than this Neutral range. The anomalies are calculated relative to what is considered “normal” and that is adjusted every five years to reflect changes which for any years have been in the direction of warmer being normal. The base for anomalies calculated over land are adjusted only every ten years but because ENSO is so critical, the base is adjusted every five years.
* The extent to which the Atmosphere is responding to the pattern of these Sea Surface Temperatures. The are a number of indices that measure this the most used is called the Southern Oscillation Index or SOI
Scorecard.
Right now the situation is
| Nino 3.4 | Indicates El Nino Conditions are Present |
| SOI | Indicates El Nino Neutral Conditions are Present |
So we are left with a number of questions:
- We will have an El Nino this winter?
- If so, how long will it last?
- What kind of El Nino will it be?
- If we do not have a full El Nino, what will we have.
Summary of the Current Situation (80% there is an El Nino, 20% La Nada i.e. it did not happen as forecast)
This article is where we attempt to provide as much information as we have to assist readers in thinking about the above four questions.
Let’s get started. But first
From today’s Pacific Storm and Surf Forecast They do a great job of interpreting many of the NOAA model results.
3 Month CFS Model (850 mb wind): (11/18) This model depicts weak weak west anomalies were in the core of the KWGA today with a weak Active Phase of the MJO developing there. The Active Phase of the MJO is to start building but with modest west anomalies retrograding west and fading out of the KWGA by 11/26. Neutral anomalies are forecast in the KWGA 11/20-12/4. After that the Inactive Phase of the MJO is to develop in the KWGA 12/3 -12/21 but with weak west anomalies in the KWGA. The Active Phase is to rebuild 12/25 holding through 1/29 with west winds anomalies building, to WWB status. After that a weak Inactive MJO signal is forecast through the end of the model run on 2/15 with west anomalies holding. The low pass filter indicates a low pressure bias is fully in control of the KWGA reaching east over California and forecast holding beyond while slowly easing east, but still centered over the dateline at the end of the model run. A 4th contour line previously forecast to to develop in the 12/22-1/21/19 period is no longer on the charts. It now appears El Nino development is becoming less certain per this model. The atmosphere and ocean are trying to become coupled towards an El Nino bias in the Pacific Ocean, but there’s no objective evidence of it yet. If it hasn’t happened yet (by Nov 1), it’s doubtful there will be significant weather influence even if it does develop. And this model is not [Editor’s Note. Did the author intend to say “now” rather than “not”] suggesting they will not become coupled with the MJO coming back to life and steady west anomalies fading. Still this pattern is to slowly become more favorable to support storm production in the Pacific regardless of whether El Nino develops, especially compared to the 2 previous years given that we’re still moving towards Winter and La Nina is gone. Our assumption is a normal Winter pattern will result, but nothing more.
Examining this graphic (and I am sorry I froze it as it is due to update any day now but to show only a portion of the original graphic I had to snip and store which means it will not update.

We start with the IRI/CPC Report:
Here is the way IRI/CPC presents their analysis.

Now we look at a comparison of the current assessment versus the Early November Assessment.

And here is the discussion that was released with their report.
IRI Technical ENSO Update
Published: November 19, 2018
Note: The SST anomalies cited below refer to the OISSTv2 SST data set, and not ERSSTv4. OISSTv2 is often used for real-time analysis and model initialization, while ERSSTv4 is used for retrospective official ENSO diagnosis because it is more homogeneous over time, allowing for more accurate comparisons among ENSO events that are years apart. During ENSO events, OISSTv2 often shows stronger anomalies than ERSSTv4, and during very strong events the two datasets may differ by as much as 0.5 C. Additionally, the ERSSTv4 may tend to be cooler than OISSTv2, because ERSSTv4 is expressed relative to a base period that is updated every 5 years, while the base period of OISSTv2 is updated every 10 years and so, half of the time, is based on a slightly older period and does not account as much for the slow warming trend in the tropical Pacific SST.
Recent and Current Conditions
In mid-November 2018, weak El Nino SST conditions were observed in the NINO3.4 region. The October SST anomaly was 0.86 C, in the weak El Nino range, and for Aug-Oct it was 0.51 C, also indicative of weak El Nino. The IRI’s definition of El Nino, like NOAA/Climate Prediction Center’s, requires that the SST anomaly in the Nino3.4 region (5S-5N; 170W-120W) exceed 0.5 C. Similarly, for La Nina, the anomaly must be -0.5 C or less. The climatological probabilities for La Nina, neutral, and El Nino conditions vary seasonally, and are shown in a table at the bottom of this page for each 3-month season. The most recent weekly anomaly in the Nino3.4 region was 0.8, indicating weak El Nino conditions. However, many of the key atmospheric variables, such as the upper level zonal wind anomalies, the sea level pressure pattern (e.g., the Southern Oscillation index) and the outgoing longwave radiation pattern (convection), have not suggested El Nino conditions, but rather a continuation of ENSO-neutral conditions. The low-level wind anomalies have been westerly during some weeks, but this indication of El Nino has been intermittent. In other words, coupling of the atmosphere to the oceanic conditions has been weak at best. The subsurface temperature anomalies across the eastern equatorial Pacific remain markedly above-average. These warmed waters at depth extend to the surface, resulting in above-average temperatures, and also presaging likely continuation of above-average SST in the coming couple of months. Given the current El Nino-level SST anomalies, the subsurface profile, even with currently poor atmospheric coupling it appears likely that the SST will continue at weak (or greater) El Nino levels into winter and possibly into spring. This expectation assumes that the atmosphere will participate in the event more in the coming month or two.
Expected Conditions
What is the outlook for the ENSO status going forward? The most recent official diagnosis and outlook was issued approximately one week ago in the NOAA/Climate Prediction Center ENSO Diagnostic Discussion, produced jointly by CPC and IRI; it gave an 80% chance for El Nino during the Dec-Feb season, and 55-60% chance for continuing into spring 2019. An El Nino watch remains active. The latest set of model ENSO predictions, from mid-October, now available in the IRI/CPC ENSO prediction plume, is discussed below.
As of mid-November, about than 90% of the dynamical or statistical models predict El Nino conditions from the initial Nov-Jan 2018-19 season through Jan-Mar 2019, with less than 10% showing neutral conditions for this same range of seasons. From Feb-Apr through May-Jul, between 80 and 89% of models continue to predict El Nino. During Jun-Aug and Jul-Sep, between 70 and 75% of models continue to predict El Nino. No model predicts La Nina for any season, with the exception of one model that does so for the Apr-Jun season.
Note – Only models that produce a new ENSO prediction every month are included in the above statement.
Caution is advised in interpreting the distribution of model predictions as the actual probabilities. At longer leads, the skill of the models degrades, and skill uncertainty must be convolved with the uncertainties from initial conditions and differing model physics, leading to more climatological probabilities in the long-lead ENSO Outlook than might be suggested by the suite of models. Furthermore, the expected skill of one model versus another has not been established using uniform validation procedures, which may cause a difference in the true probability distribution from that taken verbatim from the raw model predictions.
An alternative way to assess the probabilities of the three possible ENSO conditions is more quantitatively precise and less vulnerable to sampling errors than the categorical tallying method used above. This alternative method uses the mean of the predictions of all models on the plume, equally weighted, and constructs a standard error function centered on that mean. The standard error is Gaussian in shape, and has its width determined by an estimate of overall expected model skill for the season of the year and the lead time. Higher skill results in a relatively narrower error distribution, while low skill results in an error distribution with width approaching that of the historical observed distribution. This method shows probabilities for La Nina at near 0% from Nov-Jan through Apr-Jun, rising only to 6% by Jul-Sep. Probabilities for neutral conditions begin at about 5% for Nov-Jan, rise slowly to about 15% for Mar-May, and to about 30% for May-Jul through Jul-Sep. Probabilities for El Nino, which begin at 95% for Nov-Jan, stay above 90% through Jan-Mar, fall to 85% for Mar-May, and to 61% for Jul-Sep. The failure to drop below 50% by Jul-Sep suggests a possibility for a two-year El Nino event. A plot of the probabilities generated from this most recent IRI/CPC ENSO prediction plume using the multi-model mean and the Gaussian standard error method summarizes the model consensus out to about 10 months into the future. The same cautions mentioned above for the distributional count of model predictions apply to this Gaussian standard error method of inferring probabilities, due to differing model biases and skills. In particular, this approach considers only the mean of the predictions, and not the total range across the models, nor the ensemble range within individual models.
In summary, the probabilities derived from the models on the IRI/CPC plume describe, on average, a very strong tilt of the odds toward El Nino conditions from Nov-Jan through Feb-Apr 2019, peaking 95% for Nov-Jan. Probabilities for La Nina are close to zero through Apr-Jun. A caution regarding this latest set of model-based ENSO plume predictions, is that factors such as known specific model biases and recent changes that the models may have missed will be taken into account in the next official outlook to be generated and issued early next month by CPC and IRI, which will include some human judgment in combination with the model guidance.
NOAA also has their own proprietary forecasting system.


This is what some call the Plume of Forecasts. It is Nino 3.4 forecasts from a variety of Meteorological Agencies and forecast models.
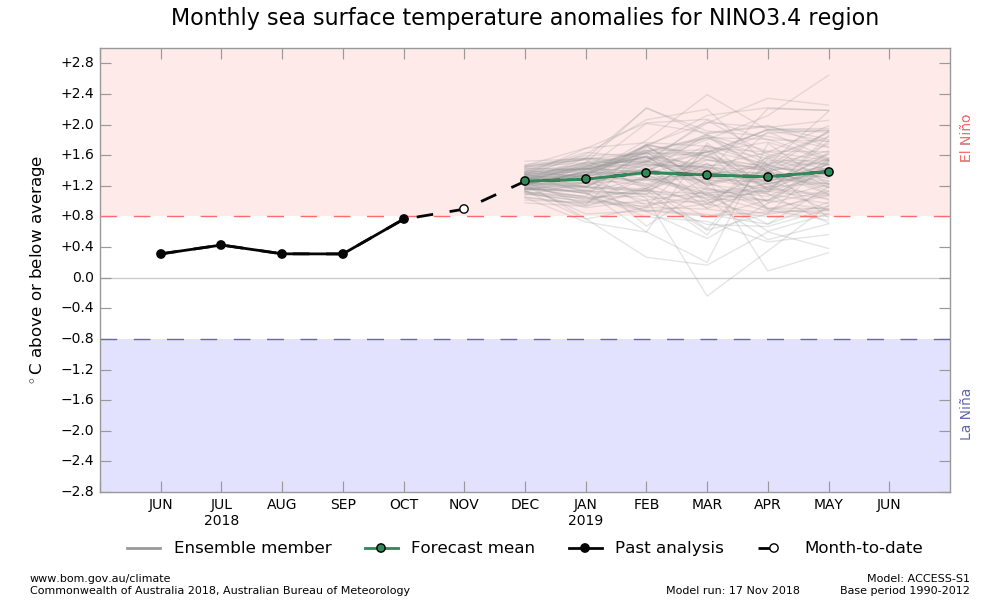
And here are the JAMSTEC forecasts from our November 17 Report.
Looking at the one year forecast, JAMSTEC quickly goes to El Nino values, peaks in February, and then starts to decline but maintains an El Nino level until about September 2019. But it is not clear that a declining Nino 3.4 Index produces the same results as a stable index and this has been tested by Queensland re their modeling. | .
|
I am not sure how to interpret this graphic. It is what JAMSTEC calls their Modoki Index. It is reading lower than their standard index but it is in El Nino Territory. It almost looks like the Modoki index peaks earlier and that is consistent with the SST graphics we are showing below. |  |
Looking at the two year index we see the forecast stabilizing in August or September 2019 at pretty much the transition from El Nino to ENSO Neutral. It continues to decline but stays in the Neutral range. |
|


And the discussion just recently released.
Nov. 21, 2018 Prediction from 1st Nov., 2018
ENSO forecast:
As predicted earlier, El Nino/El Nino Modoki-like state has actually emerged in October. The SINTEX-F continues to predict a moderate-to-strong El Nino event that reaches its peak in late winter. This El Nino is more or less of Modoki-type and we need to be careful of its impact as it may be different from that of the canonical El Nino.
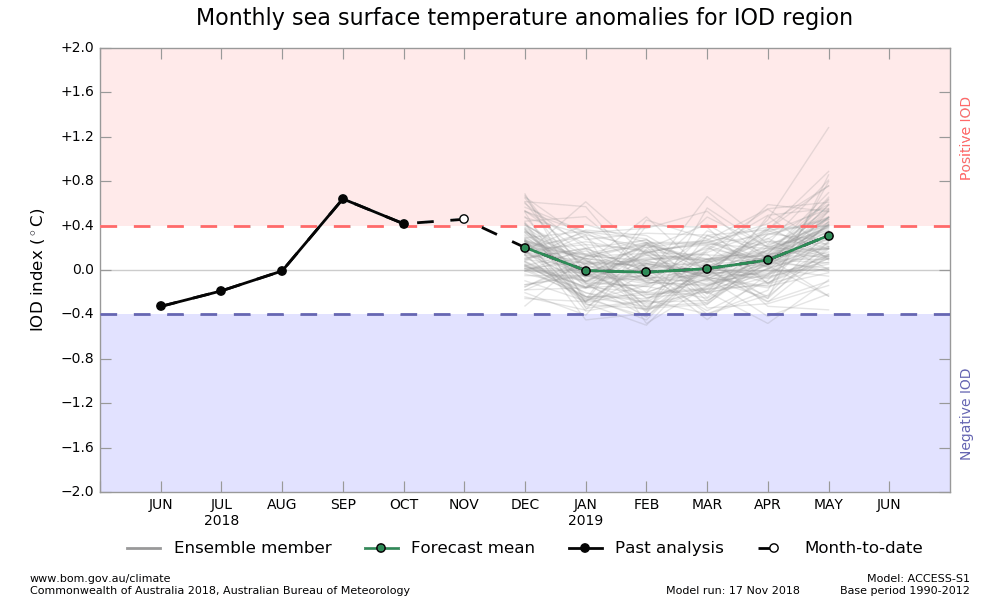
Indian Ocean forecast:
As predicted earlier, the positive Indian Ocean Dipole (IOD) has actually emerged in July and the amplitude was enhanced in September. The model predicts that the positive IOD will quickly decay in winter. In accord to the positive IOD evolution, sea level anomalies are negative (positive) in the eastern (western) tropical Indian Ocean. The Ningaloo Nina off the west coast of Australia will reach its peak in late winter.
Regional forecast:
On a seasonal scale, SINTEX-F predicts that most part of the globe will experience a warmer-than-normal condition in boreal winter, while most parts of U.S.A., eastern Russia, western China, northern India, Pakistan, Afghanistan and U.K. will experience a colder-than-normal condition.
As regards to the seasonally averaged rainfall in boreal winter, a wetter-than-normal condition is predicted for most part of the western coast of Canada, eastern/southwestern U.S.A., eastern Brazil, a eastern part of South Africa, central Africa, Europe, and eastern China, and northern India. In contrast, northwestern U.S.A., Central America, a northern part of the South American Continent, northwestern Brazil, Australia, a western part of southern Africa, northern Mozambique, eastern Tanzania, a northwestern part of Northern Europe, western Russia, a southern part of Southeast Asia, the Philippines, and a western part of Indonesia will experience a drier-than-normal condition. We notice that Australia may continue to experience extremely drier than normal condition.
The model predicts most part of Japan will experience warmer-than-normal and the northern (southern) part will be drier (wetter)-than-normal condition in winter as a seasonal average.
Now Let Us Go into More Detail in Some Areas
1. Current and Recent Sea Surface Temperatures (SST)
2. Current and Recent Equatorial Pacific Subsurface Temperatures
3. History of the Nino 3.4 Readings and forecasts from other Meteorological Agencies.
4. The Surface Air Pressure Pattern that confirms the state of ENSO.
5. Science Theme: We are not presenting a science theme this evening.
1. Current and Recent Sea Surface Temperatures (SST)
A major driver of weather is Surface Ocean Temperatures. Evaporation only occurs from the Surface of Water. So we are very interested in the temperatures of water especially when these temperatures deviate from seasonal norms thus creating an anomaly. The geographical distribution of the anomalies is very important. To a substantial extent, the temperature anomalies along the Equator have disproportionate impact on weather so we study them intensely and that is what the ENSO (El Nino – Southern Oscillation) cycle is all about. Subsurface water can be thought of as the future surface temperatures. They may have only indirect impacts on current weather but they have major impacts on future weather by changing the temperature of the water surface. Winds and Convection (evaporation forming clouds) is weather and is a result of the Phases of ENSO and also a feedback loop that perpetuates the current Phase of ENSO or changes it. That is why we monitor winds and convection along or near the Equator especially the Equator in the Eastern Pacific.
My focus here is sea surface temperature anomalies as they are one of the two largest factors determining weather around the World. If we want to have a good feel for future weather we need to look at the oceans as our weather mostly comes from oceans and we need to look at Surface temperature anomalies (weather develops from the ocean surface

And we can look at how this has changed. The first set of graphics is simply looking at the three-month average compared to today and that is below. These graphics can be clicked on to enlarge.
| Three Month Average Anomaly | Current Anomaly |
 |  |
| By this point La Nina is gone neutral conditions prevail | We see shades of red all across the Equatorial Pacific now but it is not a strong El Nino pattern showing here. |
And we can focus on the part of the Equatorial Pacific which is believed to be most highly correlated with ENSO events.
TAO/TRITON GRAPHIC (a good way of viewing data related to the part of the Equator and the waters close to the Equator in the Eastern Pacific where we monitor to determining the current phase of ENSO. It is probably not necessary in order to follow the discussion below, but here is a link to TAO/TRITON terminology.

For U.S. weather forecasters they look primarily at the area between 170W and 120W along the Equator and 5 degrees of latitude both north and south. This is shown below. I have not drawn in the boundaries as doing so would prevent the graphic from updating but when I look at the graphic I see a lot of area that registers in the +1.0C range. The warm anomaly is in a narrow slice of water with water that is less warm relative to climatology both north and south of the warmer water. But when averaged out, the result is a value that is normally considered a weak El Nino value.
The current conditions are measured by determining the deviation of actual sea surface temperatures from seasonal norms (adjusted for Global Warming) in certain parts of the Equatorial Pacific. The below diagram shows those areas where measurements are taken.

NOAA focuses on a combined area which is all of Region Nino 3 and part of Region Nino 4 and it is called Nino 3.4. They focus on that area as they believe it provides the best correlation with future weather for the U.S. primarily the Continental U.S. not including Alaska which is abbreviated as CONUS. The historical approach of measurement of the impact of the sea surface temperature pattern on the atmosphere is called the Southern Oscillation Index (SOI) which is the difference between the atmospheric pressure at Tahiti as compared to Darwin Australia. It was convenient to do this as weather stations already existed at those two locations and it is easier to have weather stations on land than at sea. It has proven to be quite a good measure. The best information on the SOI is produced by Queensland Australia and that information can be found here. SOI is based on Atmospheric pressure as a surrogate for Convection and Subsidence. Another approach made feasible by the use of satellites is to measure precipitation over the areas of interest and this is called the El Nino – Southern Oscillation (ENSO) Precipitation Index (ESPI). We covered that in a weekly Weather and Climate Report which can be found here. Our conclusion was that ESPI did not differentiate well between La Nina and Neutral. And there is now a newer measure not regularly used called the Multivariate ENSO Index (MEI). More information on MEI can be found here. The jury is still out on MEI and it is not widely used.
And then we can look at the recent history of the key area along the Eastern Pacific. One way of presenting the data is by a Hovmoeller Diagram which simply is a push up list where current or recent data is shown and the further north you look on the graphic the further out in time the lines were drawn.
A major advantage of the Hovmoeller method of displaying information is that it shows the history so I do not need to show a sequence of snapshots of the conditions at different points in time. This Hovmoeller provides a good way to visually see the evolution of this ENSO event. I have decided to use the prettied-up version that comes out on Mondays rather that the version that auto-updates daily because the SST Departures on the Equator do not change rapidly and the prettied-up version is so much easier to read. The bottom of the Hovmoeller shows the current readings. Remember the +5, -5 degree strip around the Equator that is being reported in this graphic. So it is the surface but not just the Equator.

This next graphic is more focused on just the Equator and looks down to 300 meters rather than just being the surface.

And here it is useful to look at the surface wind conditions.

2. Current and Recent Equatorial Pacific Subsurface Temperatures
Now a more detailed look below the surface. This is a pair of graphics that I often provide. The date shown is the midpoint of a five-day period with that date as the center of the five-day period. The bottom graphic shows the absolute values, the upper graphic shows anomalies compared to what one might expect at this time of the year in the various areas both 130E to 90W Longitude and from the surface down to 450 meters. At different times I have discussed the difference between the actual values and the deviation of the actual values from what is defined as current climatology (which adjusts every ten years except along the Equator where it is adjusted every five years) and how both measures are useful for other purposes. The top graphic was shown at the beginning of this article and was frozen but this graphic will auto-update.
We now have warm water extending east to Ecuador. The temperature threshold for El Nino is currently being met everywhere in the Nino 3.4 Measurement Area and the warm anomaly extends west to at least 150E and in many places extends down to 150 meters. So this Sea Surface Temperature (SST) part of the El Nino criteria will be met for some time. But it is not clear what the intensity profile will look like. As you can see in the graphic (and remember this graphic updates every five days, the most intense sub-surface anomalies only extend to 120W. Further west, the anomalies are not as intense. Far to the west we see the next possible La Nina. It takes a long time for these anomalies to move east and then impact the surface. But from looking at this graphic you can get a pretty good idea of how this will play out. |
 |
| The 29C Isotherm is now at 170W. The 28C Isotherm at 160W. The 27C Isotherm is at 140W and the 25C Isotherm is now at 120W. The 20C Isotherm no longer reaches the surface but the 24C Isotherm does so at 100W. |
Tracking the change over a period of a year or so:
 |
|
I have “frozen” the graphic on the left side above which shows the situation as reported for September 15, 2017. The one on the right which is the current situation. The situation with the cool anomaly is now much different east of the Dateline from the situation as reported for September 15, 2017. The cool pool to the east is gone and has been replaced by a warm anomaly. We have Down-welling Kelvin Waves erupting to the surface now. This two sets of graphics provides a good feel for the duration of the prior weak La Nina which received no reinforcing cool water. The situation now is essentially the reverse of the situation in September of 2017.
This graphic provides both a summary perspective and a history (small images on the right).
.
The next graphic basically averages out the anomalies by longitude. It averages the anomalies from the surface down to 300 meters.

The discussion in this slide says it better than I could. One might compare the current reading to Oct/Nov 2017. Side by side comparison can be useful
| Comparison Week Probably Third Week of December 2017 | Current Week |
|
|

3. History of the Nino 3.4 Readings and forecasts from other Meteorological Agencies.
I am only showing the currently issued version of the NINO SST Index Table as the prior values are shown in the small graphics on the right with this graphic.

The same data in graphic form but going back a couple of more years can be found here. The full table of values can be found here.
This graphic brings the Nino 3.4 up to date and is easy to read.

include (“/home4/aleta/public_html/pages/weather/modules/ONI_History.htm”); ?>
This is not the full table but it can be found here. You can see that most El Ninos achieve +0.5C or higher for the three month period September/October/November. That may still happen with this El Nino if the Nino 3.4 values for November remain elevated.
Forecasts from Other Meteorological Agencies.
The JAMSTEC Index and discussion was presented in our November 17, 2018 Article that can be accessed here. The Nino 3.4 Indices are s shown earlier in this article.
Here is the November 7, 2018 Nino 3.4 report from the Australian BOM (it updates every two weeks)
And the ENSO Outlook Discussion Issued on November 20, 2018
El Nino ALERT and positive Indian Ocean Dipole continue
The tropical Pacific continues to meet some, but not all, El Nino criteria, while a positive Indian Ocean Dipole (IOD) persists in the Indian Ocean. The Bureau’s ENSO Outlook remains at El Nino ALERT, meaning there is at least a 70% chance of El Nino fully forming in 2018.
Sea surface temperatures in the tropical Pacific Ocean now exceed El Nino thresholds. However, atmospheric indicators – such as trade winds, cloudiness, pressure patterns and the Southern Oscillation Index (SOI) – have yet to show consistent or sustained signs of El Nino. This clearly indicates that the tropical ocean and atmosphere are not currently reinforcing each other and remain ‘uncoupled’. This coupling is required to not only fully develop and sustain an El Nino but is what drives widespread Australian and global weather and climate impacts.
All surveyed climate models predict sea surface temperatures (SSTs) across the central tropical Pacific Ocean will be above El Nino thresholds during December, and continue to exceed El Nino thresholds until at least January. Thereafter, several models indicate a gradual cooling trend will occur, while others maintain values consistent with El Nino until at least mid-autumn. All models predict central equatorial Pacific SSTs will be warmer than usual until at least April 2019.
El Nino effects in Australia over summer typically include higher fire risk, greater chance of heatwaves, and fewer tropical cyclones. El Nino onset during December would be later than usual, although not unprecedented.
Indian Ocean IOD
Indian Ocean Dipole Outlook November 20, 2018
A positive Indian Ocean Dipole (IOD) has been underway since early September. The latest weekly index value to 18 November was +0.43 degC, just above the threshold value of +0.40 degC. Given the time of the year, it is likely that this event is near its end, and that values will decline further over the coming weeks.
All but one of the six international climate models surveyed by the Bureau indicate that the positive IOD event will breakdown during December; this would be in line with the typical seasonal pattern of the IOD. Due to the movement of the monsoon trough in the Indian Ocean, the IOD typically has little influence on Australian climate from December to April. When the monsoon trough shifts southwards into the southern hemisphere, it changes the broadscale wind patterns, meaning that the IOD pattern is unable to form.
A positive IOD event typically reduces spring rainfall over much of northern, central and southern Australia, and can exacerbate any potential El Nino-driven rainfall deficiencies. The IOD typically has little influence on Australian climate from December to April.
It is useful to understand where the IOD is measured. This is shown in the below graphic.

IOD Positive is the West Area being warmer than the East Area (with of course many adjustments/normalizations). IOD Negative is the East Area being warmer than the West Area. Notice that the Latitudinal extent of the western box is greater than that of the eastern box. This type of index is based on observing how these patterns impact weather and represent the best efforts of meteorological agencies to figure these things out. Global Warming may change the formulas probably slightly
4. The Surface Air Pressure that Confirms the Nino 3.4 Index
And of course Queensland Australia is the official keeper of the SOI measurements.

SOI = 10 X [ Pdiff – Pdiffav ]/ SD(Pdiff) where Pdiff = (average Tahiti MSLP for the month) – (average Darwin MSLP for the month), Pdiffav = long term average of Pdiff for the month in question, and SD(Pdiff) = long term standard deviation of Pdiff for the month in question. So really it is comparing the extent to which Tahiti is more cloudy than Darwin, Australia. During El Nino we expect Darwin Australia to have lower air pressure and more convection than Tahiti (Negative SOI especially lower than -7 correlates with El Nino Conditions). During La Nina we expect the Warm Pool to be further east resulting in Positive SOI values greater than +7).
Going into more detail from the BOM.

Cloudiness near the Date Line
Cloudiness near the Date Line was mostly above average (negative OLR anomalies) during the last fortnight, with values hovering close to the long-term average in recent days. However, cloudiness has been below average since mid-September. While decreased cloudiness near the Date Line is typically a signal seen during La Nina, the broader pattern across the tropical Pacific is consistent with neutral ENSO. Again, this indicates that coupling of the ocean and atmosphere has yet to occur.
Equatorial cloudiness near the Date Line typically increases during El Nino (negative OLR anomalies) and decreases during La Nina (positive OLR anomalies).
5. Science Theme
No science theme this time.
Conclusion
The mostly likely outcome is that we will have an El Nino and NOAA will declare that El Nino Conditions are in place on December 13, 2018 which is the next time they address that question. But it is not a certainty. And it may be an unusual type of El Nino but perhaps not. When attempting to forecast the ENSO Cycle, one has to be able to handle a lot of humility.


