Written by Sig Silber
Updated at 2 AM EDT October 13 to reflect the Updated Week 3 – 4 Forecast. No surprises.
It is not a surprise that it has been wet. Thus it should not be a surprise that the intensity of the drought is less this week. The location has also changed part of what I have described as a clockwise rotation. The short-term weather forecasts support the idea that this rotation will continue and for now we do not understand the developing El Nino sufficiently to predict exactly where the dry areas will be this winter but we have a pretty idea of this. A dry Northwest is very likely. There are other areas which may also be dry and this may become more clear this month in the next round of seasonal outlook updates.

Please share this article – Go to very top of page, right hand side for social media buttons.
- The U.S. Drought Monitor (full report can be accessed here)
- Selected parts of our Weekly Weather and Climate Report (Monday’s full report can be accessed here) which has forecasts for the next 25 days and which auto-updates
- Selections from the Tuesday USDA Weather and Crop Bulletin (full report can be accessed here). Other useful sources of information that I regularly utilize are the National Integrated Drought Information System (NIDIS) which can be accessed here and the USDA NRCS Weekly and Weather Climate Update which can be accessed here.
Remember if you leave this page to go to links or if you have clicked to enlarge a graphic, in order to get back you need to hit the return arrow usually located on the left of your URL box on the upper left of the screen. Also most of the small graphics are designed to become full size when you click on them. If that does not work, an alternative way to view the larger graphics is to right click and then hit “view image”. That should always work.
This report is now organized as follows:
- Present Drought Conditions
- Last Week’s Weather
- Information from our Weekly Weather Column (the forecast maps auto-update) and combined with brief commentary from me provides a forecast which I attempt to interpret re the likely change in drought conditions
- U.S. Crop Information
- International Crop Information and related weather
- Prior month’s weather and month-to-date weather excluding the prior week when I have that information. Drought is based on cumulative deficits.
- A science theme if we have one.
- Reference Information. (This includes a lot of information on reservoirs that we are not focusing on this week)
1. Present Drought Conditions
The U.S. Drought Monitor is a comprehensive way of understanding the drought situation for the U.S. It is issued every Thursday and reflects the conditions as of the prior Tuesday. Drought is defined as a moisture deficit bad enough to have social, environmental or economic effects. Thus, more factors than recent precipitation are considered and more information on how it is done is found at the end of this report.

Below is the same map but just CONUS and with statistics and below that map I have provided a cut-out of the statistics which I think you can click on to enlarge.


 |
|
The graphic below shows the one-week change in drought intensity. Yellow is bad. Green is good.

This pair of maps might make it easier to get a general idea of what is happening in the worst part of the drought area.
| Last Week | This Week |
 |  |
This map which covers the West may be useful also.


This from the Intermountain West Report provides some background on what has taken place.

Now we show the week to week change information by region. The yellow is where the drought has been upgraded. The green is where the level of drought has been downgraded.
 |
| General Improvement |
 |
| Improvement |
 |
| No Change |
 |
| Mostly improvement especially in the northwest part of this region. |
 |
| Some deterioration but that will change in next week’s report |
 |
| Major Improvement here but it may not last. Especially in the Northwest |
Some may find this way of looking at things useful and I hope these graphics are not too small to read. I did not make them so you could click on them individually but you can click on the whole graphic and it may enlarge. But I think you get the picture. It has been a rapid onset and hopefully it’s demise will also be fairly rapid. When you read these graphics remember that the older graphics are not the drought conditions that existed then but the change from then until now.
Some might find this animation of twelve weeks of change useful;

Here is the discussion which was issued with the Drought Monitor today.
This Week’s Drought Summary
Northeast
Light precipitation fell on most dry areas in the Northeast (Upstate New York eastward through Maine). Exceptions little or no precipitation in the north half of Maine, and slightly larger totals (1.5 to near 3.0 inches) dampened a few areas in Upstate New York and northern Vermont, as well as southeastern Maine.
The nondescript week led to little change in the Drought Monitor. A small patch of Downeast Maine improved from D1 to D0, otherwise conditions persisted from last week.
Southeast
Dry weather prevailed regionwide. Outside a swath in the North Carolina mountains, rainfall was isolated and totaled a few tenths of an inch at best. The dry (and unusually warm) week didn’t result in dramatic changes, but several areas were changed, all for the worse.
Just after the valid Drought Monitor period, Hurricane Michael, having formed and deepened rapidly in the Gulf of Mexico, approached category 5 strength on the on the Saffir-Simpson Scale just before it moved into the central Florida Panhandle, headed northeastward through most of the D0-D1 areas in the South Atlantic States, so the D0 expansion may not last long.
D1 expansion was limited to a small part of far northwestern Alabama. The extant D1 areas in eastern Georgia and southern South Carolina were unchanged. D0 expanded more broadly, particularly in west-central Alabama and over a swath from southwestern Georgia through the eastern Florida Panhandle.
South
Little precipitation fell on Tennessee, Arkansas, Mississippi, and Louisiana this week. As a result, most of the D0 and D1 patches were unchanged, but isolated areas (from one to a few counties in size) in northeastern Mississippi, south-central Tennessee, and northern Arkansas did deteriorate. In most cases, D0 expanded into the region.
Western Louisiana, the southeastern half of Texas, and eastern Oklahoma saw more precipitation than the states farther east, but only scattered small areas recorded over 1.5 inches of rain, insufficient to bring any notable improvement to the D0-D2 areas in that part of Texas.
Farther west, a strong upper-level trough and frontal system brought heavy rain to western Texas and much of Oklahoma. Areas just east of the Texas Panhandle recorded the most rainfall (5 to 10 inches prevailed), but most locations saw recorded over two inches. This substantially alleviated dryness and drought across the region, and most areas of dryness and drought improved from last week by one category. D0-D1 conditions now prevail, with a few areas of D2-D3 remaining in the central Texas Panhandle and west-central Texas.
Midwest
The same strong system that soaked parts of Texas and Oklahoma dropped excessive rains on areas of entrenched D2-D4 drought in northwest Missouri and southern Iowa, and extending into northeastern Kansas. Almost the entire area received at least four inches of rain, with 7 to 12 inches recorded in a broad band across east-central Kansas and northwestern Missouri. The resulting improvement was dramatic, with most areas seeing a 2-category improvement in Drought Monitor classification.
Lesser amounts of rain fell on the existing dry areas farther south in Missouri and across both northern and southeastern Michigan. Amounts were substantial enough to eliminate almost all dryness and drought in Michigan, and create notable improvement to parts of central and southern Missouri.
Precipitation has been generally above normal in northern Minnesota for a few months (extending into the Dakotas), and 1.5 to 3.0 inches fell this past week on much of the region. As a result, D0 and D1 areas close to the Canadian border retracted somewhat.
High Plains
Precipitation has been generally above normal in the Dakotas for a few months (extending into Minnesota), and 1.5 to 3.0 inches fell this past week on central and eastern North Dakota, with light to moderate totals reported elsewhere. Much of these states are covered by dryness and drought of varying intensities. Precipitation was insufficient to bring any changes to South Dakota, but most of the dry areas in North Dakota, ranging from D0 to a small area of D3, all retracted a bit.
Farther south, existing areas of dryness and drought in east-central and northeastern Kansas were inundated by the heavy to excessive rainfall from the same system that impacted Missouri. And, also like Missouri, the areas of dryness and drought improved dramatically, with 2-category Drought Monitor improvements common.
Looking westward, areas of moderate precipitation were observed in Colorado and Wyoming, most notably in western Colorado (1.5 to locally 3.5 inches). A more broken pattern of moderate to heavy precipitation existed elsewhere; light precipitation was most prevalent in northern and eastern Wyoming.
The precipitation was beneficial in the Upper Colorado River Basin and in southeastern Colorado, where a good hydrologic response to the precipitation was observed. Dry soils were recharged somewhat, and streamflows notably increase. The large, intractable areas of extreme to exceptional drought remain entrenched, but a few areas showed mild improvement, and this is reflected in parts of the D3 to D4 areas in the Drought Monitor. Adjacent D0 to D2 areas, where dryness is less protracted and intense, showed a bit more recovery.
West
Unsettled weather dominated the region. Outside southern California and adjacent Nevada, most areas recorded at least a few tenths of an inch of rain, with scattered locations reporting multiple inches. Heavier precipitation was most prevalent in western Washington and much of Utah, but especially in much of Arizona. There, the remains of Hurricane Rosa brought unseasonably heavy precipitation (1.5 inches to locally over one-half foot) to a large region centered on the middle of the state. Most other sections of Arizona recorded 0.5 to 1.5 inches.
Drought usually changes slowly in the west, but this past week in Arizona is a marked exception. Broadscale 1-category improvements were made almost statewide, with a few small spots of 2-category improvements introduced where the heaviest rains fell.
In other parts of the West, conditions almost universally persisted or improved, with only isolated deterioration observed. Numerous areas of improvement (the size of one to a few counties) were made across New Mexico as well as western Washington, as the rainy season finally got underway in the form of one to several inches of precipitation, particularly in orographically-favored areas. A few spots in Utah experienced notable improvement from recent precipitation, and farther north, a number of improvements were made in Montana and adjacent Idaho. Improved areas have surpluses accumulated over the course of at least a few months.
Alaska, Hawaii, and Puerto Rico
Storminess in Hawaii led to continued improvement there. Drought has been eliminated, and only two small areas remain in D0 near the coast in northwestern Maui and northwestern Hawaii Island. Dryness and drought did not change substantially in Alaska and Puerto Rico.
Looking Ahead
During the next 5 days (October 11-15), Tropical Storm Michael is forecast to rapidly track northeast from Georgia to the southern mid-Atlantic on October 11.Michael is then likely to move away from the East Coast on October 12. A swath of heavy to excessive rainfall (locally more than 5 inches) is expected to occur across the flood prone areas of the Carolinas that received extremely heavy rainfall from Hurricane Florence. Meanwhile, Tropical Storm Sergio is forecast to track northeast towards the California Baja Peninsula with its remnant low merging with a strong cold front. Moderate to heavy rainfall (0.5 to 2 inches) is expected from southeast Arizona northeast to the southern Great Plains and Ozarks region. An amplifying upper-level ridge is likely to result in dry weather across the Pacific Northwest during this period.
For the CPC 6-10 day extended range outlook (October 16-20)), indicates that a high amplitude pattern is likely to persist through mid-October. An upper-level ridge (trough) is forecast over western (eastern) North America. This predicted upper-level pattern yields an increased chance for below-normal temperatures across the central and southern Rockies, Great Plains, Mississippi Valley, Corn Belt, and Northeast. Increased chances of above-normal temperatures are forecast across the Pacific Northwest and California, while above-normal temperatures are expected to persist over Florida. A drier pattern is likely over much of the continental U.S. due to the high amplitude ridge. However, a slight tilt in the odds for above-normal precipitation is forecast across the Southwest and along the East Coast. Enhanced odds for above-normal precipitation and above-normal temperatures are forecast throughout Alaska.
Wildfires are happening.

The below are the forecasts by month for wildfires. Notice the area of risk is shrinking.


Additional information can be found here.
And we do not want to ignore floods.

Reservoirs and Stream Flow

Let us look at California

2. Last Week’s Weather
Here is what happened with precipitation during the most recent week. The maps are in sync with the crop reports.

It is useful to look at temperature in a few different ways.
First let’s look at the Minimum Temperature.

And now the weekly maximum temperature

And for many purposes the average deviation from Normal or Climatology is very useful.

And here is a graphic that pulls a lot of information together. Image provided by the NOAA/ESRL Physical Sciences Division, Boulder, Colorado see website. It shows the demands of the atmosphere for moisture from the ground and is based on temperature, wind, relative humidity and solar radiation. It tells you nothing about how much precipitation you will get but how much you need to retain the same level of soil moisture.
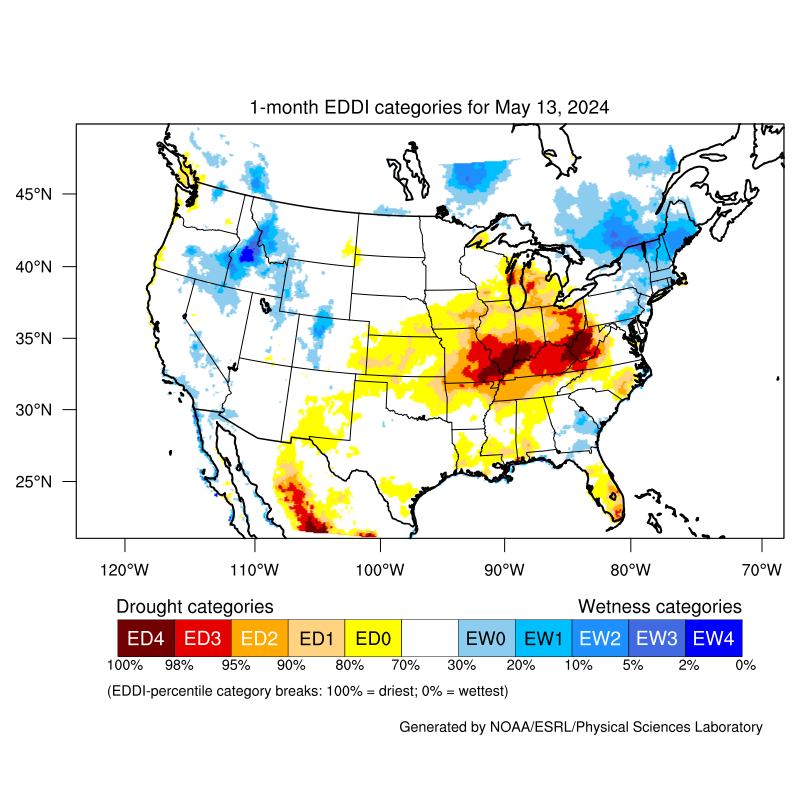
The darker areas would appear to have a big problem with pronounced drought and high levels of atmospheric demand for moisture from the ground and wind also appears to be an issue. Right now, the Southwest still has the largest problem.

Soil Moisture is a very important part of understanding drought. I uploaded the graphics in pairs this week (which is easier for me and we will see if they are still able to be read. You can click on them and the pair will enlarge.
| Surface | Subsurface |
 |  |
The numbers in parentheses show the changes by state. Re the situation with surplus water, the number of states with Topsoil (near surface) surpluses has increased by 5 from last week and the number of states with Subsoil (subsurface) surpluses has increased by 2. It is not always easy to know how to relate to a moisture surplus. Is it a positive moisture reserve or is it too wet to work the ground? | |
Re those states with deficiencies, The number of states with Topsoil (near-surface) deficiencies has decreased by 4 from last week and the number of states with Subsoil (deeper) deficiencies has decreased by 3. | |
3. Current Forecast for Precipitation.
First we show the Month of October Forecast Issued on September 30 and then the Seasonal Forecast through December which was issued on September 20 with the full Seasonal Outlook. These two forecasts are issued by the same agency but to obtain them you need to access two different links here and here. We either show the latest or both in this report. Sometimes we show them in more than one place in this report for the convenience of the reader.

And here is the longer seasonal drought forecast.

And now the current precipitation forecasts so that we can make our own assessment of the drought forecast. Here I provide the weather forecasts for different periods of time in October which should allow the reader to assess the likelihood of this forecast working out as shown over the next three to four weeks. (Since we publish this week on Thursday, we will update the discussion for the Week 3 – 4 forecast when it is updated on Friday October 12). This is important as the current Day 6 – 14 forecasts and the week-old week 3 – 4 forecast overlap to some extent.
Now let’s look at the forecasts. Because temperature is so important right now re this drought I have switched over to the same format we use on Mondays. When we publish Thursday night, the Week 3 – 4 forecast is a week old but it then updates on Friday and we have now adjusted the commentary accordingly.
First Temperature
 |  |  |  |
| This shows magnitude rather than probability of being higher or lower than Normal and shows the middle day of the five day period. | Cool anomaly is shifting slowly east which allows the Western warm anomaly to expand. This does not help with the Western Drought. | ↑ It is not favorable for the West but a warm anomaly in Mid-October is not as warm as one during the summer. | |
 |  |  |  |
The five day QPF is shown above. The units are different than the other maps i.e. in units of precipitation (inches) not probabilities of exceeding or being less than climatology. | The pattern is moving west to east. It is favorable for the Southwest Drought, and the easing Southern Plains Drought but not for the Northwest Drought which may extend to the east. | ↑ ← The current Week 3 – 4 forecast was updated on Friday October 12 It is favorable for theSouthwest but not the Northwest. . | |
Here is another useful graphic from my weekly report which also updates automatically.

The below is of interest.

4. U.S. Crop Information

The below is repeated from last week.

Below are more details and there is more information this week as the planting season advances.
This summarizes the situation which is not very much different than the report last week. In some cases there is slight improvement and this is best seen in the detailed tables below. It is getting to be difficult preparing this table separate from the information above and below. The reason for that is that in general there are at this point in time three parameters reported:
1. percent planted
2. percent that has developed to a key point
3. crop condition
Plus there are two reference points: last year and the five year average. So it is harder to assess the six measurements and arrive at a single conclusion for a crop but I have taken my best shot at it. For those with a more serious interest I suggest you review the tables below and the text summary above which is what I have done to populated this table which has not changed since last week.
| Worse than last year and or 5-Yr average | Better than last year or 5-Yr average | In line with recent conditions for this time of the prior year or 5 – Yr Average |
| 2018 Winter Wheat (low yields)**, Cotton, and Sorghum | Corn, Oats**, Barley**, Soybeans, Spring Wheat** | Rice, Sunflowers (no recent of reports for sunflowers), 2019 winter wheat, Range Conditions**, Sugarbeets, pasture and rangeland and peanuts |
** Close to completion for this years crop and 2019 planting has begun or soon will


5. International Crop and Weather Related Information

Sometimes a map is useful.

I am now routinely including the precipitation report for Mexico since storms do not respect borders.


Here is the six-month result of these dry weeks.
6. Prior Month and when available the Current Month-to date Weather (excluding prior week)
Prior Month i.e. September


Rankings of September
First Temperature

Then Precipitation

Current Week
For reference purposes here is the precipitation information for the prior seven days.

Then we show month to date data.

And then temperature:

You can generate a wide variety of different graphics here.
International Report for August. We published that two weeks ago and one can refer to that information in that article which can be accessed here. We will have that report for September soon.
7. Science Theme When we Have One.
No Science Theme this week.
8. Additional Reference Information
Reservoir Status
We update these graphics when we receive new ones. They do not auto-update. They tend to change slowly.


This article provides a little background on the problem.
We have added more rivers to the discussion. Above we have reservoirs and they are of course connected by rivers. Both are important and provide insight.


A more complete description of


Sequence of drought occurrence and impacts for commonly accepted drought types. All droughts originate from a deficiency of precipitation or meteorological drought but other types of drought and impacts cascade from this deficiency. (Source: NDMC)
Source: National Drought Mitigation Center, University of Nebraska-Lincoln, U


