Written by Sig Silber
NOAA issues their Outlook on the Third Thursday and JAMSTEC always seems to have theirs out by then so comparison is feasible. JAMSTEC covers the entire World in their forecast. This report contains a JAMSTEC World Forecast through May of 2019 and a NOAA Alaska and CONUS forecast through November of 2019. The big difference is Spring of 2019 and this seems to be a result of JAMSTEC predicting a two-year El Nino with NOAA right now predicting a one-year event. There are other factors involved but it may be more complicated than it is worth to try to sort out why the Spring 2019 temperature forecasts are so different.

Please share this article – Go to very top of page, right hand side for social media buttons.
| NOAA | JAMSTEC One Year | JAMSTEC Two Years |
 |
|  |

| NOAA | JAMSTEC |
 |  |
Summary:
This report is organized into a summary that has two tables of graphics that show the temperature and precipitation forecasts for the upcoming three seasons, A brief discussion of the ENSO assumptions by both NOAA and JAMSTEC and then a lengthy analysis which is organized into three parts:
A. A full discussion of the recent NOAA Seasonal Outlook
B. A comparison between the NOAA and JAMSTEC Forecasts.
C. A more detailed analysis of the forecasts for ENSO by NOAA and JAMSTEC and others including the Australian Bureau of Meteorology and other factors influencing the forecasts.
For those who want a quick synopsis of the two forecasts, below is a summary of the temperature and precipitation forecasts for three time-periods and from left to right the NOAA forecast for Alaska and CONUS (the contiguous mid-latitude U.S), then JAMSTEC for North America (which includes Canada and Mexico), and then JAMSTEC for Europe and surrounding areas. Larger graphics are provided later in the report. It is kind of a tease to keep you reading but you can see the evolution of the weather pattern through Summer, Fall and into Winter. For some readers, these two sets of summary graphics may be all the information they wish to look at and that is fine.
Temperature
| NOAA Alaska Plus CONUS | JAMSTEC North America | JAMSTEC Europe | |
SON Fall Temp |  |  |  |
DJF 2018 – 2119 Winter Temp |  |  |  |
MAM 2019 Spring Temp | | |  |
Precipitation
| NOAA Alaska Plus CONUS | JAMSTEC North America | JAMSTEC Europe | |
SON Fall Precip |  |  |  |
DJF 2018-2019 Winter Precip |  |  |  |
MAM Spring Precip |  |  |  |
This is a summary of the ENSO forecasts of the two agencies.
|  |
| This NOAA CFS.V2 Model keeps us in marginal to moderate El Nino through the forecast period but with declining intensity. I have drawn the +0.5C El Nino threshold line. | The IRI/CPC Model moves into Neutral for the Fall but the odds tail off during the Winter heading into Spring. But you can not tell the intensity of the El Nino from this graphic. |
| This makes it very difficult to know what the basis of the NOAA forecast is. But this month there is not a lot of difference between these two views. | |
| JAMSTEC quickly goes to El Nino values and maintains them into the Spring of 2018/2019. But the intensity of the El Nino is less than in the forecast last month. |
| El Nino as measured by the Nino 3.4 Index starts soon, has a double peak, and is in decline but not back to Neutral until February 2020. So it is a two-year El Nino. |
|
I am not sure how to interpret this graphic. It is what JAMSTEC calls their Modoki Index. It is reading lower than their standard index but it is in El Nino Territory. It may well impact the Spring of 2019 forecast but the El Nino is just starting to be more westerly displaced at that time so it is not exactly clear to me what is happening here. |  |
NOAA relies on a variety of forecasts including the CPC/IRI forecast. We did not include the CPC/IRI discussion as we believe it is well covered in the general NOAA discussion shown later.
A part of forecasting is the forecast of Sea Surface Temperatures (SST) as this is very important for many forecasting models.
 |  |
 |  |
 |  |
Updates from JAMSTEC can be found here. Updates from NOAA can be found here. You have to look for the SST row and go to the right where it says “normalized with mask” and click on E3 which provides the latest model run.
A. Focus on the NOAA Update
A note about terminology; the deviations from climatology/normal are color coded but also labeled “A” for more than (above) normal and “B” for less than (below) normal. The area designated EC means Equal Chances of being more or less than normal. JAMSTEC relies on their color coding. In my comments I have used EC to cover all the situations where a clear anomaly is not shown. So the words “warm”, “cool”, “wet”, “dry” should be generally interpreted as being relative to climatology/normal for that location and time of year.
First we will take a look at the NOAA Early Outlook for September 2018. It is called the Early Outlook because it will be updated at the end of August. Only the September Outlook will be updated at that time.
Temperature

Precipitation

We have nothing to compare these maps with as NOAA does not in their Update provide a forecast for each of the subsequent two months separate from their three-month forecast. Thus I do not have previously forecast maps for September from the previous NOAA Report to compare against. And the current month is not over so we can not really compare the forecast for next month against the actual for this month. It is probably best to just try to understand what NOAA is trying to convey about September which for Temperature will be warm but with a large swath of EC running southeast from North Dakota to the Southeast Coast. Re precipitation, we see a wet East Coast and Monsoon area and Northwest Alaska and we see a Northwest dry anomaly which extends to the Alaskan Panhandle and a strip of the western Gulf States near the Gulf of Mexico.
Visual Consistency Testing.
It is useful to see how the month forecast fits with the set of shorter forecasts that we have. But since the Seasonal Outlook was issued on August 16 which is almost the earliest it is ever issued, some of our short term forecast maps fall in August but we include them as they show the trend.
First Temperature
 |  |  |
| The new monthly forecast is to the right. Does it appear to be reflective of the three parts of the month for which we have forecasts? → |
| ↑ ← The full month forecast seems to fit well with the 8- 14 day and the Week 3/4 forecast but does not fully capture the cool anomaly. But, we do not have the last part of the month in the sequence of maps above. The Early Outlook for September was issued on August 16 so it may very well be changed on August 31 when updated. |
And then Precipitation
 |  |  |
| The new monthly forecast is to the right. Does it appear to be reflective of the three parts of the month for which we have forecasts? → |
| ↑ ← The concatenation of the 8-14 Day and Week 3-4 Map seems to fit fairly well. But we do not have the last part of the month in the sequence of maps above. The Early Outlook for September was issued on August 16 so it may very well be changed on August 31 when updated. |
Now we consider the three-month Outlook.
Notice that the three-month periods are abbreviated e.g. September/October/November is shown as SON. You will see such abbreviations often in this report.
Prior Temperature Outlook for SON 2018

New Temperature Outlook for SON 2018
Prior Precipitation Outlook for SON 2018

New Precipitation Outlook for SON 2018
It seemed to make sense to have this Australian BOM forecast here.
.
It is kind of amazing that you can make a worldwide forecast based on just one parameter the SOI and changes in the SOI. Basically it is a La Nina forecast as the SOI was rising during June and July. It supports the difficulty NOAA describes in their discussion re preparing a forecast for September during this transition from ENSO Neutral to El Nino.
Now let us focus on the long-term situation and compare the new set of maps with the maps issued on July 19, 2018.
Prior 14 Month Temperature Outlook: SON 2018 – ASO 2019

New 14 Month Temperature Outlook: OND 2018 – SON 2019
To compare maps from one release to another, one needs to remember that the new release drops one three-month period and adds a later one. So to make the comparisons one has to shift the new maps to the right one position and that makes the map on the right drop down to become the left-most map in the next level. I do not have a computer software tool for doing that for you so you have to do it mentally. When I do the comparison, I print the two sets of maps and put them side by side and number the same three-month maps 1, 2, 3,…..,11 in both sets of maps to make it easier for me to easily compare the same three-month period in the new with the previous forecast. One uses the same procedure to compare the precipitation maps. Based on this procedure, I conclude that:
Now Precipitation
Prior 14 Month Precipitation Outlook: SON 2018 – ASO 2019

New 14 Month Precipitation Outlook: OND 2018 – SON 2019
If you want larger versions of each map (temperature and precipitation) you can find them here. And then each of those maps can be clicked on to further enlarge them.
Sometimes it is useful to compare the three-month outlook to the forecast for the first of the three months. It shows how much the pattern changes over the three-month period.

One can mentally subtract the First-Month Outlook from the Three-month Outlook and create the Outlook for the last two months in the three-month period.
Below are excerpts (significantly reorganized and with a lot of the redundancy and discussion of methodology removed) from the Discussion released by NOAA on August 16, 2018. Headings that are “Initial Cap” only rather than all caps were added by the Author of this Update Report for clarity. Also we have organized the sequence of the sections of NOAA Discussion to first present the Atmospheric and Oceanic Conditions and then the Initial Month, the Three-month period, and finally the remainder of the 15 Month Forecast. We think that sequence with the three- to four-month period broken out separately, makes the discussion more useful for more readers.
NOAA Discussion
CURRENT ATMOSPHERIC AND OCEANIC CONDITIONS
OCEANIC AND ATMOSPHERIC OBSERVATIONS ACROSS THE EQUATORIAL PACIFIC INDICATE ENSO-NEUTRAL CONDITIONS HAVE PERSISTED INTO EARLY AUGUST. OBSERVED WEEKLY SSTS INDICATE POSITIVE ANOMALIES OVER ALMOST THE ENTIRE EQUATORIAL PACIFIC OCEAN, WITH ANOMALIES EXCEEDING 0.5 C GENERALLY WEST OF THE INTERNATIONAL DATE LINE. POSITIVE SUBSURFACE TEMPERATURE ANOMALIES HAVE PERSISTED INTO EARLY AUGUST, AT DEPTHS OF 50 TO 300 METERS FROM 130 E TO 130 W LONGITUDE AND NEAR THE SURFACE IN THE EASTERN PACIFIC. PERSISTENT SUBSURFACE POSITIVE HEAT ANOMALIES CONTRIBUTE TO THE CONTINUED LIKELIHOOD OF THE DEVELOPMENT OF EL NINO CONDITIONS BY AUTUMN 2018.
OUTGOING LONGWAVE RADIATION (OLR) ANOMALIES INDICATED SUPPRESSED CONVECTION OVER PARTS OF THE WESTERN MARITIME CONTINENT AND NEAR THE INTERNATIONAL DATE LINE. LOW-LEVEL WINDS WERE NEAR AVERAGE OVER MOST OF THE EQUATORIAL PACIFIC, WHILE UPPER-LEVEL WESTERLY WIND ANOMALIES WERE OBSERVED OVER THE EASTERN TROPICAL PACIFIC OCEAN. OVERALL, ATMOSPHERIC CONDITIONS INDICATE THE CONTINUATION OF ENSO-NEUTRAL CONDITIONS.
PROGNOSTIC DISCUSSION OF SST FORECASTS
THE CPC SST CONSOLIDATION (CON) FOR THE NINO 3.4 REGION PREDICTS THE LIKELIHOOD OF TEMPERATURE ANOMALIES GREATER THAN POSITIVE 0.5 DEGREES C TO BE GREATER THAN 50 PERCENT BY ASO WITH POSITIVE ANOMALIES PEAKING AT ABOUT POSITIVE 1.0 DEGREES C DURING NDJ 2018-19. THE SST CONSTRUCTED ANALOG, MARKOV MODEL, AND CFS INDICATE PEAK ANOMALY VALUES GREATER THAN POSITIVE 1.0 DEGREES C THIS UPCOMING WINTER. THE CPC/IRI CONSENSUS FORECAST FAVORS THE ONSET OF EL NINO DURING THE NORTHERN HEMISPHERE AUTUMN WITH PROBABILITIES OF EL NINO AROUND 70 PERCENT DURING NDJ AND DJF 2018-19.
30-DAY OUTLOOK DISCUSSION FOR SEPTEMBER 2018
AS WE ENTER THE AUTUMN MONTHS, FORECAST PREDICTABILITY OFTEN DECREASES ESPECIALLY FOR THE MONTHS OF SEPTEMBER AND OCTOBER. THESE ISSUES ARE FURTHER ENHANCED WHEN CONSIDERING A HALF-MONTH LEAD MONTHLY FORECAST SUCH AS THE SEPTEMBER TEMPERATURE AND PRECIPITATION OUTLOOK PRESENTED HERE AS INFORMATION ACROSS TIME SCALES (THE EXTENDED RANGE, SUBSEASONAL, AND SEASONAL PERIODS) CAN INFLUENCE THE EVENTUAL OBSERVED FINAL MONTHLY TEMPERATURE AND PRECIPITATION PATTERNS. THESE CONSIDERATIONS RESULT IN RATHER SIZABLE AREAS DEPICTING EQUAL CHANCES (EC) FOR THE THREE FORECAST CATEGORIES.
Temperature
THE SEPTEMBER OUTLOOK DEPICTS ELEVATED ODDS OF ABOVE-NORMAL MONTHLY MEAN TEMPERATURES FOR MOST OF ALASKA BASED ON SIGNIFICANTLY ABOVE-AVERAGE SSTS OFF THE WEST COAST OF THE STATE (LOCATION OF THE GREATEST PROBABILITIES) AND THE MAJORITY OF DYNAMICAL MODEL GUIDANCE. FAVORED ABOVE-NORMAL TEMPERATURES ARE ALSO NOTED FOR THE FAR WESTERN CONUS AS SUBSEASONAL AND SEPTEMBER MONTHLY INTEGRATED FORECAST GUIDANCE ARE CONSISTENT IN DEPICTING WARMER THAN NORMAL CONDITIONS IN THESE AREAS.
THE FORECAST FOR THE SOUTHWEST CONUS INDICATES ONLY SLIGHTLY INCREASED PROBABILITIES FROM CLIMATOLOGY FOR ABOVE NORMAL TEMPERATURES DUE TO CONFLICTING INFORMATION. STRONG POSITIVE LONG TERM TRENDS ARE OFFSET BY FORECAST GUIDANCE FAVORING ABOVE NORMAL RAINFALL AND BELOW NORMAL TEMPERATURES IN SOME AREAS.
MOVING EASTWARD TO THE INTERIOR CONUS, EC IS FORECAST FOR THIS REGION DUE TO COMPETING FACTORS. THESE INCLUDE EARLY IN THE MONTH SUBSEASONAL FORECAST GUIDANCE FAVORING BELOW NORMAL TEMPERATURES, HIGH FORECAST UNCERTAINTY AND LIKELY LARGE VARIABILITY DURING THE SECOND HALF OF THE MONTH, AREAS OF DRY SOIL MOISTURE CONDITIONS AND LOW-FREQUENCY IMPACTS SOME OF WHICH WOULD TEND TO SUPPORT WARMER THAN NORMAL CONDITIONS IN SOME AREAS. STRONG POSITIVE LONG TERM TRENDS AND SOME FORECAST GUIDANCE INFORMATION PRIMARILY FAVOR ELEVATED ODDS OF ABOVE NORMAL TEMPERATURES ALONG THE GULF COAST AND IN THE NORTHEAST CONUS.
Precipitation
THE SEPTEMBER PRECIPITATION OUTLOOK FAVORS ABOVE NORMAL TOTAL MONTHLY PRECIPITATION AMOUNTS FOR WESTERN ALASKA ASSOCIATED WITH POTENTIAL ELEVATED MOISTURE DUE TO LARGE POSITIVE SST DEPARTURES FROM CLIMATOLOGY IN COASTAL AREAS AS WELL AS SIGNATURES FROM MODEL FORECAST GUIDANCE.
THE SOUTHWEST MONSOON IS ANTICIPATED TO REMAIN NEAR TO ABOVE AVERAGE DURING ITS FINAL MONTH AS ABOVE NORMAL SSTS OFF THE WESTERN COAST OF NORTH AMERICA ARE LIKELY TO MAINTAIN, ON AVERAGE, AN ACTIVE EAST PACIFIC OCEAN ITCZ AND TROPICAL CYCLONE SEASON RESULTING IN POTENTIAL MOISTURE SURGES INTO THE SOUTHWEST PORTION OF THE CONUS.
STRONG SUBTROPICAL ATLANTIC RIDGING AND ASSOCIATED MEAN FLOW TO THE SOUTHEAST AND MID-ATLANTIC COAST FAVORS ENHANCED ODDS OF ABOVE NORMAL PRECIPITATION IN THESE AREAS. FORECAST GUIDANCE FAVORS BELOW NORMAL PRECIPITATION IN THE PACIFIC NORTHWEST WHILE CONDITIONS ACROSS THE CARIBBEAN AND ATLANTIC MAIN DEVELOPMENT REGION (MDR) LOWER THE ODDS FOR MOISTURE TRANSPORT TO THE GULF COAST AND LONG TRACK TROPICAL SYSTEMS TO ENTER AND PERSIST IN THE GULF OF MEXICO. THESE FACTORS FAVOR BELOW NORMAL MONTHLY PRECIPITATION AMOUNTS FOR THE TEXAS AND LOUISIANA COAST.
PROGNOSTIC TOOLS USED FOR U.S. TEMPERATURE AND PRECIPITATION OUTLOOKS
THE CONTINUED LIKELIHOOD OF EL NINO DEVELOPMENT IS A LARGE FACTOR IN THE AUTUMN 2018 AND WINTER 2018-19 OUTLOOKS. TOOLS USED FOR THE SEASONAL OUTLOOKS INCLUDED DYNAMICAL MODEL FORECAST GUIDANCE SUCH AS THE NORTH AMERICAN MULTI-MODEL ENSEMBLE (NMME), AS WELL AS STATISTICAL GUIDANCE SUCH AS THE ENSO-OCN REGRESSION FORECAST, THE SST-BASED CONSTRUCTED ANALOG, AND CANONICAL CORRELATION ANALYSIS (CCA). A RELATIVELY NEW TOOL IN THE CPC SUITE IS THE CBAM, OR CALIBRATION, BRIDGING, AND MERGING FORECAST TOOL. THIS USES A BAYESIAN APPROACH TO THE NMME MODEL CALIBRATION AND CONSOLIDATION, AS WELL AS A HYBRID STATISTICAL-DYNAMICAL FORECAST, IN WHICH NMME CONSTITUENT-MODEL NINO 3.4 FORECASTS ARE STATISTICALLY BRIDGED TO PREDICTED TEMPERATURE AND PRECIPITATION USING A BAYESIAN MODEL. THE OUTLOOKS DURING THE 2019 WARM SEASON WERE BASED PRIMARILY ON THE ENSO-OCN TOOL, WHICH INCORPORATES DECADAL CLIMATE TRENDS AND ANY RESIDUAL IMPACTS OF ENSO VARIABILITY.
DURING THE AUTUMN AND WINTER 2018-19, THE TEMPERATURE AND PRECIPITATION OUTLOOKS ARE CONSISTENT WITH THE ELEVATED PROBABILITY OF EL NINO DEVELOPMENT AND ITS IMPACTS, WITH DJUSTMENTS RELATED TO MODEL FORECASTS AND DECADAL TIMESCALE CLIMATE TRENDS. TEMPERATURE OUTLOOKS FOR WINTER 2018-2019 WERE MODIFIED OVER PARTS OF THE CENTRAL PLAINS AND SOUTHWEST REGIONS TO REPRESENT THE MODERATION OF PROBABILITIES FOR ABOVE NORMAL TEMPERATURES BY A POTENTIAL SHIFT OF THE JET STREAM AND STORM TRACKS SOUTHWARD, DUE TO THE IMPACTS OF A POTENTIAL EL NINO. PRECIPITATION OUTLOOKS FOR WINTER 2018-2019 WERE MODIFIED TO REMOVE ABOVE NORMAL PRECIPITATION AREAS FROM THE CENTRAL PLAINS, WHERE THE SIGNAL DUE TO EL NINO IS WEAK. AREAS OF PROBABLE ABOVE NORMAL PRECIPITATION IN LATE WINTER 2018-2019 AND EARLY SPRING 2019 OUTLOOKS WERE EXPANDED WESTWARD INTO SOUTHERN CALIFORNIA, REPRESENTING IMPACTS OF THE POTENTIAL SHIFT IN THE STORM TRACK DUE TO EL NINO.
Three Months September – October – November 2018
Temperature
THE SEPTEMBER-OCTOBER-NOVEMBER (SON) 2018 TEMPERATURE OUTLOOK INDICATES LIKELY ABOVE NORMAL TEMPERATURES ACROSS A MAJORITY OF THE FORECAST DOMAIN, ALTHOUGH EQUAL CHANCES OF BELOW, NEAR, OR ABOVE NORMAL TEMPERATURES ARE FORECAST FOR PARTS OF THE OUTHEAST REGION. THE HIGHEST PROBABILITIES FOR ABOVE NORMAL TEMPERATURES OVER THE CONUS EXCEED 50 PERCENT FOR MUCH OF THE SOUTHWEST AND THE NORTHEAST. PROBABILITIES GREATER THAN 70 PERCENT FOR ABOVE NORMAL TEMPERATURES ARE INDICATED FOR NORTHWESTERN ALASKA.
Precipitation
THE SON 2018 PRECIPITATION OUTLOOK INDICATES ENHANCED PROBABILITIES FOR ABOVE NORMAL PRECIPITATION FOR COASTAL STATES OF THE SOUTHEAST, AS WELL AS OVER THE AREA EXTENDING FROM SOUTHERN CALIFORNIA AND THE DESERT SOUTHWEST INTO THE GREAT BASIN AND CENTRAL ROCKIES. INCREASED CHANCES FOR ABOVE NORMAL PRECIPITATION ARE ALSO FORECAST ACROSS MAINLAND ALASKA. BELOW NORMAL PRECIPITATION IS MORE LIKELY FOR MUCH OF THE PACIFIC NORTHWEST.
PROGNOSTIC DISCUSSION OF OUTLOOKS – SON 2018 TO SON 2019 (with a focus on periods subsequent to SON 2018)
TEMPERATURE
ABOVE NORMAL TEMPERATURES ARE LIKELY FOR MUCH OF THE CONUS AND ALASKA DURING SON 2019 WITH THE HIGHEST PROBABILITIES OVER THE CONUS FORECAST FOR THE FOUR CORNERS AND NORTHEAST REGIONS, BASED ON CALIBRATED NMME FORECASTS, USING PROBABILITY ANOMALY CORRELATIONS, AND DECADAL CLIMATE WARMING. THE CBAM FORECASTS INDICATE GREATER UNCERTAINTY AND WEAKER PROBABILITIES FOR AREAS OF THE NORTHWEST CONUS THAN THE PREVIOUS OUTLOOK. PROBABILITIES OF ABOVE NORMAL TEMPERATURES WERE ALSO DECREASED SLIGHTLY FOR PARTS OF THE SOUTHWEST IN THE DJF AND JFM 2019 OUTLOOKS, BASED ON THE LATEST CALIBRATED NMME MODEL GUIDANCE. EQUAL CHANCES FOR BELOW, NEAR, OR ABOVE NORMAL TEMPERATURES ARE FORECAST FOR PARTS OF THE SOUTHEAST REGION FROM AUTUMN INTO WINTER OUTLOOKS, WHERE TEMPERATURES ARE MODERATED BY THE POTENTIAL IMPACTS OF A DEVELOPING EL NINO, AND UNCERTAINTY IS GREATEST.
THE ELEVATED CHANCES FOR EL NINO DEVELOPMENT WERE A FACTOR IN THE TEMPERATURE OUTLOOKS, BEGINNING IN THE AUTUMN AND BECOMING MORE PROMINENT DURING THE WINTER 2018-19. BASED ON REGRESSIONS FROM THE CPC NINO 3.4 SST CONSOLIDATION FORECASTS, PROBABILITIES FOR ABOVE NORMAL TEMPERATURES ARE GREATEST, EXCEEDING 50 PERCENT, FOR PARTS OF THE PACIFIC NORTHWEST AND OVER PARTS OF THE NORTHERN PLAINS AND GREAT LAKES REGION, DURING WINTER SEASONS. AN EXPECTED LACK OF SEA ICE ELEVATES CHANCES FOR ABOVE NORMAL TEMPERATURES FOR WESTERN AND NORTHERN COASTAL AREAS OF ALASKA DURING THE AUTUMN SEASONAL OUTLOOKS. TEMPERATURE OUTLOOKS AT LONGER LEAD TIMES, FOLLOWING THE FMA 2019 SEASON, INDICATE ELEVATED PROBABILITIES OF ABOVE NORMAL TEMPERATURES FOR MOST OF THE FORECAST DOMAIN, PRIMARILY BASED ON DECADAL CLIMATE TRENDS. CLIMATE TREND SIGNALS ARE WEAKEST FOR PARTS OF THE NORTHERN CENTRAL CONUS FROM MJJ THROUGH ASO 2018, WHERE EQUAL CHANCES OF BELOW, NEAR AND ABOVE NORMAL TEMPERATURES ARE INDICATED.
PRECIPITATION
THE PRECIPITATION OUTLOOKS ARE BASED PRIMARILY ON THE LATEST DYNAMICAL MODEL GUIDANCE FROM THE NMME AND IMPACTS OF A POTENTIAL EL NINO, FOR SON 2018 THROUGH MAM 2019. ABOVE NORMAL PRECIPITATION IS LIKELY FOR A LARGE AREA OF THE SOUTHWEST CONUS IN THE SON 2018 OUTLOOK, EXTENDING NORTHWARD AS FAR AS SOUTHERN IDAHO AND WYOMING, WITH THE PREDICTION OF AN ENHANCED MONSOON, AS WELL AS THE POTENTIAL FOR MOISTURE SURGES FROM THE EASTERN TROPICAL PACIFIC, WHICH EXPANDS THE AREA OF PROBABLE ABOVE NORMAL PRECIPITATION INTO SOUTHERN CALIFORNIA. OUTLOOKS FOR OND 2018 THROUGH MAM 2019 RESEMBLE THE CANONICAL PATTERN OF EL NINO IMPACTS, WITH ENHANCED CHANCES OF ABOVE NORMAL PRECIPITATION FOR PARTS OF THE SOUTHERN CONUS, AND BELOW NORMAL PRECIPITATION LIKELY IN THE PACIFIC NORTHWEST THROUGH DJF 2018-2019 AND FOR THE MIDWEST REGION LATER IN THE UPCOMING WINTER. THE LATEST PRECIPITATION FORECASTS FROM THE NMME AND CBAM INCREASE PROBABILITIES OF ABOVE NORMAL PRECIPITATION FOR PARTS OF THE SOUTHWEST IN EARLY WINTER 2018-2019. PROBABILITIES OF ABOVE NORMAL PRECIPITATION ARE ENHANCED FOR SOUTHERN ALASKA FROM SON 2018 THROUGH FMA 2019, AS INDICATED BY TOOLS BASED ON THE IMPACTS OF EL NINO, SUCH AS THE ENSO-OCN AND BRIDGED NMME-BASED CBAM FORECASTS. PROBABILITIES OF ABOVE NORMAL PRECIPITATION ARE ENHANCED FOR OTHER AREAS OF ALASKA, INCLUDING WESTERN AND NORTHERN COASTAL REGIONS, DUE TO POSITIVE DECADAL TRENDS IN PRECIPITATION RELATED TO POSITIVE ATMOSPHERIC TEMPERATURE TRENDS AND REDUCED SEA ICE COVER.
THE PRECIPITATION OUTLOOKS FOR AMJ 2019 THROUGH SON 2019 ARE PRIMARILY BASED ON DECADAL CLIMATE TRENDS. PRECIPITATION TRENDS ENHANCE THE CHANCES OF ABOVE NORMAL PRECIPITATION FOR PARTS OF THE NORTHEAST CONUS FROM AMJ THROUGH SON 2019, AND ENHANCE THE CHANCES OF BELOW NORMAL PRECIPITATION FOR PARTS OF THE NORTHWEST CONUS IN MJJ THROUGH ASO 2019.
B. Now we begin our comparison of the NOAA and JAMSTEC Forecasts (Focus on next nine months i.e. three seasons)
In this Update, we compare the JAMSTEC temperature and precipitation forecast maps, which are for the World, with the NOAA temperature and precipitation forecast maps that cover only CONUS and Alaska. We do this primarily for educational purposes.
JAMSTEC works in three-month intervals which correspond to seasons and does not change the selection of months each time they update but does so every three months. At that time they drop one season and add another season further in the future. So for JAMSTEC we now have Fall (SON), Winter (DJF) and Spring (MAM) to work with and we have the corresponding maps from NOAA. JAMSTEC only provides three sets of maps and they only change every three months.
I show the NOAA Maps first followed by the JAMSTEC maps. I extract North America from the Worldwide JAMSTEC map and use that to compare with the NOAA Maps. I also extract Europe including parts of North Africa and Western Asia from the Worldwide JAMSTEC maps and include those excerpted maps in the summary table at the beginning of this article.
Fall SON
Temperature
NOAA
And here is the SON 2018 temperature forecast for North America that I extracted from the JAMSTEC World Forecast.
And now the JAMSTEC WORLD FORECAST (for this graphic my comments are mostly related to areas other than Alaska and CONUS as those comments appear with the larger graphics above)

Precipitation
NOAA
And here is the SON 2018 Precipitation Forecast for North America that I extracted from the JAMSTEC World Forecast.
JAMSTEC WORLD FORECAST

Winter (DJF 2018 – 2019)
Temperature
NOAA
And here is the DJF 2018 – 2019 Temperature Forecast for North America that I extracted from the JAMSTEC World Forecast.
JAMSTEC WORLD FORECAST

NOAA
And here is the DJF 2018 – 2019 Precipitation Forecast for North America that I extracted from the JAMSTEC World Forecast.
JAMSTEC WORLD FORECAST

Spring (MAM 2019)
Temperature
NOAA
And here is the MAM 2019 Temperature Forecast for North America that I extracted from the JAMSTEC World Forecast.
JAMSTEC WORLD FORECAST

NOAA
And here is the MAM 2019 Precipitation Forecast for North America that I extracted from the JAMSTEC World Forecast
JAMSTEC WORLD FORECAST

C. An analysis of the forecasts for ENSO by NOAA and JAMSTEC and others including the Australian Bureau of Meteorology.
This provides a bit more background to that which was provided by NOAA in their official release on August 16. This section is organized into four parts.
1. Current and Recent Sea Surface Temperatures (SST)
2. Current and Recent Equatorial Pacific Subsurface Temperatures
3. History of the Nino 3.4 Readings and forecasts from other Meteorological Agencies.
4. The Surface Air Pressure Pattern that confirms the state of ENSO.
1. Current and Recent Sea Surface Temperatures (SST)
A major driver of weather is Surface Ocean Temperatures. Evaporation only occurs from the Surface of Water. So we are very interested in the temperatures of water especially when these temperatures deviate from seasonal norms thus creating an anomaly. The geographical distribution of the anomalies is very important. To a substantial extent, the temperature anomalies along the Equator have disproportionate impact on weather so we study them intensely and that is what the ENSO (El Nino – Southern Oscillation) cycle is all about. Subsurface water can be thought of as the future surface temperatures. They may have only indirect impacts on current weather but they have major impacts on future weather by changing the temperature of the water surface. Winds and Convection (evaporation forming clouds) is weather and is a result of the Phases of ENSO and also a feedback loop that perpetuates the current Phase of ENSO or changes it. That is why we monitor winds and convection along or near the Equator especially the Equator in the Eastern Pacific.
TAO/TRITON GRAPHIC (a good way of viewing data related to the part of the Equator and the waters close to the Equator in the Eastern Pacific where we monitor to determining the current phase of ENSO. It is probably not necessary in order to follow the discussion below, but here is a link to TAO/TRITON terminology.
And here is the TAO/TRITON Graphic as of August 17, 2018. The top part shows the actual temperatures, the bottom part shows the anomalies i.e. the deviation from normal.

Location Bar for Nino 3.4 Area Above and Below
| ———————————————— | A | B | C | D | E | —————– |
This is a graphical way of showing the surface temperature at the Equator week by week.

A major advantage of the Hovmoeller method of displaying information is that it shows the history so I do not need to show a sequence of snapshots of the conditions at different points in time. This Hovmoeller provides a good way to visually see the evolution of this ENSO event. I have decided to use the prettied-up version that comes out on Mondays rather that the version that auto-updates daily because the SST Departures on the Equator do not change rapidly and the prettied-up version is so much easier to read. The bottom of the Hovmoeller shows the current readings. Remember the +5, -5 degree strip around the Equator that is being reported in this graphic. So it is the surface but not just the Equator.
This next graphic is more focused on the Equator and looks down to 300 meters rather than just being the surface.

These two graphics look at SST’s all around the world. It compares today’s values to the three month average. Earlier in this report we present both the NOAA and JAMSTEC forecasts for how this graphic will look going forward.
| Three Month Average Anomaly | Current Anomaly |
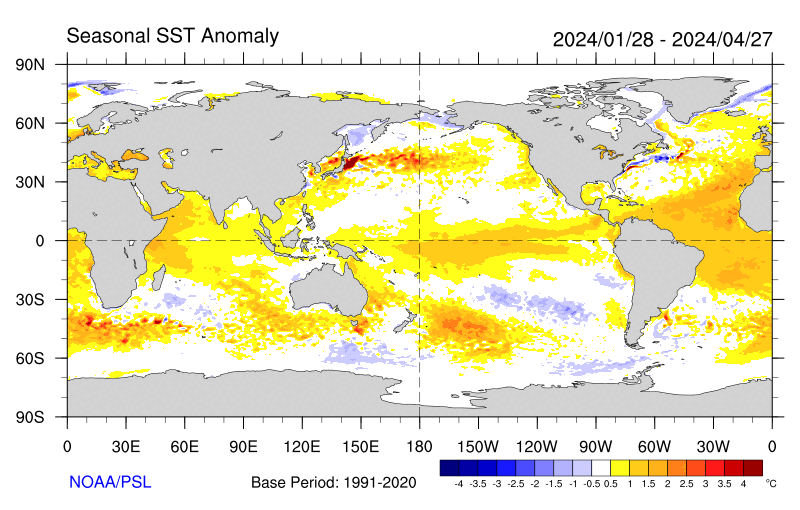 |  |
| By this point La Nina is gone | Traces of El Nino but the Indo-Pacific Warm Pool is cool. Where is the warm water for this El Nino coming from? |
2. Current and Recent Equatorial Pacific Subsurface Temperatures
Now for a more detailed look. Below is the pair of graphics that I regularly provide. The date shown is the midpoint of a five-day period with that date as the center of the five-day period. The bottom graphic shows the absolute values, the upper graphic shows anomalies compared to what one might expect at this time of the year in the various areas both 130E to 90W Longitude and from the surface down to 450 meters. At different times I have discussed the difference between the actual values and the deviation of the actual values from what is defined as current climatology (which adjusts every ten years except along the Equator where it is adjusted every five years) and how both measures are useful for other purposes.
We now have warm water with a maximum anomaly of +3C from 150W to 120W with additional warm water extending west to Indonesia. |
 |
| The 28C Isotherm is now at 170W, the 27C Isotherm is at 150W, the 25C Isotherm is now at 120W. The 20C Isotherm is now closer to reaching the surface near the coast. And the 23C Isotherm has reached the surface just east of 120W as the current Kelvin Wave has pretty much played out near the coast of Ecuador. |
Tracking the change.
 |  |

The discussion in this slide says it better than I could. One might compare the current reading to Oct/Nov 2017. The anomaly had returned to zero then reversed for a month and then returned to zero and now has gone positive. It now seems to be declining a bit.
Side by side comparison can be useful
| Comparison Week Probably Third Week of December 2017 | Current Week |
|  |

This graphic provides both a summary perspective and a history (small images on the right).
.
3. History of the Nino 3.4 Readings and forecasts from other Meteorological Agencies.
Although Nino 3.4 is most used there are three other indices and where the are calculated is shown in the graphic below with last weeks values. The same data in graphic form but going back a couple of more years can be found here. The full table of values can be found here.

This graphic brings the Nino 3.4 up to date and is easy to read.

A plume of predictions by a variety of models.

Here is the Nino 3.4 report from the Australian BOM (it updates every two weeks)
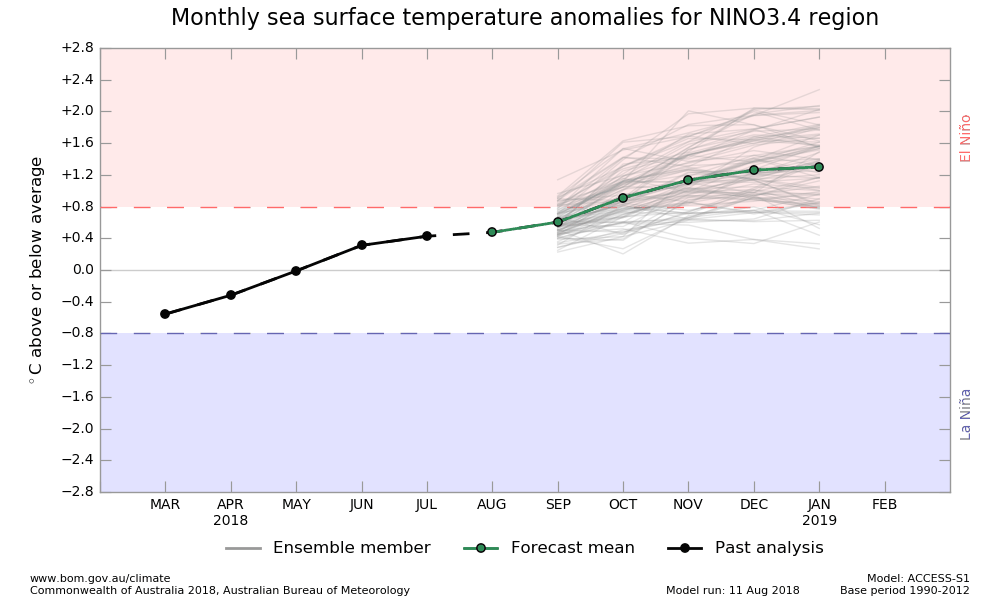
And the ENSO Outlook Discussion Issued on August 14, 2018
Little change in the tropical Pacific; El Niño remains possible in 2018
The El Niño–Southern Oscillation (ENSO) is currently neutral. While the tropical Pacific Ocean has cooled in the past month, most international climate models forecast warming to resume in the coming weeks, with El Niño development possible in the southern spring. Therefore, the Bureau’s ENSO Outlook remains at El Niño WATCH. El Niño WATCH means there is approximately a 50% chance of El Niño forming in 2018; double the normal chance.
While the surface of the central to eastern tropical Pacific has cooled over the past month, the water below the surface of the western Pacific is warming again. Although atmospheric indicators such as the Southern Oscillation Index (SOI) remain neutral, tropical cyclones to the north of the equator are acting to increase the warmth in the Pacific by suppressing trade winds.
Most international climate models surveyed by the Bureau predict warming of the tropical Pacific is likely to recommence in the coming weeks. Most models suggest El Niño thresholds are likely to be reached by the end of the year, with the majority suggesting these thresholds could be met by mid to late spring.
El Niño during spring typically means below average rainfall in eastern and northern Australia while daytime temperatures are typically above average over southern Australia.
Indian Ocean IOD (It updates every two weeks)
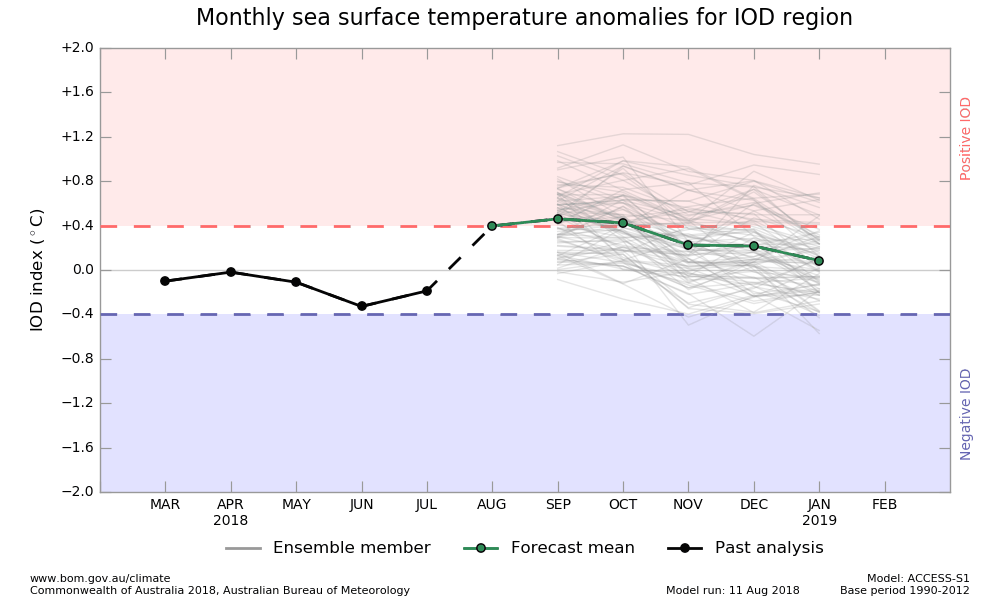
Indian Ocean Dipole Outlook Discussion Issued August 14, 2018
The Indian Ocean Dipole (IOD) is currently neutral. The weekly index value to 12 August was +0.16 °C. However, the ocean to the northwest of Australia remains cooler than normal, which is contributing to suppressed rainfall over southern and southeast Australia. Three of six international climate models suggest a short-lived positive IOD event may develop. A positive IOD during spring typically reduces rainfall in central and southern Australia, and can exacerbate any El Niño driven rainfall deficiencies.
It is useful to understand where and how the IOD is measured.

IOD Positive is the West Area being warmer than the East Area (with of course many adjustments/normalizations). IOD Negative is the East Area being warmer than the West Area. Notice that the Latitudinal extent of the western box is greater than that of the eastern box. This type of index is based on observing how these patterns impact weather and represent the best efforts of meteorological agencies to figure these things out. Global Warming may change the formulas probably slightly over time but it is costly and difficult to redo this sort of work because of long weather cycles.
4. The Surface Air Pressure Pattern that confirms the state of ENSO.
This index provides an easy way to assess the location of and the relative strength of the Convection (Low Pressure) and the Subsidence (High Pressure) near the Equator. Experience shows that the extent to which the Atmospheric Air Pressure at Tahiti exceeds the Atmospheric Pressure at Darwin Australia when normalized is substantially correlated with the Precipitation Pattern of the entire World. At this point there seems to be no need to show the daily preliminary values of the SOI but we can work with the 30 day and 90 day values.
Current SOI Readings

SOI = 10 X [ Pdiff – Pdiffav ]/ SD(Pdiff) where Pdiff = (average Tahiti MSLP for the month) – (average Darwin MSLP for the month), Pdiffav = long term average of Pdiff for the month in question, and SD(Pdiff) = long term standard deviation of Pdiff for the month in question. So really it is comparing the extent to which Tahiti is more cloudy than Darwin, Australia. During El Nino we expect Darwin Australia to have lower air pressure and more convection than Tahiti (Negative SOI especially lower than -7 correlates with El Nino Conditions). During La Nina we expect the Warm Pool to be further east resulting in Positive SOI values greater than +7).
To some extent it is the change in the SOI that is of most importance. The MJO or Madden Julian Oscillation is an important factor in regulating the SOI and Ocean Equatorial Kelvin Waves and other tropical weather characteristics. More information on the MJO can be found here. Here is another good resource.


