Written by Sig Silber
Updated at 7:20 pm EDT, June 29, 2018 to incorporate the undated Week 3 – 4 Forecast
Another week and another week of the drought not improving materially and, in the case of this week, actually getting worse especially for Texas. It is a different part of Texas but they are very concerned about the cotton crop. The tropical event called Bud helped in some places but not widely. Maybe this week will be better. We seem to be saying that each week and many are discouraged. It better be a good Monsoon. So far this is a record but a one-year (actually a one-season) drought. We expect the situation to improve soon but it may be that certain areas will have to wait longer than they may think. New England has now become a concern: See the Drought Monitor Discussion in our Report.

Please share this article – Go to very top of page, right hand side for social media buttons.
Here is our Full Weekly Report.
This report is organized into three parts plus additional reference Information at the end of the report:
- The U.S. Drought Monitor (full report can be accessed here)
- Selected parts of our Weekly Weather and Climate Report (Monday’s full report can be accessed here) which has forecasts for the next 25 days and which auto-updates
- Selections from the Tuesday USDA Weather and Crop Bulletin (full report can be accessed here) supplemented by related information.
1. U.S. Drought Monitor
The U.S. Drought Monitor is a comprehensive way of understanding the drought situation for the U.S. It is issued every Thursday and reflects the conditions as of the prior Tuesday. Drought is defined as a moisture deficit bad enough to have social, environmental or economic effects. Thus, more factors than recent precipitation are considered and more information on how it is done is found at the end of this report.

Notice that New England has been assigned an “S”. Below is the same map with statistics and below that map I have provided a cut-out of the statistics which I think you can click on to enlarge.


| Last Week | This Week |
 | |
The graphic below shows the one-week change in drought intensity. Yellow is bad. Green is good.

Now we show the same information by region. The yellow is where the drought has been upgraded.
 |
| Pretty mixed but western Kansas saw a lot of improvement. |
 |
| More yellow than green i.e. the drought got worse. |
 |
| Dry here…not from a bad situation but still a deterioration. It was significant enough to be shown with an “S” on the overall map. It caught me by surprise so I did not have enough time to look into it very much but I have but the relevant comments from the Drought Monitor in bold type for those who are interested in this. |
 |
| Bud improved the Gulf Coast of Texas and some mesoscale convective storms improved North Texas and Western Oklahoma but there is a lot of yellow on this map. |
 |
| Very little change. |
 |
You can see the impact of Cyclone Bud on the southern Rio Grande Valley but not much else improvement in New Mexico. Utah and Colorado degraded and the West Coast degraded. |
This pair of maps might make it easier to get a general idea of what is happening in the worst part of the drought area.
| Last Week | This Week |
 |  |
Animation of twelve weeks of change

Some may prefer this way of looking at things and I hope these graphics are not too small to read. I did not make them so you could click on them individually but you can click on the whole graphic and it may enlarge. But I think you get the picture. It has been a rapid onset and hopefully it’s demise will also be fairly rapid.

Here is the discussion which was issued with the Drought Monitor today.
A couple strong upper-level low pressure systems, moving in the jet stream flow, slowly crossed the northern half of the contiguous U.S. (CONUS) during this U.S. Drought Monitor (USDM) week. The lows dragged surface lows and frontal systems with them. Supplied with abundant Gulf of Mexico moisture, these systems generated numerous mesoscale thunderstorm complexes which dumped heavy rain across parts of the Plains to Midwest and Mid-Atlantic coast. The clouds and rain associated with the lows and fronts also brought cooler-than-normal temperatures to the central Plains to Northeast. A moist low pressure system at the beginning of the week dumped heavy rains along the Texas Gulf coast. Contraction of drought and abnormally dry areas occurred in the Plains and Texas Gulf coast where precipitation was above normal for the week. However, these lows tracked within a larger-scale upper-level ridge system. Drier-than-normal weather dominated much of the West, large parts of Texas and the Southeast States, and from the western Great Lakes to most of the Northeast, with drought and abnormal dryness expanding in parts of the West, South, and Northeast. The week was warmer than normal across much of the West, along the northern tier states, much of Texas, and most of the Southeast.
Northeast
Precipitation amounts ranged from a few tenths of an inch to over an inch in places, but mostly the region was drier than normal. With low streamflow, precipitation deficits building over the last 3 months, and drying soils, D0 was expanded in parts of the region and D1 was introduced from northern Massachusetts to southern Maine. According to June 25 U.S. Department of Agriculture (USDA) statistics, pasture and range condition was poor to very poor across 15% of Massachusetts, 14% of New Hampshire, and 6% of New York. Topsoil moisture was short or very short (dry or very dry) across 40% of Maine, 56% of Massachusetts, 70% of New Hampshire, 52% of New York, and 61% of Vermont. Subsoil moisture conditions were similarly dire. Subsoil moisture was short or very short in 73% of Maine, 21% of Massachusetts, 66% of New Hampshire, 41% of New York, and 36% of Vermont. In New York, according to Farm Service Agency reports, corn was beginning to curl in parts of Oneida and Yates Counties and underseedings were starting to wither in Yates County. Hydrologic conditions in Massachusetts were dry, with below or well below normal groundwater in central and western Massachusetts and low streamflow. Drought impacts reported by the National Drought Mitigation Center (NDMC) include a water ban in Northampton, MA, and water conservation requests by the NH Department of Environmental Services.
Southeast
Two or more inches of rain were observed across much of Virginia, northern Alabama, and parts of the Carolinas and Florida. These areas were wetter than normal for the week. Southern Alabama, the Florida panhandle, and southwest Georgia were substantially drier than normal, while the rest of the Southeast was near to drier than normal. The rains shrank the abnormally dry area in northeast Alabama, but D0 crept into the west central part of the state.
South
Much of coastal Texas was inundated by heavy tropical moisture. Reports of 2 to 5 inches of rain were common, with 5 to 10 inches falling in the southern areas. An automated station near Weslaco Airport recorded 8.39 inches of rain in just 2 and a half hours. According to the Texas mesonet, Weslaco received 9 inches of rain. The average total precipitation is 6.73 inches there for the entire summer (June through August). The rains eliminated dryness on the Standardized Precipitation Index (SPI) drought indictor out to 6 months back in South Texas. The rains led to widespread 1 to 2 category reductions along the coast, with D1-D2 shrinking down to D0 (Abnormally Dry) or to no drought or abnormal dryness (“D-Nothing”).
Meanwhile, several mesoscale thunderstorm complexes over multiple days moved through Oklahoma and clipped the northern Texas panhandle, with their remnants making it into parts of Arkansas, while other thunderstorm systems brought rain to parts of northern Mississippi and southern Tennessee. These areas received 2 inches or more of rain for the week, with parts of Oklahoma recording over 5 inches. The D4 in western Oklahoma and the Texas panhandle was eliminated, improvement occurred in the northern Texas panhandle, and D0-D3 shrank across much of Oklahoma, with some 2-category reductions. Elsewhere in Texas, the week was dry with multi-month precipitation deficits mounting, so D0-D3 expanded across the central half of the state. June 25 USDA statistics indicated that 41% of pastures and rangeland were in poor to very poor condition in Texas. The rains mostly missed northeast Oklahoma, where D1 expanded. D0-D2 expanded in parts of Louisiana, D0-D1 expanded in Mississippi, and there was expansion of drought and abnormal dryness and some contraction, as well, in Arkansas. D0 was added to northern Tennessee, with a little spillage into parts of southern Kentucky, where precipitation deficits have been mounting over the last 3 months.
Midwest
Thunderstorms moving along frontal bands which stretched across the Ohio Valley dumped 2 inches or more of rain in many areas. Most of the rain fell over areas that were not in a drought or abnormally dry status, but some did. D0 was pulled back in central Indiana, southeast Iowa, and northwest Illinois, with D0-D1 contracting in southwest Iowa. Most of Missouri missed the 2-inch rains, with much of the state continuing drier than normal. D0-D2 expanded in the state to better reflect deficits for the last 1 to 3 months and, in places, out to 9 months. Hamilton, in northern Missouri, continued to have hydrologic moisture shortages. According to media reports, the Hamilton Reservoir’s current water level sits so low that the city has imposed tough water restrictions. Slivers of D0 from Tennessee extended into southern Kentucky. The western Great Lakes were drier than normal this week. D0 was added in and around the thumb of Michigan where dryness was indicated on the 1- to 2-month SPI.
High Plains
Several rounds of heavy thunderstorms moved along frontal boundaries on multiple days in the High Plains states. Two inches or more of rain was measured across the western two-thirds of Kansas, the eastern half of Nebraska, and in parts of South Dakota, Montana, and Wyoming, with 5 inches or more indicated for southwestern Kansas, eastern Nebraska, and southeast South Dakota. The week was drier than normal for other parts of the High Plains, with western Colorado to southwestern Wyoming receiving little to no precipitation. The rains resulted in pullback of D0-D2 in Kansas, with some 2-category improvements in southwest Kansas, contraction of D0-D1 in Nebraska, and trimming of D0 in South Dakota. With the heavy rains missing eastern Kansas, the week ended drier than normal there, further increasing precipitation deficits for the last 1 to 3 months and, in northeast Kansas, out to 9 months, so D0-D2 were expanded in eastern Kansas. Some of the heavier rains crossed from Kansas into Colorado, but just barely. D2-D3 were pulled back a bit in far eastern Colorado, but the dry conditions further west resulted in D2-D3 expanding in central and west-central Colorado, and D4 expanding in west-central Colorado. June 25 USDA statistics indicated 53% of the pastures and rangeland in Colorado were in poor to very poor condition.
West
Dry weather and mostly warmer-than-normal temperatures dominated the West this week. June 25 USDA statistics indicated that pastures and rangeland were in poor to very poor condition for 90% of the pastures and rangeland in Arizona, 68% in New Mexico, 36% in Utah, 25% in Nevada, and 22% in Oregon. D0 and D1 expanded in parts of Oregon and Washington where streamflow was at near to record low levels for this time of year and SPI values were low for the last 1 to 3 months. The D2 was continued in eastern Oregon. In this region, drought impacts from Baker County include very dry soil conditions, blowing dust, no water for livestock, dry springs and storage ponds, below-normal range grass growth; drought impacts from Harney County include significantly low water supplies from early melt-out of winter snow pack are reducing water available for irrigators and ranchers; and drought impacts from Lake County include reduced water supplies for irrigators and ranchers due to low streamflow and low reservoir storage at some basin reservoirs. In Utah, D2 was expanded in the northeast and new ovals of D3 and D4 were added. But in southwest New Mexico, D1-D3 were pulled back where the rains from Tropical Storm Bud last week were reflected in SPoRT soil moisture and SPI indicators.
Several indicators, including SPI and other precipitation indices, evapotranspiration indices, soil moisture indices, and vegetation indices, showed worsening meteorological conditions in California. June 25 USDA statistics have 75% of topsoil moisture and 75% of subsoil moisture in California short or very short (dry to very dry), with 40% of pastures and rangeland in poor to very poor condition. D0 was expanded in northern and central California, and D1 crept in from the north to capture the extremely low 6- to 12-month SPI values. The water resources of California are carefully managed to mitigate the impacts of drought. With reservoirs in good shape, the D0-D1 in northern California reflects the climatological indicators. D0 was expanded to the California coast to reflect abnormally dry meteorological conditions over the last several months, and a low snowpack during the latter months of the wet season. Since drought impacts along the coast are not happening, the D0 reflects just meteorological conditions and further degradation (to a level of drought, D1) is extremely unlikely there this summer because even zero precipitation over the next few months would not be enough to drop water year precipitation into D1 levels.
Alaska, Hawaii, and Puerto Rico
The weather has been dry across much of Hawaii during the last 2 to 4 weeks. Dry conditions have been noted by the Lanai water company and FSA on Maui, although no agricultural impacts have been reported yet. D0 was expanded across Lanai and Kahoolawe and across the western 2/3 of Maui as a result. The week was drier than normal across most of the panhandle and southeast Alaska stations, and wetter than normal further north and west. Most of Puerto Rico was near to wetter than normal. No changes were made to the USDM depiction for Alaska and Puerto Rico.
Looking Ahead
Since the Tuesday morning cutoff time of this week’s USDM, additional heavy rains have fallen across parts of Missouri, Tennessee, and Kentucky, with rain falling over the East Coast states. For June 28-July 4, dry weather will continue across most of the West and southern Plains. An inch or more of rain is expected for much of the Southeast and New England, and parts of the northern Plains to Upper Midwest. The forecast models predict less than an inch of rain across other parts of the CONUS east of the Rockies. Temperatures are expected to be mostly warmer than normal, except some cooling in the northwestern CONUS. For July 5-11, odds favor above-normal temperatures across most of Alaska and the CONUS, with a chance for below-normal temperatures in the Northwest. There is a higher probability for drier-than-normal weather across the Northwest, central Plains to Great Lakes, and southern Alaska, and wetter-than-normal weather for the Southwest, southern Plains to Mid-Atlantic region, and northern Alaska, as well as the Upper Mississippi Valley.
Here is what happened with precipitation during the most recent week.

Here is a more up to date graphic. It shows percent of normal rather than absolute precipitation and is a bit harder to relate to geography but it is very current.


Rain last October which is the start of the water year in some cases has skewed the statistics.

One result has been

And here is the forecast issued on June 21.2018. It will be updated soon probably on Saturday.
And here is the discussion released with the graphic.
Latest Seasonal Assessment – During the past month, a persistent subtropical moisture plume that extended from the Caribbean Sea northward across the East Coast states resulted in the removal of all drought in this area. Conditions in New England and New York (which missed out on most of the subtropical rain) have steadily declined in the past month, warranting drought development in this region. In the Midwest, a meandering frontal boundary is forecast to bring 3-7 inches of rain to portions of the region, favoring improvement and/or removal of drought. Unfortunately, during this time of year, crops demand a lot of water to grow properly and eventually produce good yields. If the rainfall received does not outpace the high water demand, this area would be prone to redevelopment of dryness and drought later in the July-September (JAS) 2018 outlook period. Precipitation associated with this frontal zone is expected to reach Kansas and northern Oklahoma, promoting drought improvement and/or removal. The Dakotas are expected to be far enough to the north to miss out on the heavy rains associated with the meandering front early in the drought outlook period, and drought is expected to persist in that region. A weak tropical system now along the Texas Coast is bringing heavy rainfall to the area, warranting drought removal. In the Southwest, the climatological onset of the Summer Monsoon is approaching, and favors widespread improvement of drought conditions, especially in the Four Corners region and southern Rockies. The latest guidance suggests this will be a fairly robust monsoon, which will help elevate the confidence level for improvement. In the interior Northwest, with the dry season now in full swing, drought persistence is favored. In Hawaii, persistent trade winds are predicted to bring adequate rainfall to the northeast-facing, windward volcanic slopes. Leeward slopes, however, lie in more protected rain shadow areas, and are therefore expected to see drought develop over the next several months. With most precipitation outlooks out to one season in advance favoring above normal precipitation, any dryness in Alaska is expected to be short-lived. In Puerto Rico, despite this being the rainy season for the Commonwealth, dynamical guidance from the National Multi-Model Ensemble (NMME) predicts a strong signal for dryness. The abnormal dryness region (D0 on the U.S. Drought Monitor) is primed for additional deterioration, along with drought development.
2. Current Forecast for Precipitation. Here I provide the weather forecasts for different periods of time in July which should allow the reader to assess the likelihood of this forecast working out as shown over the next three to four. (Since we published this week on Thursday, we updated the discussion for the Week 3 – 4 forecast when was issued on Friday June 29). This is important as the current Day 6 – 14 forecasts and the week old week 3 – 4 forecast overlap to some extent.
| The five day QPF is shown to the right. The units are different than the other maps i.e. in units of precipitation (inches) not probabilities of exceeding or being less than climatology. |  | It is difficult to compare this with the other maps as some places are naturally more wet than others. But it is generally consistent with the 6 – 10 day forecast as one can see how the 6 -10 day might follow the 1 – 5 day. Notice that Texas is mostly dry. | |
 | Transitioning from the 6 to 10 day outlook on the left to the 8 to 14 day outlook on the right. → |  | |
| It looks dry in part of the area where the drought is the worst. | |||
To the right is the week 3 and 4 Experimental Forecast which was updated on June 29. → |  | ↑ ← In generally it would seem that the Week 3 -4 Forecast is feasible. The Week 3 – 4 forecast was updated on June 29. It supports the early Monsoon hypothesis but it does not look good in Weeks 3-4 for Texas and east and north of Texas. So we remain concerned for that area re drought through July 27, 2018 i.e. essentially a month. It looks like some relief early and then back to hot and dry.
| |
Here is another useful graphic from my weekly report.

And one more.

3. Selections from the Tuesday USDA Weather and Crop Bulletin (full report can be accessed here) supplemented by related information. (many of the weather related graphics have already been presented)
First we start with the weather information.
The reader may be able to update some of the graphics that I have shown in previous issues of our Drought and Agriculture Report at this link (to the NRCS week weather than climate reports) where you can access both the current and archived information. One can generate an infinite number of graphics. I did not want to clutter this report with graphics that were not selected by NOAA to be in the Drought Report issued Thursday or the Weather and Crop Bulletin issued on Tuesday. But I have provided readers with the link above that will allow you to view as much data as you want. I have in this report included many of the graphics at that link and some others from other sources that I though were particularly useful.
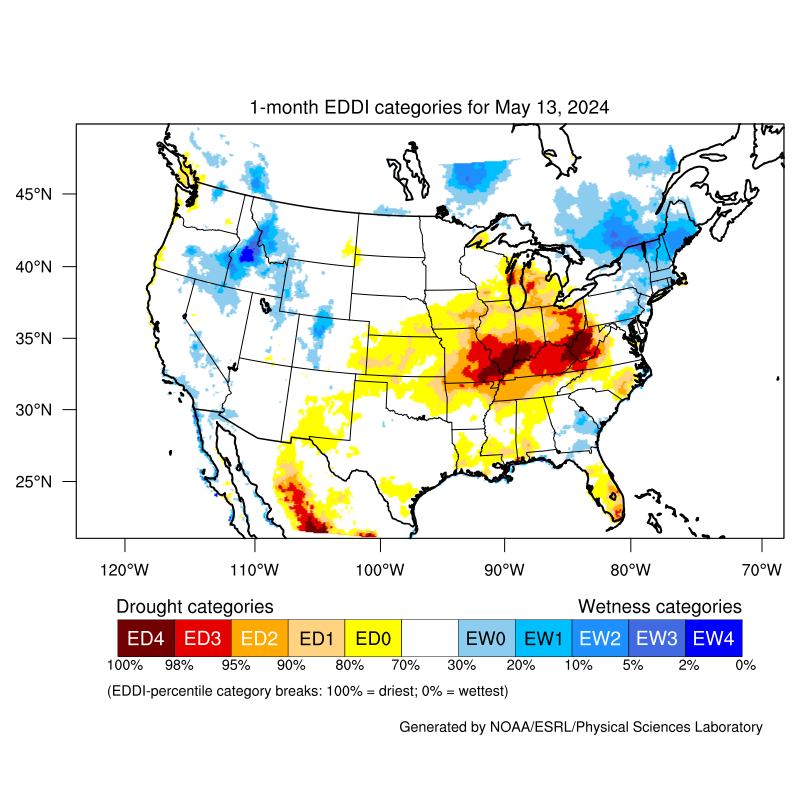
And here is a graphic that pulls a lot of information together. Image provided by the NOAA/ESRL Physical Sciences Division, Boulder, Colorado see website. It shows the demands of the atmosphere for moisture from the ground and is based on temperature, wind, relative humidity and solar radiation. It tells you nothing about how much precipitation you will get but how much you need to retain the same level of soil moisture.

Some weekly views of the situation:


Soil Moisture is a very important part of understanding drought.
| Surface | Subsurface |
 |  |
| The numbers in parentheses show the changes by state. The number of states with surface deficiencies has decreased by 8 and the number of states with subsurface deficiencies has also decreased by 4. | |
 |  |
| There has been an increase in the number of states with a surplus. It is not always easy to know how to relate to a moisture surplus. Is it a positive moisture reserve or is it too wet to work the ground? | |
State Ranking precipitation. This week I am again showing both the completed month (May) and the three- month period (March/April/May)
| March to May | May |
 |
|

And Temperature.
| March to May | May |
 |
|

Now we focus on crop information
The Summary for the U.S.

Below are more details and there is more information this week as the planting season advances.
This summarizes the situation which is not very much different than the report last week. In some cases there is slight improvement and this is best seen in the detailed tables below. It is getting to be difficult preparing this table separate from the information above and below. The reason for that is that in general there are at this point in time three parameters reported:
1. percent planted
2. percent that has developed to a key point
3. crop condition
Plus there are two reference points: last year and the five year average. So it is harder to assess the six measurements and arrive at a single conclusion for a crop but I have taken my best shot at it. For those with a more serious interest I suggest you review the tables below and the text summary above which is what I have done to populated this table which has not changed since last week.
| Worse than last year and or 5-Yr average | Better than last year or 5-Yr average | In line with recent conditions for this time of year or 5 – Yr Average |
| Winter Wheat, Peanuts, Rice, Sorghum, Cotton, Pasture and Range Conditions | Corn, Barley, Oats, Soybeans, Spring Wheat, Sunflowers, |
The information in the table below is summarized in the above discussion but in the table below, it is broken down by State.


Sometimes a map can be helpful to make text come alive.

I am now routinely including the precipitation report for Mexico since storms do not respect borders.

Additional Reference Information
A more complete description of


Sequence of drought occurrence and impacts for commonly accepted drought types. All droughts originate from a deficiency of precipitation or meteorological drought but other types of drought and impacts cascade from this deficiency. (Source: NDMC)
Source: National Drought Mitigation Center, University of Nebraska-Lincoln, U


