Written by Sig Silber
Updated at 3:40 pm EDT June 22, 2018 to reflect the updated Week 3 – 4 Forecast issued today which confirms our concern about the areas mentioned last night.
There was some reduction in drought this week. It was fairly significant. But I am less sanguine about the next few weeks for the area that has the most intense drought and I am also less sanguine than the forecast map which was issued today about the situation for Southeast Texas, Southeast Oklahoma, Louisiana, and Arkansas.

Please share this article – Go to very top of page, right hand side for social media buttons.
Here is our Full Weekly Report.
This report is organized into three parts plus additional reference Information at the end of the report:
- The U.S. Drought Monitor (full report can be accessed here)
- Selected parts of our Weekly Weather and Climate Report (Monday’s full report can be accessed here) which has forecasts for the next 25 days and which auto-updates
- Selections from the Tuesday USDA Weather and Crop Bulletin (full report can be accessed here) supplemented by related information.
1. U.S. Drought Monitor
The U.S. Drought Monitor is a comprehensive way of understanding the drought situation for the U.S. It is issued every Thursday and reflects the conditions as of the prior Tuesday. Drought is defined as a moisture deficit bad enough to have social, environmental or economic effects. Thus, more factors than recent precipitation are considered and more information on how it is done is found at the end of this report.

Below is the same map with statistics and below that map I have provided a cut-out of the statistics which I think you can click on to enlarge.


| Last Week | This Week |
 | |
The graphic below shows the one-week change in drought intensity. Yellow is bad. Green is good.

Now we show the same information by region. The yellow is where the drought has been upgraded.
 |
| A lot of improvement here |
 |
| Mixed but more green than yellow |
 |
| Dry here…not from a bad situation but still a deterioration. |
 |
| Overall improvement but the North Central Area is worse. |
 |
| Very little change. |
 |
Surprisingly little change |
This pair of maps might make it easier to get a general idea of what is happening in the worst part of the drought area.
| Last Week | This Week |
 |  |
Animation of twelve weeks of change

Here is the discussion which was issued with the Drought Monitor today.
This Week’s Drought Summary
An active weather pattern brought rain to areas of the northern Rocky Mountains, northern Plains, Upper Midwest and Southwest and along the Gulf Coast from Texas to Florida. The rain in the Southwest was from the remnants of tropical storm Bud, which came up the Gulf of California and brought much-needed moisture into the region. Tropical moisture also flowed inland off the Gulf of Mexico, bringing heavy coastal rains at the end of the current U.S. Drought Monitor period. A series of events brought heavy rains from Montana to Wisconsin along the northern tier of the country, with up to 6-8 inches of rain over much of Wisconsin for the week. Temperatures for the week were at or above normal for most of the country, with only the northern Rocky Mountains, portions of the Southwest, and the Eastern Seaboard being below normal. Areas of the Plains had triple-digit heat, with areas of Nebraska and Kansas having departures of 6-10 degrees above normal for the week.
Northeast
A cool and mostly dry week for the region, with some rain coming at the end of the current period. Temperatures were 1-2 degrees below normal from Virginia to southern New England. Almost the entire region was drier than normal for the week, with the driest areas along the Atlantic coast. Abnormally dry conditions were expanded over much of New England this week as long-term hydrological issues along with short-term dryness have impacted the region.
Southeast
The region continues to receive spotty, mainly convective, thunderstorm activity as the source of the precipitation in the region. Areas that are missing out on these events are drying out as the heat of the summer is well established in the region, with most areas 2-4 degrees above normal for the week. The panhandle of Florida and southern Alabama and Georgia had temperature departures of 1-2 degrees below normal for the week with the most active precipitation pattern. The only changes this week was a small expansion of D0 in northern Alabama.
Midwest
An unseasonably warm week across the region was also coupled with widespread rain, especially over the upper Midwest. Temperatures were 5-7 degrees above normal, with the warmest readings over Missouri. Most all areas were near normal precipitation for the week, with portions of northern Wisconsin and northern Minnesota having rain totals of 3+ inches above normal. Some local totals were: 5.17 inches in Rhinelander, WI; 4.42 inches in Wausau, WI; 4.02 inches in Green Bay, WI; 3.07 inches in Marshfield, WI; and 3.06 inches in Oshkosh, WI. The widespread heavy rains allowed for the removal of much of the abnormally dry designation over the upper peninsula of Michigan, all of Wisconsin and most of Minnesota. There was a small improvement to abnormally dry conditions in central and western Iowa as well. Missouri has continued to dry over the last several months, with agricultural-related impacts becoming more widespread. Changes this week in Missouri include expansion of severe drought over the northern portion of the state as well as the expansion of moderate drought and abnormally dry conditions in the northeast that included far western Illinois. Abnormally dry conditions were also expanded over much of western Missouri and a new pocket was introduced in southeast Missouri. Abnormally dry conditions were also expanded slightly in eastern Iowa along the Mississippi River.
High Plains
The northern portions of the region were cooler than normal with widespread rain over the western Dakotas while most of the rest of the region had temperatures that were 6-9 degrees above normal, and most areas from central and eastern Nebraska into eastern Kansas were drier than normal for the week. Precipitation amounts that were 1-2 inches above normal fell along the Nebraska and South Dakota border and in and around the Omaha metro area in eastern Nebraska. Improvements were made over most of northern and western North Dakota, where moderate and severe drought was improved and the extent of the abnormally dry areas was also reduced. A full category improvement was also made over western South Dakota as the short-term pattern has brought enough precipitation that only lingering long-term issues remain. The impact designation over the western Dakotas was also changed to long-term. In eastern South Dakota, the short-term dryness as well as the heat allowed for the expansion of both moderate drought and abnormally dry conditions to the south. Moderate drought was expanded in southeast Nebraska along the Kansas border. Moderate drought and abnormally dry conditions were improved in far eastern Nebraska this week as well.
Extreme drought was removed from southwest Kansas as the drought indicators and indices did not support extreme drought with the influx of the most recent rains. Impacts remain, especially in the agricultural sector. In eastern Kansas, abnormally dry and moderate drought conditions were expanded as the region continues to miss out on the rain events and the recent heat has rapidly worsened conditions.
South
Most of the region was near normal precipitation for the week, with portions of west Texas and areas along the Gulf Coast receiving above-normal precipitation. Some areas of south Texas and near the Louisiana border were 5-7 inches above normal for the week as tropical moisture flowed onshore, bringing good coastal rains. Widespread improvements were made over western Texas and into the panhandles of both Texas and Oklahoma, with a full category improvement where the best rains occurred. A full category improvement was also made along most coastal areas from southern Texas and into Louisiana. Degradation took place over much of eastern Texas and Oklahoma, Arkansas and northwest Louisiana. The short-term dryness and heat has allowed for drought to continue to develop quite rapidly. A large area of severe drought was introduced this week over southeast Oklahoma, northeast Texas and into southwest Arkansas. Moderate drought filled in most of east Texas and more of northwest Louisiana and southwest Arkansas.
West
Most of Montana has been quite wet over both the short- and long-term, but there are pockets of dryness remaining and developing in the northwest portion of the state. Widespread precipitation over much of eastern Idaho, Wyoming, and southern Montana has kept these areas drought free. Tropical moisture came up the Gulf of California and into the Southwest over the weekend, bringing cooler temperatures and widespread precipitation over both Arizona and New Mexico and into central Colorado. No changes were made in Arizona, but the rains allowed from some improvement to the severe and extreme drought over eastern New Mexico as well as some minor improvements in southeast Colorado. Abnormally dry conditions were introduced into northwest Montana, northern Idaho and extreme northeast Washington while moderate drought was introduced into north central Montana.
Alaska, Hawaii, and Puerto Rico
No changes were made in Hawaii this week as precipitation has been near normal over most all the islands. In Puerto Rico, dryness continues to develop and abnormally dry conditions were expanded to the north by about 1 county this week. Hydrological and ecological impacts due to lingering dryness over the panhandle of Alaska has also allowed for the expansion of abnormally dry conditions there this week.
Looking Ahead
Over the next 5-7 days, an active weather pattern continues to slowly move east out of the Plains and into the Midwest, bringing with it cooler temperatures and very heavy rain. The areas forecast to have the greatest precipitation are in the northwest portions of Iowa southeast into southern Indiana, the Gulf coast of Texas, and northeast Oklahoma, northwest Arkansas, and southwest Missouri. Much of the eastern two-thirds of the country is expecting precipitation while the West and Southwest will remain dry. Temperatures will remain below normal in the areas of the Plains and Midwest where the greatest precipitation occurs while the West and Southwest should expect daily high temperatures to be 8-10 degrees above normal.
The 6-10 day outlooks show that the chances for above-normal temperatures remain quite high over most of the United States, with the exception of Alaska, the northern Rocky Mountains and the Pacific Northwest. The wet pattern looks to continue as the central and northern Plains, Midwest, and South all are showing above-normal chances of recording above-normal precipitation, with the greatest chances over the Midwest. Higher than normal chances of below-normal precipitation look to be projected from the Pacific Northwest southeast into Texas during this time as well.
Here is what happened with precipitation during the most recent week.

And here is the forecast issued today June 21.
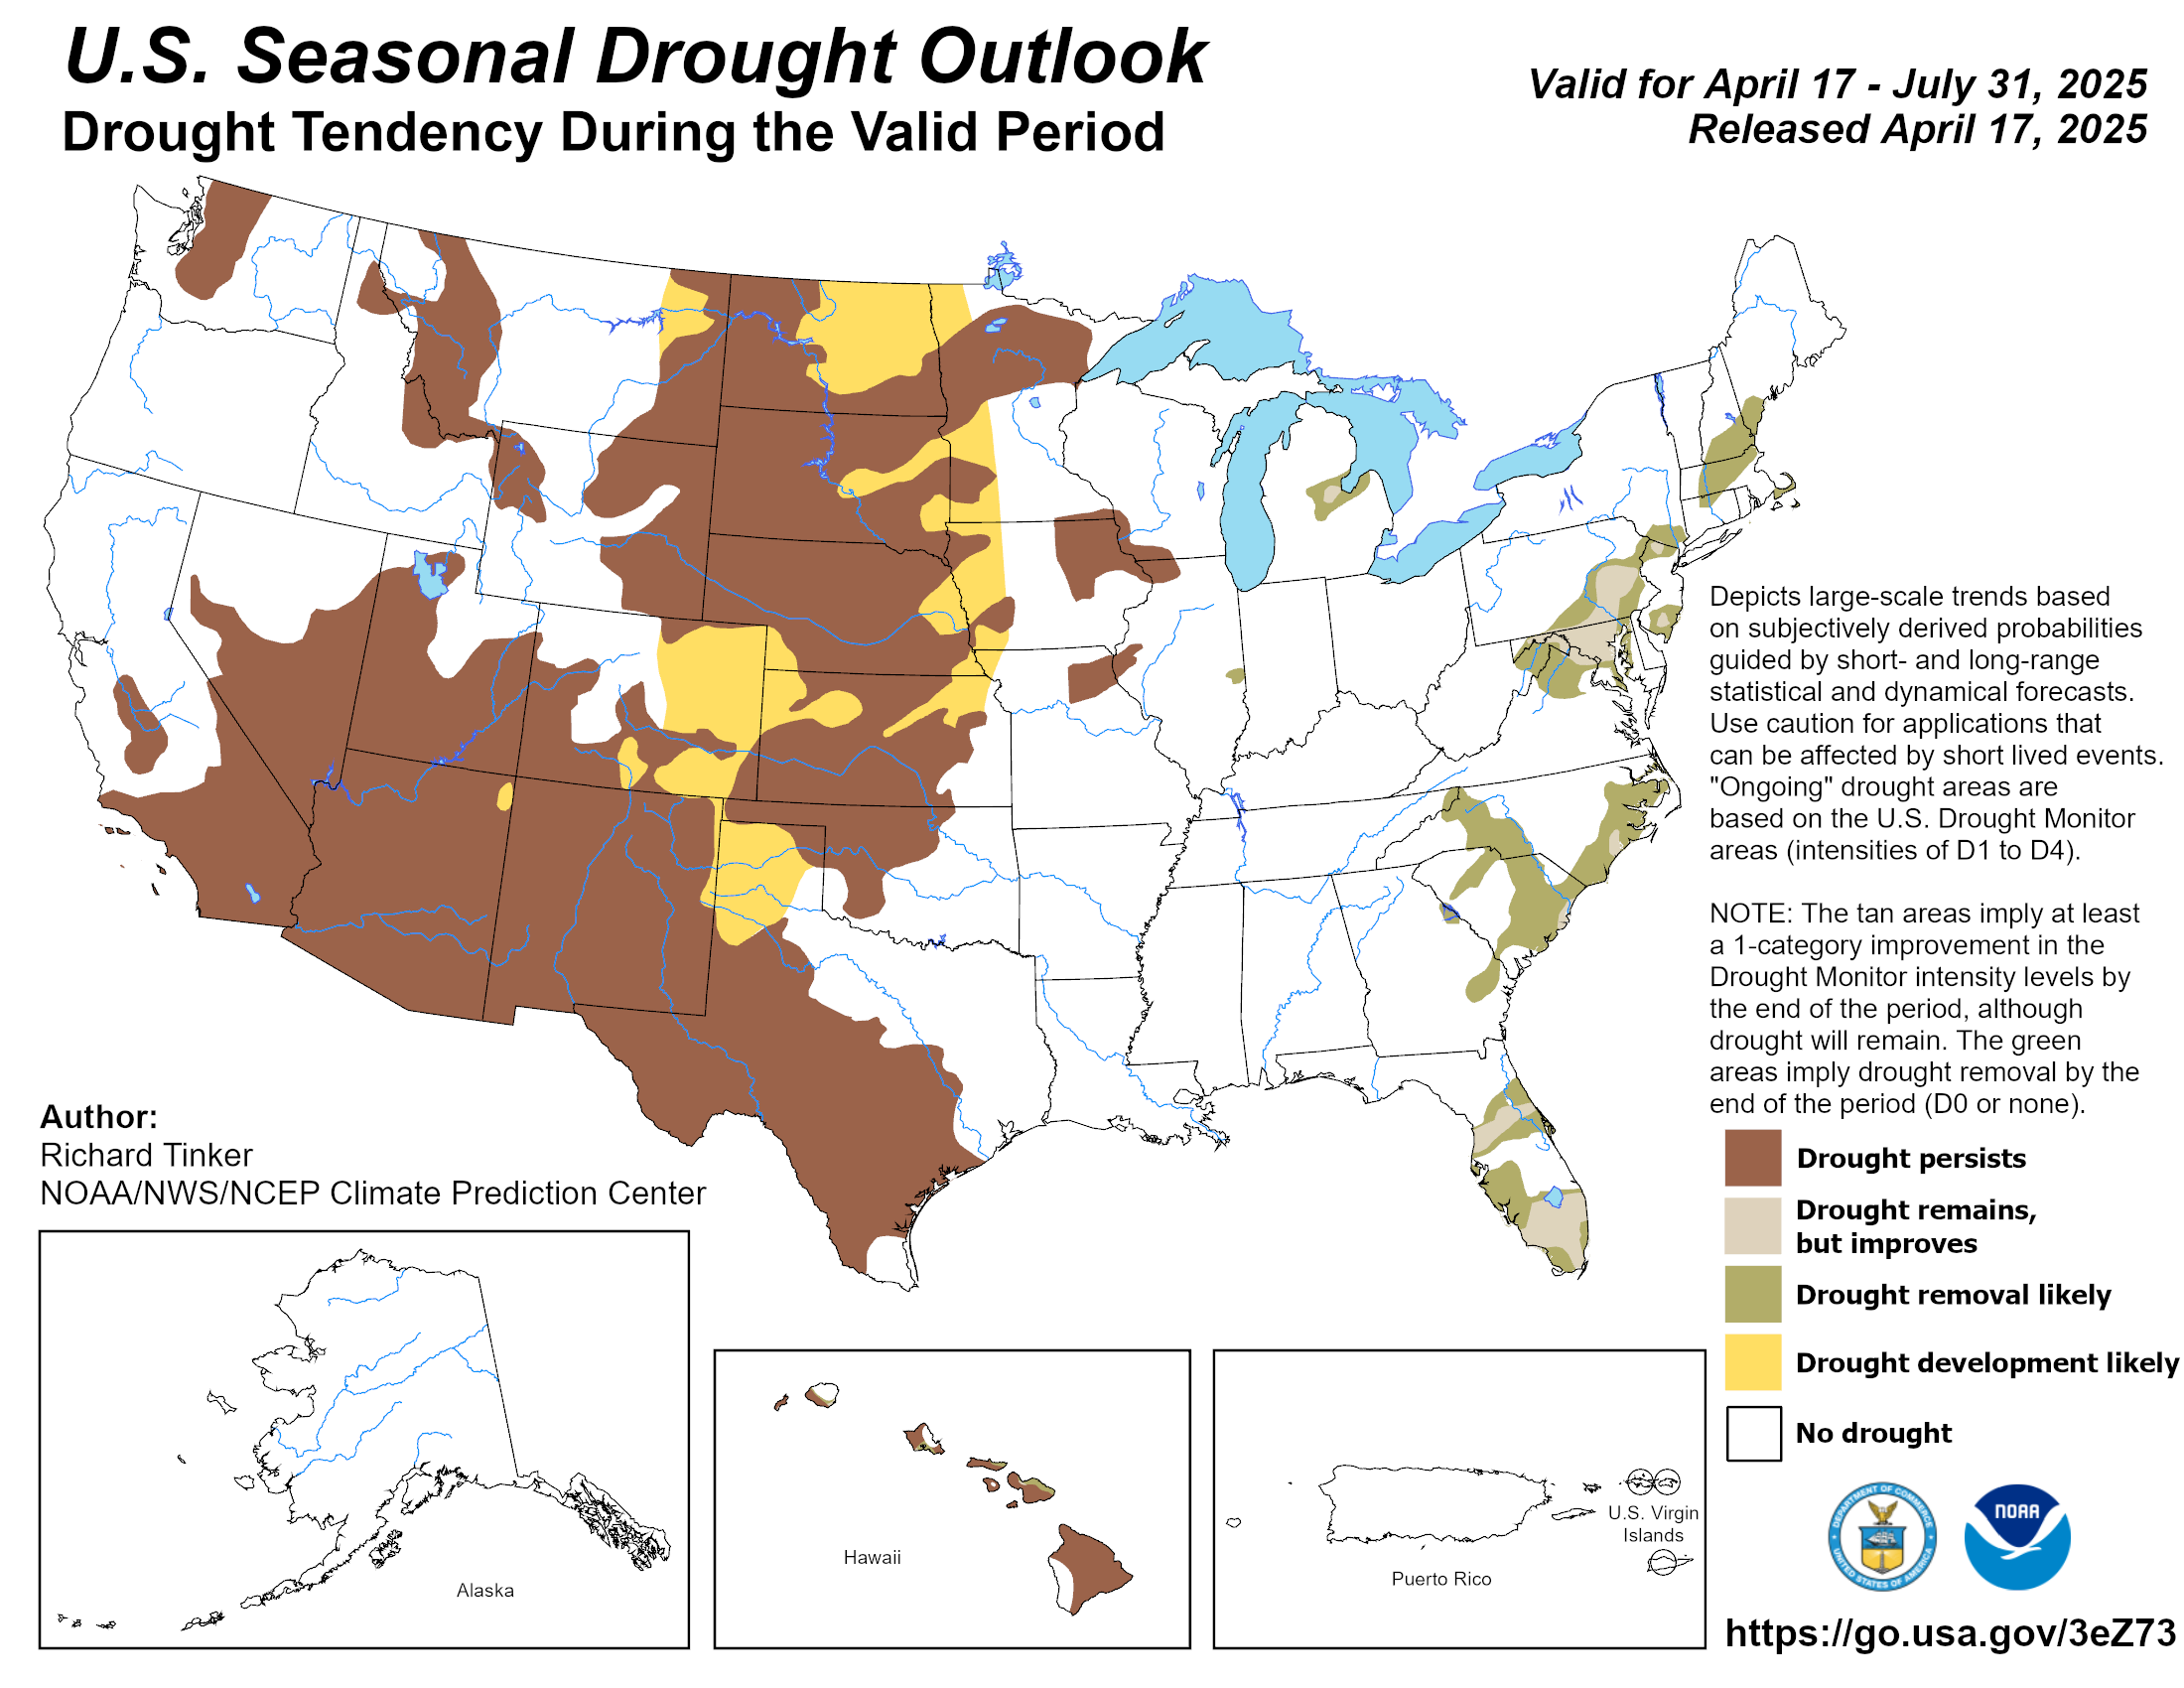
And here is the discussion released with the graphic.
Latest Seasonal Assessment – During the past month, a persistent subtropical moisture plume that extended from the Caribbean Sea northward across the East Coast states resulted in the removal of all drought in this area. Conditions in New England and New York (which missed out on most of the subtropical rain) have steadily declined in the past month, warranting drought development in this region. In the Midwest, a meandering frontal boundary is forecast to bring 3-7 inches of rain to portions of the region, favoring improvement and/or removal of drought. Unfortunately, during this time of year, crops demand a lot of water to grow properly and eventually produce good yields. If the rainfall received does not outpace the high water demand, this area would be prone to redevelopment of dryness and drought later in the July-September (JAS) 2018 outlook period. Precipitation associated with this frontal zone is expected to reach Kansas and northern Oklahoma, promoting drought improvement and/or removal. The Dakotas are expected to be far enough to the north to miss out on the heavy rains associated with the meandering front early in the drought outlook period, and drought is expected to persist in that region. A weak tropical system now along the Texas Coast is bringing heavy rainfall to the area, warranting drought removal. In the Southwest, the climatological onset of the Summer Monsoon is approaching, and favors widespread improvement of drought conditions, especially in the Four Corners region and southern Rockies. The latest guidance suggests this will be a fairly robust monsoon, which will help elevate the confidence level for improvement. In the interior Northwest, with the dry season now in full swing, drought persistence is favored. In Hawaii, persistent trade winds are predicted to bring adequate rainfall to the northeast-facing, windward volcanic slopes. Leeward slopes, however, lie in more protected rain shadow areas, and are therefore expected to see drought develop over the next several months. With most precipitation outlooks out to one season in advance favoring above normal precipitation, any dryness in Alaska is expected to be short-lived. In Puerto Rico, despite this being the rainy season for the Commonwealth, dynamical guidance from the National Multi-Model Ensemble (NMME) predicts a strong signal for dryness. The abnormal dryness region (D0 on the U.S. Drought Monitor) is primed for additional deterioration, along with drought development.
We will look at the next 25 days in just a minute but Since NOAA issued their 15-Month Forecast today (which we will be reporting on this Saturday) it may be useful to look at what their forecasts are for the next three months.
| Temperature | Precipitation |
 |  |
I am showing that here because the Drought Outlook Map issued today covers essentially the same period plus the last ten days of this month.
Now I provide the weather forecasts for different periods of time in June into July which should allow the reader to assess the likelihood of this forecast working out as shown over the next three to four.
2. Current Forecast for Precipitation (Since we published this week on Thursday, we have updated the discussion for the Week 3 – 4 forecast when it was issued today Friday June 22). This is important as the current Day 6 – 14 forecasts and the week old week 3 – 4 forecast overlap to some extent.
| The five day QPF is shown to the right. The units are different than the other maps i.e. in units of precipitation (inches) not probabilities of exceeding or being less than climatology. |  | It is difficult to compare this with the other maps as some places are naturally more wet than others. But it is generally consistent with the 6 – 10 day forecast as one can see how the 6 -10 day might follow the 1 – 5 day. | |
 | Transitioning from the 6 to 10 day outlook on the left to the 8 to 14 day outlook on the right. → |  | |
| It looks dry where the drought is the worst. . | |||
To the right is the week 3 and 4 Experimental Forecast which was updated on June 15 and which we used when we went to press. It should be updated tomorrow. → |  | ↑ ← In generally it would seem that the Week 3 -4 Forecast is feasible. The Week 3 – 4 forecast has now been updated on June 22. It supports the early Monsoon hypothesis but not for much of NM but it does cover the Navajo Reservation in the four states where it is located. But it does not look good in Weeks 3-4 for Texas and east and north of Texas. So we remain concerned for that area re drought through July 20, 2018 i.e. essentially a month. . | |
Here is one more from my weekly report.

The reader may be able to update some of the reports shown in previous weeks at this link where you can access both the current and archived information. The current version released today can be accessed at this link.
One can generate an infinite number of graphics. I did not want to clutter this report with graphics that were not selected by NOAA to be in the Drought Report issued Thursday or the Weather and Crop Bulletin issued on Tuesday. But I have provided readers with the link above that will allow you to view as much data as you want. But I have included many of the graphics at that link which were recently updated and included in the USDA Crop Bulletin.
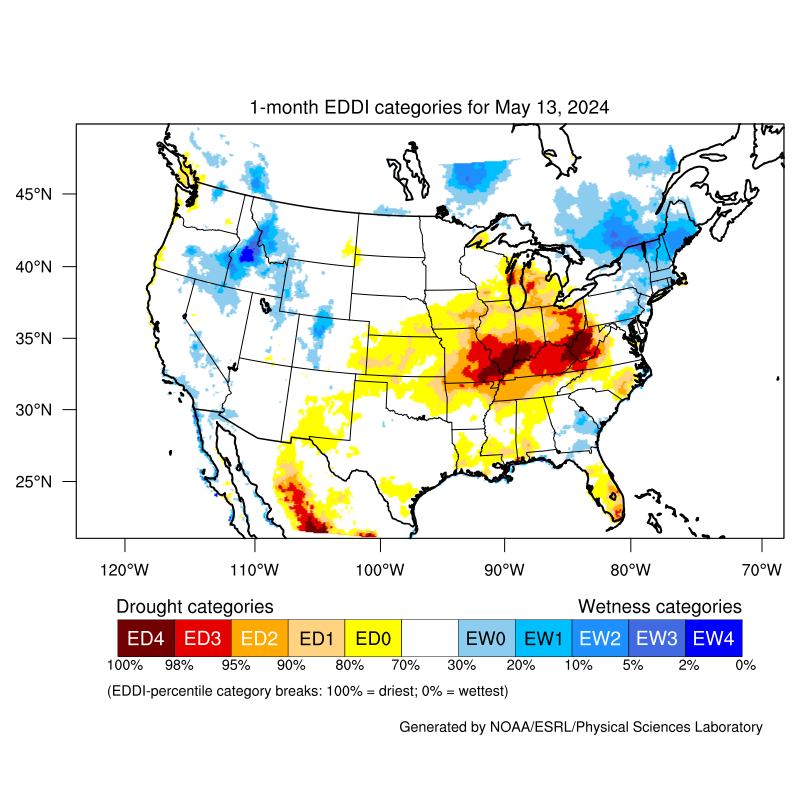
And here is a graphic that pulls a lot of information together. Image provided by the NOAA/ESRL Physical Sciences Division, Boulder, Colorado see website. It shows the demands of the atmosphere for moisture from the ground and is based on temperature, wind, relative humidity and solar radiation. It tells you nothing about how much precipitation you will get but how much you need to retain the same level of soil moisture.

Here is another way of looking at things.

Not sure why but this graphic was not updated this week. I am not deleting it as it is the latest information we have and I want to keep it as a place holder for next week.


Soil Moisture is a very important part of understanding drought.
| Surface | Subsurface |
 |  |
| The numbers in parentheses show the changes by state. The number of states with surface deficiencies has increased by 2 and the number of states with subsurface deficiencies has also increased by 2. This has occurred even with a reduction in the area where the drought is most intense. | |
|  |
| There has been a small increase in the number of states with a surplus. It is not always easy to know how to relate to a moisture surplus. Is it a positive moisture reserve or is it too wet to work the ground? But the combination of more states having deficits and fewer states having surpluses confirms that it has been dry. | |
Taking a retrospective look at the full months of May. This section has graphics that were presented last week. This is a weekly report and monthly graphics only update once a month but I thought they were sufficiently important to include.

And percent of Normal

State Ranking precipitation. This week I am showing both the completed month (May) and the three- month period (March/April/May)
| March to May | May |
 |
|

And now temperature:

| March to May | May |
 |
|

3. Selections from the Tuesday USDA Weather and Crop Bulletin (full report can be accessed here) supplemented by related information. (many of the weather related graphics have already been presented)
The Summary for the U.S.

Below are more details and there is more information this week as the planting season advances.
This summarizes the situation which is not very much different than the report last week. In some cases there is slight improvement and this is best seen in the detailed tables below. It is getting to be difficult preparing this table separate from the information above and below. The reason for that is that in general there are at this point in time three parameters reported:
1. percent planted
2. percent that has developed to a key point
3. crop condition
Plus there are two reference points: last year and the five year average. So it is harder to assess the six measurements and arrive at a single conclusion for a crop but I have taken my best shot at it. For those with a more serious interest I suggest you review the tables below and the text summary above which is what I have done to populated this table which has not changed since last week.
| Worse than last year and or 5-Yr average | Better than last year or 5-Yr average | In line with recent conditions for this time of year or 5 – Yr Average |
| Winter Wheat, Peanuts, Sorghum, Cotton, Pasture and Range Conditions | Corn, Barley, Oats, Soybeans, Rice, Spring Wheat | Sunflowers, |
The information in the table below is summarized in the above discussion but in the table below, it is broken down by State.


Sometimes a map can be helpful to make text come alive.

I am now routinely including the precipitation report for Mexico since storms do not respect borders.

Additional Reference Information
A more complete description of


Source: National Drought Mitigation Center, University of Nebraska-Lincoln, U


