Written by Sig Silber
Updated at 8 pm EDT June 8, 2018 to reflect the updated Week 3 – 4 Forecast that suggests that the Four Corners states will be wet as June evolves.
Very little change this past week in the drought situation but in places surprising “dryness” which is the category just below “Moderate Drought”. Somehow, most crops have recovered or are catching up. Ranching remains in the worst shape but slightly improved where it has rained. This week looks dry in the most significantly impacted drought areas but the question is “what about next week?” The outstanding question: Will the Four Corners High move far enough to the east to allow an inverted trough from Mexico to produce an early Monsoon Burst?

Please share this article – Go to very top of page, right hand side for social media buttons.
Prelude
From today’s NWS 1:57 PM Discussion from the Phoenix Office.
Attention still remains focused on next week and the potential for the first northward push of monsoonal moisture into central portions of Arizona. A shortwave trough will pull northeastward out of the intermountain west this weekend, with midlevel heights building in its wake across the southwest and Southern Plains. Eventual eastward expansion of the area of high pressure aloft will put the southwest in a southerly flow regime aloft by the middle of next week. Additionally, both Hurricane Aletta (south of baja california) and perhaps another tropical disturbance will aid in drawing moisture northward across northwest Mexico. The longitudinal position of moisture across Arizona will be dictated by how far east the upper ridge extends, but there is relatively good agreement amongst model guidance for higher precipitable water values to advect northward. In fact, the GFS maintains a forecast of near- climatological record precipitable water values over 1.5 inches across the area, which would certainly be supportive of precipitation/convection. However, considering the climatological rarity of this type of environment still being approximately one week out, still not completely buying into this solution. It appears the most likely scenario will be isolated to scattered thunderstorms across the higher terrain of southeast and eastern Arizona, with low-end precipitation chances across the lower deserts of south-central Arizona. One favorable side effect may also be slightly cooler temperatures with increased moisture/cloud cover around.


Conclusion
Here is our Full Weekly Report.
This report is organized into three parts plus additional reference Information at the end of the report:
- The U.S. Drought Monitor (full report can be accessed here)
- Selected parts of our Weekly Weather and Climate Report (Monday’s full report can be accessed here) which has forecasts for the next 25 days and which auto-updates
- Selections from the Tuesday USDA Weather and Crop Bulletin (full report can be accessed here) supplemented by related information.
1. U.S. Drought Monitor
The U.S. Drought Monitor is a comprehensive way of understanding the drought situation for the U.S. It is issued every Thursday and reflects the conditions as of the prior Tuesday. Drought is defined as a moisture deficit bad enough to have social, environmental or economic effects. Thus, more factors than recent precipitation are considered and more information on how it is done is found at the end of this report.

Below is the same map with statistics and below that map I have provided a cut-out of the statistics which I think you can click on to enlarge.


| Last Week | This Week |
 | |
This graphic shows the one week change in drought intensity. Yellow is bad. Green is good.

Now we show the same information by region. The yellow is where the drought has been upgraded.
 |
| Mixed |
 |
| Improvement North, Deterioration South Central |
 |
| Deterioration in Vermont and Southern Maine |
 |
| Improvement to the west which was needed. Deterioration in Central and South Texas. |
 |
| It has been wet in this area and projected to continue to be wet. Perhaps too wet. Slight improvement shown. |
 |
| Not much change in the worst drought area. Some deterioration in Western Oregon and Washington State. |
This pair of maps might make it easier to get a general idea of what is happening in the worst part of the drought area.
| Last Week | This Week |
 |  |
Animation of twelve weeks of change

Here is the discussion which was issued with the Drought Monitor today.
This Week’s Drought Summary
Frontal and thunderstorm activity provided moderate to heavy rain (at least 0.5-inch) over northern, eastern, and central portions of the CONUS this past week. A weakness in the mid-tropospheric subtropical ridge over the Gulf of Mexico and southeastern states contributed to the influx of subtropical moisture across this region. Over the weekend, a cold front moved into the mid-Atlantic area and stalled, providing a lifting mechanism for the inflowing moisture. This resulted in heavy rain (generally 2-6 inches, locally greater) across much of Virginia, Maryland, eastern West Virginia, and southern Pennsylvania. Temperatures were near to above average across practically the entire contiguous U.S., with the greatest departures (6-12 degrees F above average, locally greater) for a large portion of the southern Great Plains, the Mississippi Valley, the Dakotas, the Great Lakes region, and the Ohio Valley.
Northeast
Temperatures (ACIS) during the past 7-days ranged from about 1-6 degrees F above average in New England. Precipitation deficits for the past 30-days ranged from about 1-4 inches below normal, with the higher deficits indicated over far southern Maine and adjacent portions of New Hampshire. Stream flows in this area are within the lowest quartile of the historical distribution for this day of the year, especially in Maine. USDA/NASS topsoil moisture is 70% very short to short in New Hampshire, 55% in Massachusetts, and 48% in Maine. Based on these factors, abnormal dryness (D0) was expanded to include most of New Hampshire, the western half of the Maine coast, and northeast Massachusetts.
Southeast
Although southern Virginia did not receive the very heavy rainfall that was reported just to its north, it still received enough to justify wiping out any residual dryness. In North Carolina, while some areas were too wet for farmers to complete field operations due to rainfall over the last few weeks, most areas were showing normal groundwater conditions, and the remaining D0 area in the state was removed. Any lingering D0 was also removed in Georgia this week, consistent with adequate soil moisture conditions. As of this writing, Athens, GA, reported at least 19 consecutive days of measurable rain so far. Eleven locations (CoCoRaHS and COOP) have measured 13 or more inches of rain for the month of May in northeastern Georgia, with 2 locations in west-central Georgia. In Alabama, streams were near or above normal in the aftermath of Alberto. D0 was trimmed out of Tallapoosa, Clay, Randolph, and northern Chambers Counties in the northeast part of the state, while D0 was added to Etowah County. In southwest Alabama, D0 was expanded into eastern Washington County.
South
According to ACIS, measured precipitation during the past 7-days was less than 0.5-inch over much of the South. Weekly temperature departures generally ranged between 4-10 degrees F above average. Significant 30-day precipitation deficits and near-record warm temperatures prompted the expansion of D0 across portions of Texas. In fact, the entire Texas drought depiction experienced another major overhaul this week. Low stream flows have been an issue in the Texas Hill Country for several months already. The position of the impacts line was adjusted to approximately bifurcate the state into a western portion (now SL, with longer-term deficits appearing), and an eastern portion (still S). Across the deep South Texas counties of Willacy and northern Cameron, conditions were degraded this week from D1 to D2, based on stressed fields of cotton (despite ongoing irrigation), high KBDI levels (600-700), and a 120-day SPI blend. In Oklahoma, continuing degradation of conditions led to an expansion of both D0 and D1 in southeast parts of the state. A few tweaks were made to the depiction in western Oklahoma as well, based on recent rainfall. Hot, relatively dry conditions prompted a broad expansion of D0 across most of Louisiana, western Arkansas, and adjacent portions of western and southern Mississippi this week. Current NLDAS soil moisture anomalies for the root zone (top one-meter) indicate values ranging from 1-3 inches below normal. Shreveport, LA, reported its warmest May on record, 78.4 degrees F, which supplanted the old record of 77.8 degrees F set back in 1933. Two areas of D1 were introduced in northwestern and south-central Louisiana this week. Topsoil moisture (Very Short to Short) for a few states include: Louisiana (73% this week, 55% last week), Arkansas (34%, 21%), Mississippi (22%, 14%) and for the Contiguous U.S. as a whole (28%, no change from last week). For Rangeland/Pastures, the percentages rated Very Poor to Poor this week compared to last week include: Louisiana (30% this week, 17% last week), Arkansas (6%, 8%), Mississippi (11%, 11%).
Midwest
The Midwest drought depiction was altered this week based largely on recent rainfall. In northern Minnesota, northern Wisconsin, and northern Michigan, areas of abnormal dryness (D0) were trimmed away. Factors considered included the AHPS 200 Percent of Normal Precipitation (PNP) map, 30-day SPI, and near to above-normal stream flows. In Indiana, despite some rain during the previous week, deficits were still significant enough to warrant an expansion of the D0 area from southwestern Indiana northeastward to central Indiana, including Indianapolis. This expansion is aligned with the 7-day observed minimum precipitation axis through this area, and has additional support from ACIS 30-day and 60-day SPI maps, ACIS 60-day Departure from Normal Precipitation (DNP), and broad support from the June 4th VegDRI map. In central Iowa, D0 was introduced based on PNPs less than 50% over the last month. In northwestern Missouri, St. Joseph (Buchanan County) reported 19.28 inches of precipitation over the past year (Jun 1, 2017-May 30, 2018). Normal precipitation for this area and time period is 35.60 inches. Many different types of plants (such as woody, some perennials, and evergreen), and trees (such as pines, yews, and boxwoods) have shown significant amounts of stress from the drought. In nearby Hamilton, the city lake is very low, as are many ponds throughout the region. This week, severe drought (D2) was expanded across northwest Missouri, and approximately the eastern half of the moderate drought (D1) area in northern Missouri was expanded slightly southeastward. In Illinois, a north-south oriented, split band of heavy rain (3-6 inches) fell in the Peoria area very early in the drought week, associated with the departing remnants of Alberto. D0 was broadly expanded across a substantial portion of central and eastern Illinois, connecting up with the D0 over southwestern Indiana. This is related to the combination of short-term dryness and 90-degree temperatures, which appear to be causing water stress on corn and soybeans.
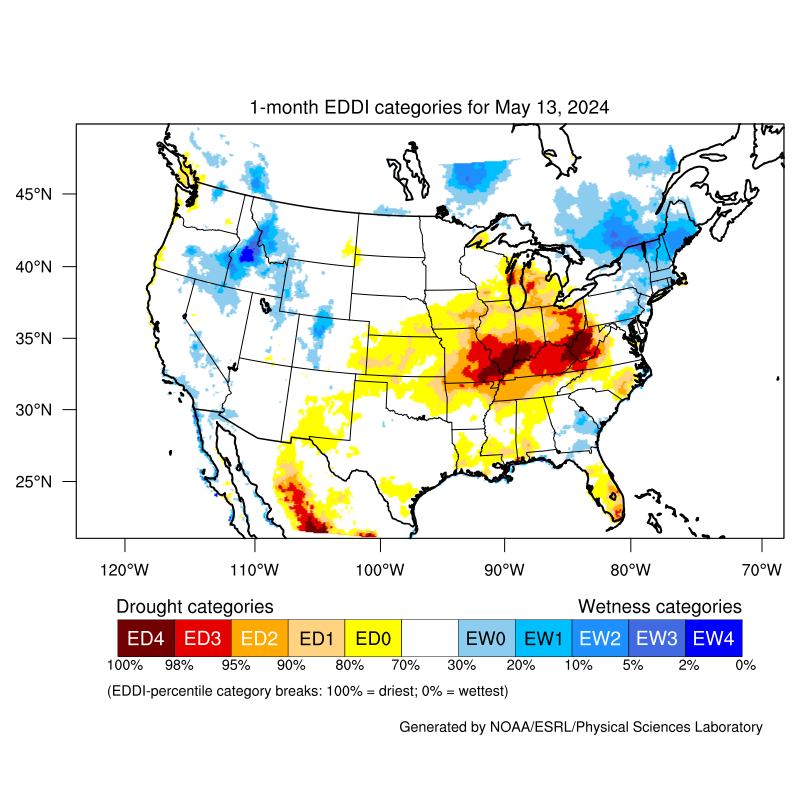
Incidentally, the importance of rapid loss of moisture through evaporation has become a very important consideration in early detection of flash drought; hence the increasing reliance upon the Evaporative Demand Drought Index (EDDI). High values of the 2-week EDDI (ED1 to ED3) across the Corn Belt are indicative of significant moisture loss, which must be balanced against any moisture gains that occur through precipitation. It is the interplay between evaporation, high heat, rainfall, soil moisture, and wind speeds that has a significant bearing on accurate drought prediction.
High Plains
Heavy rain (2-6 inches, locally greater) fell over portions of North Dakota this week, with the highest amounts over the northwest part of the state. Much of the heaviest rain actually fell north of the Canadian border in extreme southeastern Saskatchewan. Slight alterations (both improvement and deterioration) were rendered to the depiction in western, north-central, and southeastern North Dakota, based in part on the 1-month EDDI, which takes into account evaporative demand. Both improvements and degradations were also made to the South Dakota depiction, which received much less rain this week than its northern counterpart. For example, Aberdeen reported only 0.52-inch of rain in May (2.59 inches below normal), making it the seventh driest on record. An area of severe drought (D2) was introduced to northeastern South Dakota, based on 60-day precipitation deficits, 30-day and 60-day SPI, recent warm temperatures, and increased water demand through evapotranspiration. A spectacular dust storm, attended by 50-80 mph winds, blew through this region (Hand and Faulk Counties) on June 1st. In southeastern Colorado, a one-category degradation was made to the depiction in Kiowa County. Decent soil moisture from the wet summer and fall of 2017 is now gone, due to the recent hot, dry weather. This, in turn, has taken its toll on crops. Although welcome rains fell across eastern Nebraska this week, it was decided not to make any changes to the state depiction until more information is at hand next week.
West
Minor adjustments were made this week to the D0 area along the eastern Montana state line. In northwestern Montana, it was eventually decided to postpone the introduction of D0 to the region. Although some drying has occurred, this area experiences healthy stream and river flows, due to continuing snow melt. In nearby northern Idaho, recent flooding precludes the introduction of any D0 at this time. This area will continue to be monitored for the possible inclusion of D0 in the next week or two. In western Oregon and western Washington, an extended dry pattern set in ahead of schedule, with rapidly declining stream flows (most are now within the lowest quartile of the historical distribution for the day of the year). There is a notable degradation in the SPI maps going from 60- to 30-days out. The more recent SPI values in this region range between -2.0 and -2.5. Accordingly, D0 was expanded across western portions of both Oregon and Washington this week. Finally, in southwestern New Mexico, water restrictions were initiated as storage in the Elephant Butte and Caballo reservoirs (along the Rio Grande in Sierra County) dropped below 400,000 acre-feet.
Alaska, Hawaii, and Puerto Rico
In Puerto Rico, June and the first half of July are climatologically dry times of the year. Satellite imagery from the Visible Infrared Imaging Radiometer Suite (VIIRS) reveals the southern slopes of the island are drying out. These two factors led to the introduction of D0 in this region. No changes were deemed necessary this week in either Hawaii or Alaska.
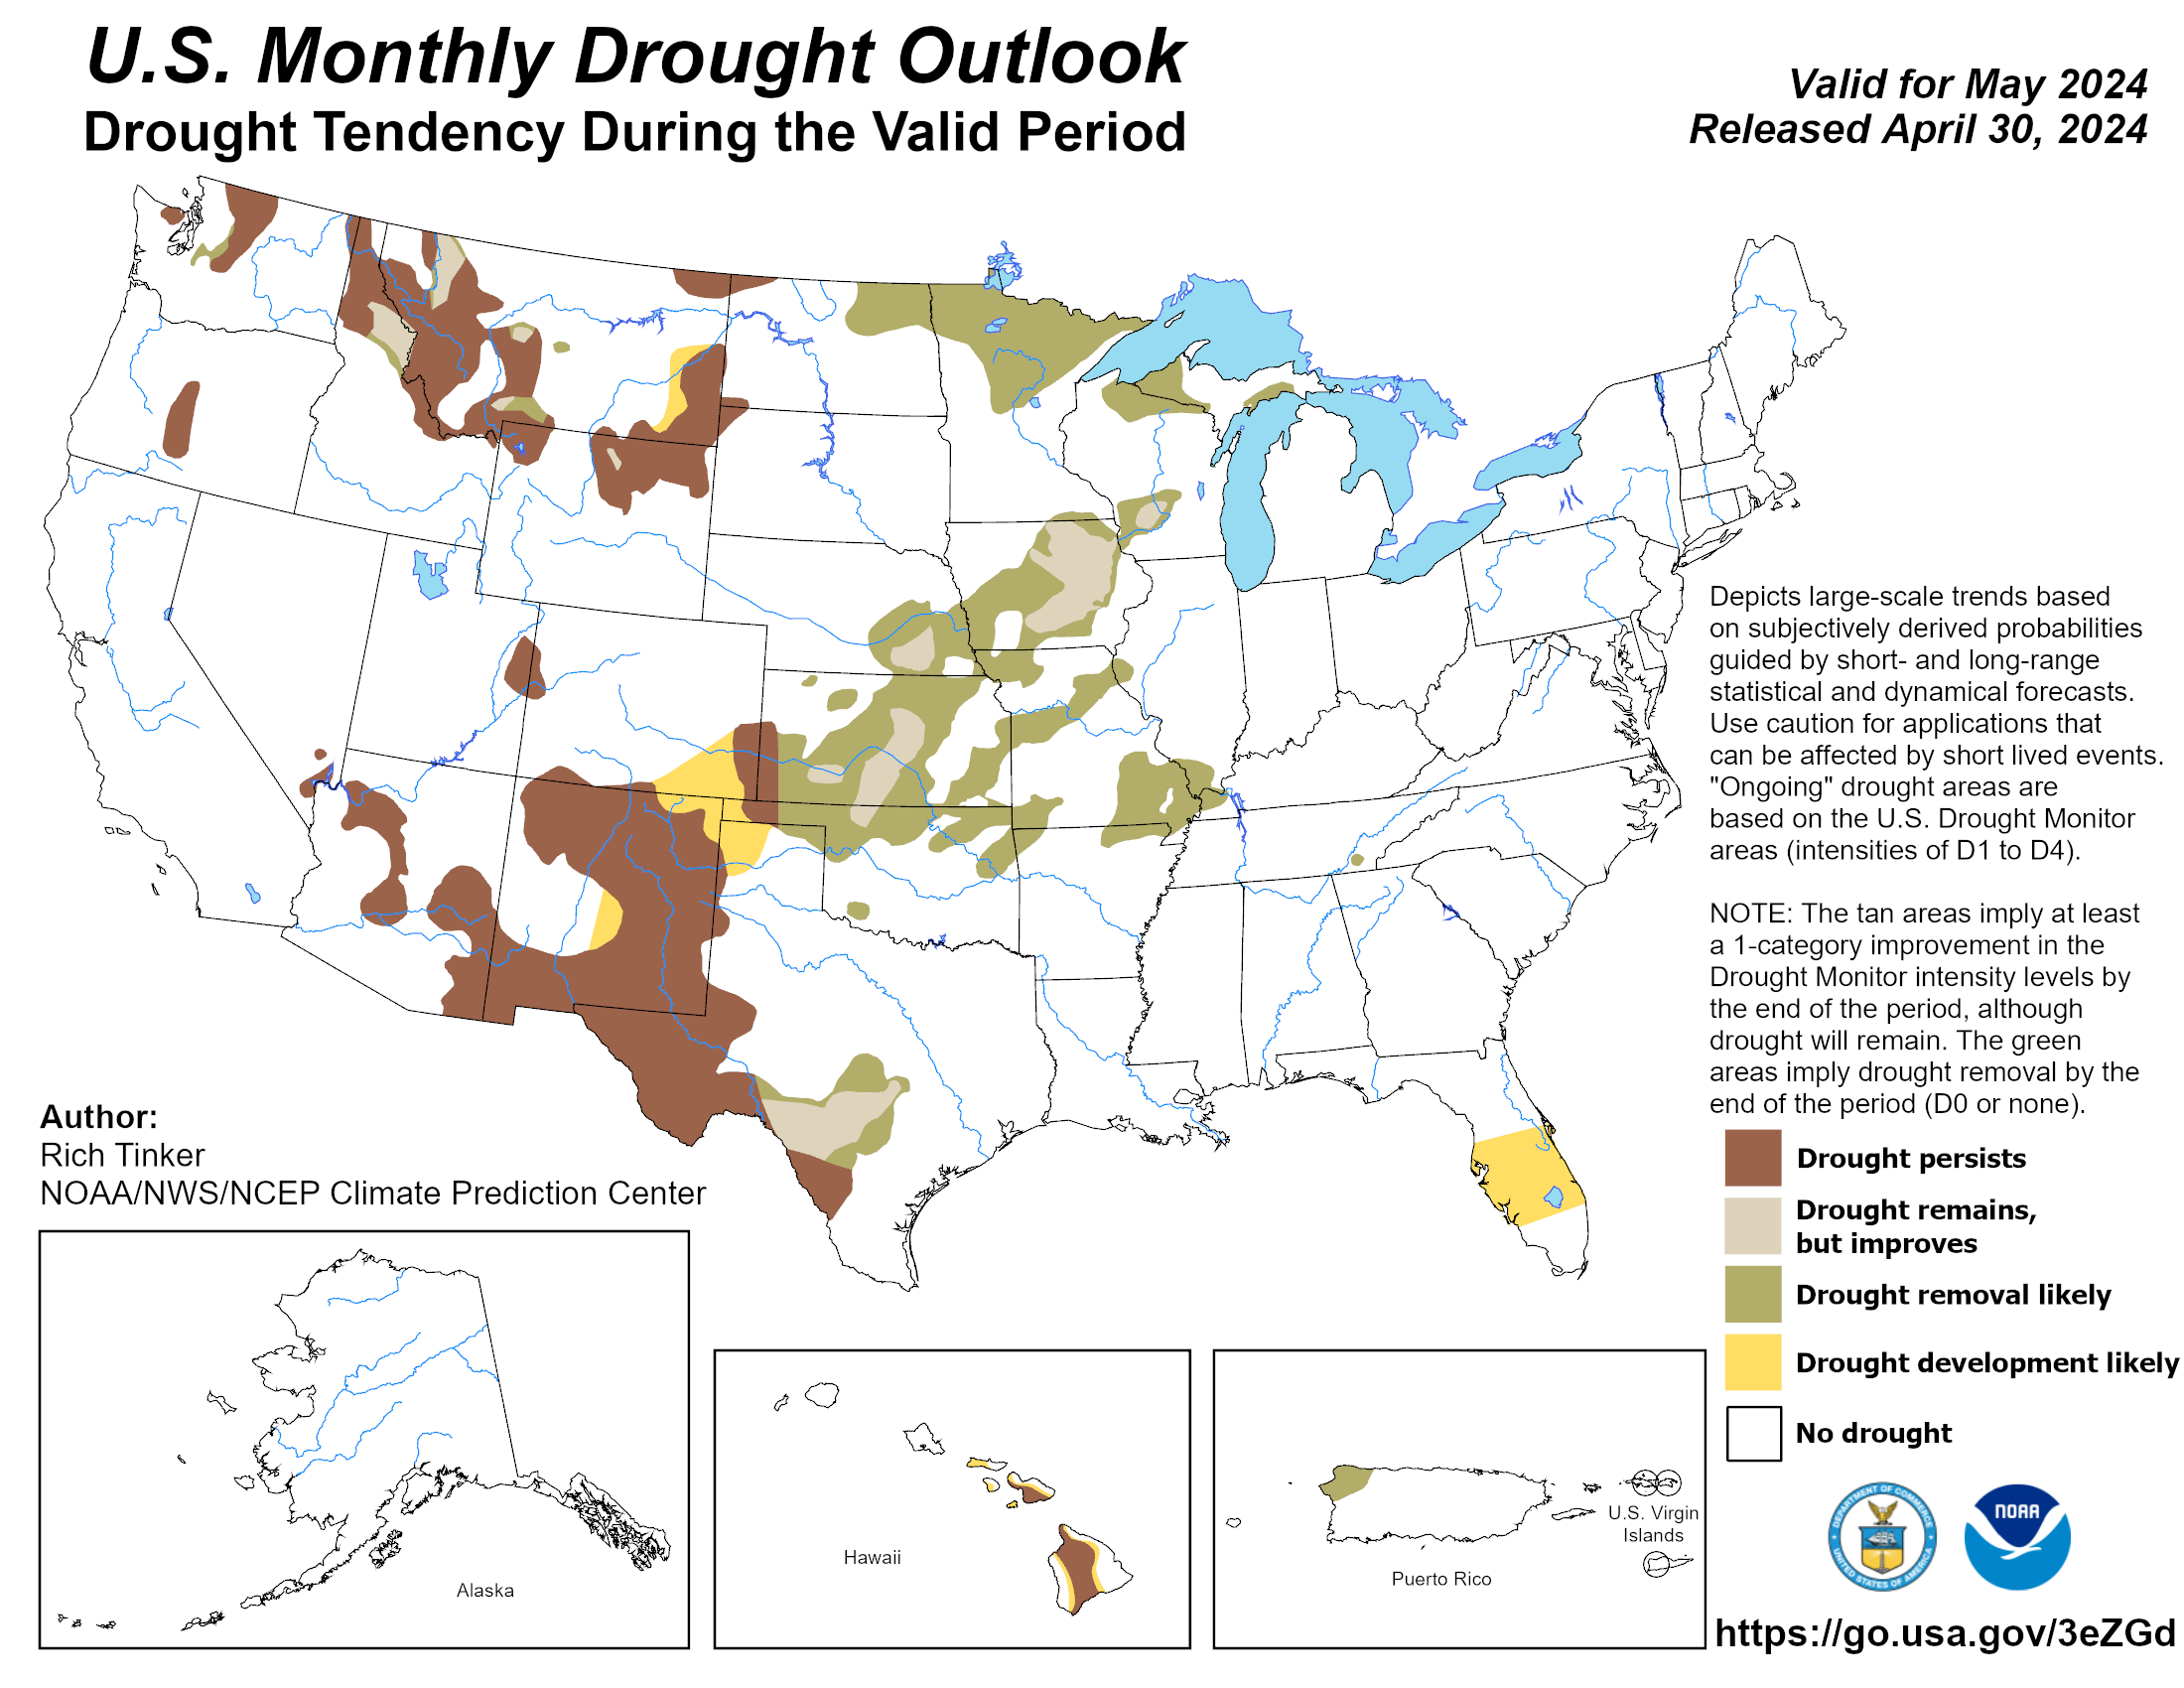
Looking Ahead
For the ensuing 5-day period (June 7-11, 2018), the northern and eastern CONUS are generally predicted to receive 0.5-1.5 inches of rain. Heavier amounts are forecast over portions of the western Corn Belt, the southern Great Lakes region, and the Florida peninsula. A relative maximum of 3-4 inches is possible in Iowa, likely due to nocturnal thunderstorm clusters (MCS) which are common at this time of year. Little to no precipitation is expected elsewhere during this period. For the subsequent 5-day period (June 12-16, 2018), CPC predicts elevated odds of above normal rainfall across the southern CONUS, with a weak tilt toward above running northward across the Mississippi Valley and eastern Great Plains region. Elevated odds of below normal rainfall are highlighted over the Northwest, the northern High Plains, and most of the Atlantic Coast states from Maine to Virginia.
Here is what happened with precipitation during the most recent week.

And here is the forecast issued on May 31, 2018. It was not updated this week so we rely on the forecast analysis that follows this graphic.
Now I provide the weather forecasts for different periods of time in June which should allow the reader to assess the likelihood of this forecast working out as shown.
Current Forecast for Precipitation (Since we published this week on Thursday, we updated the discussion today re the updated Week 3 – 4 forecast issued on Fridays e.g. today June 7). This was important as the current Day 6 – 14 forecasts and the week old week 3 – 4 forecast overlap to some extent.
| The five day QPF is shown to the right. The units are different than the other maps i.e. in units of precipitation (inches) not probabilities of exceeding or being less than climatology. |  | It is difficult to compare this with the other maps as some places are naturally more wet than others. But it is generally consistent with the 6 – 10 day forecast as one can see how the 6 -10 day might follow the 1 – 5 day. | |
 | Transitioning from the 6 to 10 day outlook on the left to the 8 to 14 day outlook on the right. → |  | |
| The Southern Plains looks bad. The wet area shown for Arizona and New Mexico is tonight still questionable. We will update our commentary Monday on these graphics which auto-update or perhaps even tomorrow i.e. Friday. . | |||
To the right is the week 3 and 4 Experimental Forecast which was updated on June 1 and which we used when we went to press. It has now been updated. → |  | ↑ ← In generally it would seem that the Week 3 -4 Forecast is feasible. The Week 3 – 4 forecast was updated today June 7 and suggests that the Southern Plains drought will intensify after some relief and the states which can benefit from the Southwest Monsoon are likely to obtain relief. . | |
| To the right is the full month Precipitation forecast for June |  | The full month forecast may not fully reflect the Week 3 – 4 Forecast which was issued a day later than the full-month forecast but with the updated Week 3 – 4 forecast released today it looks pretty good. | |
| Added the Full Month of June Temperature forecast since this drought where it is centered is very impacted by temperature. |  | The temperature forecast looks pretty good except in the Northeast which is not that relative to this drought. | |
The reader may be able to update some of the reports shown in previous weeks at this link where you can access both the current and archived information. The current version released today can be accessed at this link.
One can generate an infinite number of graphics. I did not want to clutter this report with graphics that were not selected by NOAA to be in the Drought Report issued Thursday or the Weather and Crop Bulletin issued on Tuesday. But I have provided readers with the link above that will allow you to view as much data as you want.
3. Selections from the Tuesday USDA Weather and Crop Bulletin (full report can be accessed here) supplemented by related information.
The Summary for the U.S.

Below are more details and there is more information this week as the planting season advances.
This summarizes the situation which is not very much different than the report last week. In some cases there is slight improvement and this is best seen in the detailed tables below.
| Worse than last year and or 5-Yr average | Better than last year or 5-Yr average | In line with recent conditions for this time of year or 5 – Yr Average |
| Winter Wheat, Peanuts, Cotton, Pasture and Range Conditions | Corn, Barley, Soybeans, Sorghum, Rice, Spring Wheat | Sunflowers, Oats (a little slow may catch up) |
The information in the table below is summarized in the above discussion but in the table below, it is broken down by State.


And here is a graphic that pulls a lot of information together. Image provided by the NOAA/ESRL Physical Sciences Division, Boulder, Colorado see website. It shows the demands of the atmosphere for moisture from the ground and is based on temperature, wind, relative humidity and solar radiation. It tells you nothing about how much precipitation you will get but how much you need to retain the same level of soil moisture.

Here is another way of looking at things.


Soil Moisture is a very important part of understanding drought.
| Surface | Subsurface |
 |  |
| The numbers in parentheses show the changes by state. The number of states with surface deficiencies in unchanged and the number of states with subsurface deficiencies has increased by 1. | |
 |  |
| There has been a small (+1) decrease in the number of states with a surplus. It is not always easy to know how to relate to a moisture surplus. Is it a positive moisture reserve or is it too wet to work the ground? | |

Sometimes a map can be helpful to make text come alive. (was not updated this week so this is from the prior week). An updated map would show dryness for Mexico and wetter conditions for Brazil and Argentina.

I am now routinely including the precipitation report for Mexico since storms do not respect borders.

Additional Reference Information
A more complete description of


Source: National Drought Mitigation Center, University of Nebraska-Lincoln, U


