Written by Sig Silber
Commentary Updated at 4PM Friday, April 27, 2018 EDT to reflect updated Week 3-4 Forecast.
Perhaps my expectations were too high as the overall situation has improved a bit. But the situation for the area most impacted has further deteriorated. As always, when there is a Southern Tier Winter Drought, it is difficult to recover during the Spring which is typically a dry season. Many factors contribute to such a drought persisting into Summer.

Please share this article – Go to very top of page, right hand side for social media buttons.
Part of the explanation of looking to the Atlantic for relief.
I am not going to go into this in detail but as the potential for moisture from the Pacific declines as we move into Spring, the focus shifts somewhat at least to the potential for Gulf Moisture directed on shore by the seasonal migration of the Bermuda High.

This report is organized into three parts plus Additional Reference Information:
- The U.S. Drought Monitor (full report can be accessed here)
- Selected parts of our Weekly Weather and Climate Report (Monday’s full report can be accessed here) which has forecasts for the next 25 days and which auto-updates
- Selections from the Tuesday USDA Weather and Crop Bulletin (full report can be accessed here) supplemented by related information.
1. U.S. Drought Monitor
The U.S. Drought Monitor is a comprehensive way of understand the drought situation for the U.S. It is issued every Thursday and reflects the conditions as of the prior Tuesday. Drought is defined as a moisture deficit bad enough to have social, environmental or economic effects. Thus, more factors than recent precipitation are considered and more information on how it is done is found at the end of this report.

The below map shows the changes. Yellow is bad. Green is good. Later we show the same information by region.

This adds some statistics to the overall picture and shows that the overall extent of drought has remained about the same but the area in the extreme drought categories has increased a bit from 8.18% of land area to 8.50%. The numbers in this graphic are small so harder to read but you can click on the table to perhaps be able to read it more easily.

| Last Week | This Week |
 | |
 |
| Improvement especially in the North. |
 |
| Midwest in good shape with improvement in the North |
 |
| No problem in Northeast |
 |
| Deterioration in Western and Southwest Texas |
 |
| Substantial improvement in the Southeast |
 |
| Deterioration in the part of the West with the worst conditions. |
| High Plains – On average no change |
 |
| Midwest: – There is only 8% of the area with any level of drought. |
 |
| Northeast – There is only 2% of the area with any level of drought |
 |
| South: – Not much change. Overall about 40% of the area has some level of drought. |
 |
| Southeast – Some improvement. Since April 10, 2018 the area impacted by drought has declined from 58% to 40% |
 |
| West: – D4 Drought has increased from 1.70% to 2.47% |
 |
This might make it easier to get a general idea of what is happening in the worst part of the drought area. We created this comparison ourselves so it is not dependent on the mapping capability of the Drought Monitor which earlier today was not functioning properly.
| Last Week | This Week |
 |  |
Animation of twelve weeks of change.

Here is the discussion which was issued with the Drought Monitor today.
This Week’s Drought Summary
The southern High Plains’ second wildfire outbreak in less than a week preceded the arrival of storm system that provided much-needed rainfall on April 20-21. Rainfall in the Plains’ drought-affected areas generally totaled around an inch or less. (Additional rain fell across portions of the central and southern Plains on April 24-25 but will be largely reflected next week.) The fires peaked in intensity on April 17, when southwesterly winds fanned flames amid soaring temperatures, but continued into the following day when winds shifted to a northwesterly direction. Oklahoma’s two largest April wildfires—the Rhea Fire (in Dewey County) and the 34 Complex (in Woodward County)—were nearly fully contained by April 24 after destroying more than seven dozen structures and charring approximately 350,000 acres of brush and grass. Meanwhile, drought continued to intensify in parts of the Southwest, where dry, windy weather prevailed. In contrast, another round of heavy rain struck portions of the South and East, as the slow-moving storm system that had produced beneficial rainfall on the southern Plains eventually drifted eastward.
Northeast
There were no changes to the Northeastern depiction since rain arrived on April 24, after the drought-monitoring period had ended. As a result, a small area of abnormal dryness (D0) and moderate drought (D1) persisted across southern end of the region, covering southern Maryland and environs. From March 1 – April 24, precipitation in Salisbury, Maryland, totaled 4.69 inches (64% of normal).
Southeast
Late in the drought-monitoring period, rain soaked many of the existing areas of dryness (D0) and moderate to severe drought (D1 to D2) from Alabama to the Carolinas. The rain, which fell heavily in some areas for the second time in less than 10 days, brought further reductions in the coverage of dryness and drought. Savannah, Georgia, received 4.33 inches of rain from April 1-24, accounting for more than one-half of its year-to-date sum of 8.38 inches (66% of normal). Savannah measured 3.13 inches of rain on April 23, marking its wettest day since September 11, 2017. Farther south, spotty showers in Florida provided local drought relief. However, some modest expansion of moderate to extreme drought (D1 to D2) was noted in parts of southern Florida. Through April 24, year-to-date rainfall in Fort Myers, Florida, totaled just 3.53 inches (40% of normal).
South
A striking contrast between drought and non-drought areas persisted in a southwest-to-northeast oriented band stretching across north-central Texas and central Oklahoma. Rain provided modest drought relief in Oklahoma and northern Texas, but did not reach most of the region’s other drought-affected areas. Amarillo, Texas, received precipitation totaling 0.49 inch on April 20-21, boosting its year-to-date total to 0.74 inch (20 percent of normal). Meanwhile, some expansion of dryness (D0) and moderate to extreme drought (D1 to D3) was observed across western, central, and southern Texas. By April 22, the U.S. Department of Agriculture indicated that topsoil moisture was rated 67% very short to short in Texas and 53% very short to short in Oklahoma. The value in Oklahoma represented a 19-point improvement from the previous week’s value of 72% very short to short. The southern Plains’ rain also aided wildfire containment efforts. Through April 24, U.S. year-to-date wildfires had consumed 0.96 million acres of vegetation, compared to the 10-year average of 0.85 million acres, according to the National Interagency Fire Center. Just to the east, wet weather persisted in the mid-South, where topsoil moisture was at least one-third surplus on April 22 in Mississippi (49%), Tennessee (46%), and Arkansas (35%).
Midwest
Following a record-setting, mid-month snow storm, some additional snow fell in parts of the upper Midwest on April 18. On that date, La Crosse, Wisconsin, received 6.0 inches of snow. A few days later, rain fell across the southern tier of the region. However, dry weather persisted across northern Missouri and southern Iowa, where there was some expansion of abnormal dryness (D0) and moderate drought (D1). Through April 24, year-to-date precipitation in Saint Joseph, Missouri, totaled just 2.04 inches (31% of normal). By April 22, the U.S. Department of Agriculture reported that topsoil moisture was 19% very short to short in Missouri, up from 12% a week earlier.
High Plains
Following the previous week’s significant drought reductions across the northern Plains, there were no further changes during the drought-monitoring period that ended on the morning of April 24. However, some short-term precipitation deficits have been observed during the last month near the Canadian border in North Dakota and Minnesota, and this area will be closely monitored. Through April 24, month-to-date precipitation totaled 0.15 inch (21 percent of normal) in Grand Forks, North Dakota, and 0.28 inch (25 percent) in International Falls, Minnesota. Farther south, high winds and dramatic temperature fluctuations preceded the April 20-21 rainfall event. For example, Dodge City, Kansas, notched consecutive daily-record lows (19 and 23°F, respectively) on April 15-16, followed by a daily-record high of 94°F on April 17. Dodge City also clocked a wind gust to 66 mph on the 17th, shortly after the passage of a strong cold front ended the short-lived hot spell. By April 19, daily-record lows were observed in Kansas locations such as Russell (26°F) and Wichita (31°F). (Russell and Wichita had also reported daily-record lows on April 16—with 18 and 21°F, respectively.) Some additional precipitation arrived on April 24, as the monitoring period ended. In most cases, the precipitation was highly beneficial but did not provide significant or sustained drought relief. On April 22, topsoil moisture was rated 64% very short to short in Kansas and 53% very short to short in Colorado. For both states, that represented an 8-point improvement (from 72 and 61% very short to short, respectively). Winter wheat condition actually declined during the week ending April 22, with the portion of the crop rated very poor to poor increasing from 24 to 29% in Colorado and from 46 to 49% in Kansas.
West
Mostly dry weather prevailed during the drought-monitoring period that ended on the morning of April 24, except for some snow in the central Rockies. In eastern Oregon, moderate drought (D1) was expanded where recent dryness has reduced topsoil moisture and caused a deterioration in rangeland and pasture conditions. Statewide, Oregon’s topsoil moisture was rated 26% very short to short by the U.S. Department of Agriculture on April 22, up from 18% the previous week. On the same date, USDA rated 28% of Oregon’s rangeland and pastures in very poor to poor condition. Farther south, ongoing and intensifying drought continued to threaten water supplies in portions of the Four Corners States. Exceptional drought (D4) was expanded in the Four Corners region, as two smaller D4 areas were merged. Extreme drought (D3) was expanded in parts of eastern Utah and southern Colorado. On April 22 in New Mexico, topsoil moisture was 90% very short to short, while subsoil moisture was 92% very short to short. New Mexico’s winter wheat was rated 71% very poor to poor, while rangeland and pastures were 58% very poor to poor. Arizona’s rangeland and pastures were in even worse shape-79% very poor to poor on April 22, compared to the statewide 5-year average of 34%. In the hardest-hit drought areas, Southwestern snowpack remained abysmal-or had already melted-leaving little hope for spring and summer runoff. Meanwhile, statewide reservoir storage on April 1 stood at 72% of average for the date in Arizona and 70% in New Mexico. Arizona’s Verde River system contained just 44% of its average April 1 storage, down sharply from 133% at the same time a year ago.
Alaska, Hawaii, and Puerto Rico
Neither dryness nor drought was observed in Hawaii and Puerto Rico. In southeastern Alaska, the arrival of significant precipitation, starting around April 18, led to rising reservoir levels and allowed for the removal of moderate drought (D1). Annette Island, Alaska, received 4.37 inches of rain from April 17-23 to boost its month-to-date total to 6.58 inches (122% of normal).
Looking Ahead
A storm system crossing the Southeast will drift into the Mid-Atlantic States on Friday and reach eastern Canada during the weekend. Meanwhile, a Pacific storm will traverse the Northwest and northern Plains, bearing rain and snow. Five-day precipitation totals could reach 1 to 2 inches or more along the northern Atlantic Coast and from the Pacific Northwest to the northern Rockies. In contrast, dry weather will prevail during the next 5 days in much of the Midwest, as well as southern California and the Desert Southwest.
The NWS 6- to 10-day outlook for May 1 – 5 calls for the likelihood of above-normal precipitation in the Southwest, as well as the central and southern Plains, mid-South, and Midwest. In contrast, generally warmer- and drier-than-normal weather should prevail in the middle and southern Atlantic States, the Pacific Northwest, and northern California.
2. Selected parts of our Weekly Weather and Climate Report (Monday’s full report can be accessed here) which has forecasts for the next 25 days and which auto-updates
Current Forecast for Precipitation (Commentary was updated on April 27 to reflect the updated Week 3 – 4 Experimental Precipitation Forecast). This is important as the current Day 6 – 14 forecasts and the week old week 3 – 4 forecast overlap to some extent.
| The five day QPF is shown to the right. The units are different than the other maps i.e. in units of precipitation (inches) not probabilities of exceeding or being less than climatology. |  | It is difficult to compare this with the other maps as some places are naturally more wet than others. But it is generally consistent with the 6 – 10 day forecast as one can see how the 6 -10 day might follow the 1 – 5 day. | |
 | Transitioning from the 6 to 10 day outlook on the left to the 8 to 14 day outlook on the right. → |  | |
It is hopeful if it plays out as forecast. . | |||
To the right is the week 3 and 4 Experimental Forecast which had been updated on April 20 and which we used when we went to press. → The April 20 forecast was optimistic about relief for Kansas, Oklahoma and Northern Texas but that was Thursday and the subsequent updated forecast came out today Friday and it is different but also represents a two week period that starts one week later. |  | ↑ ← In generally it would seem that the Week 3 -4 Forecast may not so easily evolve from the Day 6 – 14 Pattern early in the week 3 – 4 period. Not a big surprise but the updated forecast took out the prior area of wetness but keeps it in the discussion as a low-probability outcome. To some extent it has been absorbed into the 8 – 14 Day Forecast. | |
3. Selections from the Tuesday USDA Weather and Crop Bulletin (full report can be accessed here) supplemented by related information.
The Summary for the U.S.

The U.S. Drought Monitor does not make forecasts of drought conditions but this part of NOAA does.

And here is a graphic that pulls a lot of information together. Image provided by the NOAA/ESRL Physical Sciences Division, Boulder, Colorado see website. It shows the demands of the atmosphere for moisture from the ground and is based on temperature, wind, relative humidity and solar radiation. It tells you nothing about how much precipitation you will get but it tells you how much you need to retain the same amount of surface soil 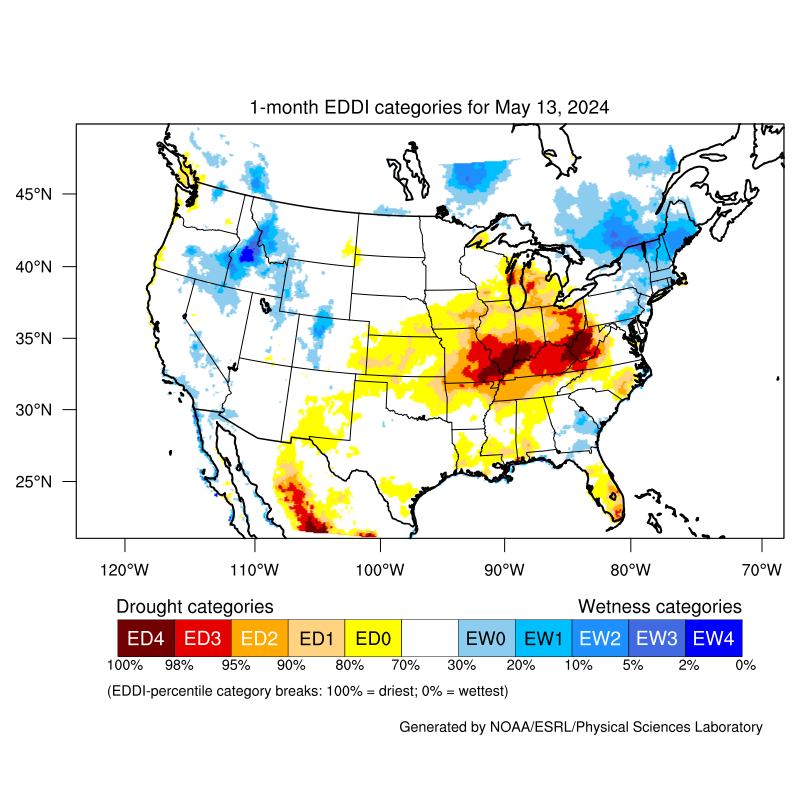
Here is another way of looking at things.

Soil Moisture is a very important part of understanding drought.
| Surface | Subsurface |
 |  |
| The numbers in parenthesis show the changes by state. Overall the situation is static. | |
 |  |
| Again not much change based on the text in the legend or the per state changes in parentheses. | |

Sometimes a map can be helpful to make text come alive.


Additional Reference Information
A more complete description of


Source: National Drought Mitigation Center, University of Nebraska-Lincoln, U


