Written by Sig Silber
The focus of this report is the NOAA May, Three-Month, and 15-Month Forecast; the JAMSTEC Three-Season Forecast; and a comparison of the JAMSTEC and NOAA forecasts. We provide a detailed analysis of NOAA and JAMSTEC forecasts for Alaska and CONUS and we also provide the JAMSTEC Maps for the Rest of the World. There is fairly good agreement for Alaska and CONUS re temperature for this Summer and Fall but total disagreement for next Winter. For precipitation, NOAA is mostly non-committal beyond Summer and NOAA and JAMSTEC disagree somewhat for this Summer. Both Agencies have an El Nino on their radar. The discussion issued by NOAA is very good and actually more informative than their maps this month.

Please share this article – Go to very top of page, right hand side for social media buttons.
Summary: NOAA sort of forecasts temperature for two seasons but only one for precipitation other than for Alaska. JAMSTEC goes out more on the limb. It is certainly safer to not look out too far but it is less helpful perhaps and certainly less interesting. The assumptions on ENSO are only slightly different for the two agencies with NOAA more committed to ENSO Neutral but not ignoring the chances of a weak El Nino and JAMSTEC forecasting ENSO Neutral with an El Nino Bias. NOAA focuses more on decadal trends and the impact of current levels of soil moisture. It reminds me to some extent of the theory that precipitation follows the plow in that current levels of precipitation impact and may reflect micro-climates.
This report is organized into a summary that has two tables of graphics that show the temperature and precipitation forecasts for the upcoming three seasons, A brief discussion of the ENSO assumptions by both NOAA and JAMSTEC and then a lengthy analysis which is organized into three parts:
A. A full discussion of the recent NOAA Seasonal Outlook
B. A comparison between the NOAA and JAMSTEC Forecasts.
C. A more detailed analysis of the forecasts for ENSO by NOAA and JAMSTEC and others including the Australian Bureau of Meteorology and other factors influencing the forecasts.
For those who want a quick synopsis of the two forecasts, below is a summary of the temperature and precipitation forecasts for three time-periods and from left to right the NOAA forecast for Alaska and CONUS (the contiguous mid-latitude U.S), then JAMSTEC for North America (which includes Canada and Northern Mexico), and then JAMSTEC for Europe and surrounding areas. Larger graphics are provided later in the report. It is kind of a tease to keep you reading but you can see the evolution of the weather pattern through Spring, Summer and into Fall. For some readers, these two sets of summary graphics may be all the information they wish to look at and that is fine.
Temperature
| NOAA Alaska Plus CONUS | JAMSTEC North America | JAMSTEC Europe | |
JJA Summer Temp |  |  |  |
SON FALL Temp |  |  |  |
DJF Winter Temp |  |  |  |
Precipitation
| NOAA Alaska Plus CONUS | JAMSTEC North America | JAMSTEC Europe | |
JJA Summer Precip |  |  |  |
SON Fall Precip |  |  |  |
DJF Winter Precip |  |  |  |
This is a summary of the ENSO forecasts of the two agencies. But the CFSv2 is not the only tool NOAA uses but the JAMSTEC Nino 3.4 forecast is input to their forecasting model.
| NOAA CFSv2* | JAMSTEC |
 |  |
This NOAA model keeps us in ENSO Neutral indefinitely. I have drawn the +0.5C and -0.5C lines. | JAMSTEC quickly goes to Neutral and then with a warm bias almost to El Nino values into the winter of 2018/2019. |
| Here is the longer version of the JAMSTEC forecast. It tends towards ENSO Neutral values with a warm bias through the end of 2019 into 2020 |
|

NOAA relies on a variety of forecasts including the CPC/IRI forecast which we discuss in Section C in addition to the CFSv2 model shown above. JAMSTEC uses the above in developing their forecast Maps. A part of forecasting is the forecast of Sea Surface Temperatures (SST) as this is very important for many forecasting models.
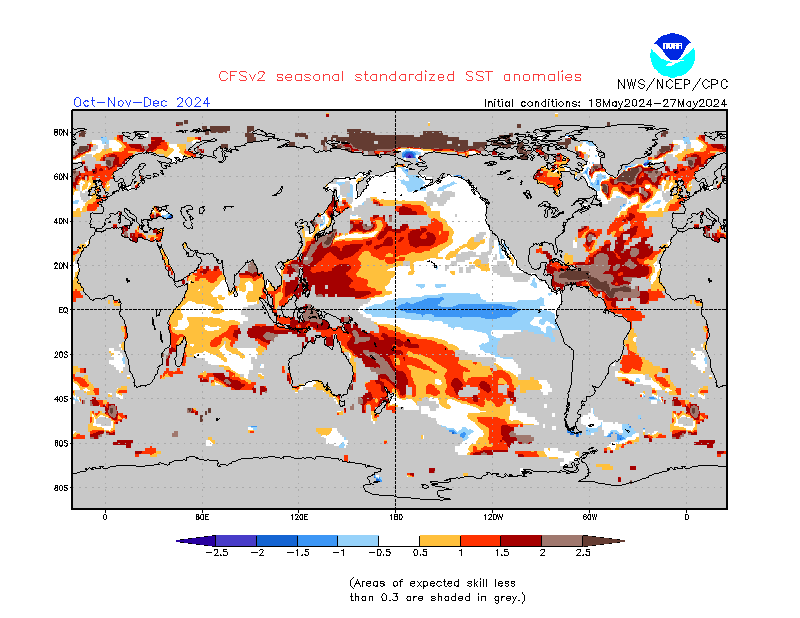 |  |
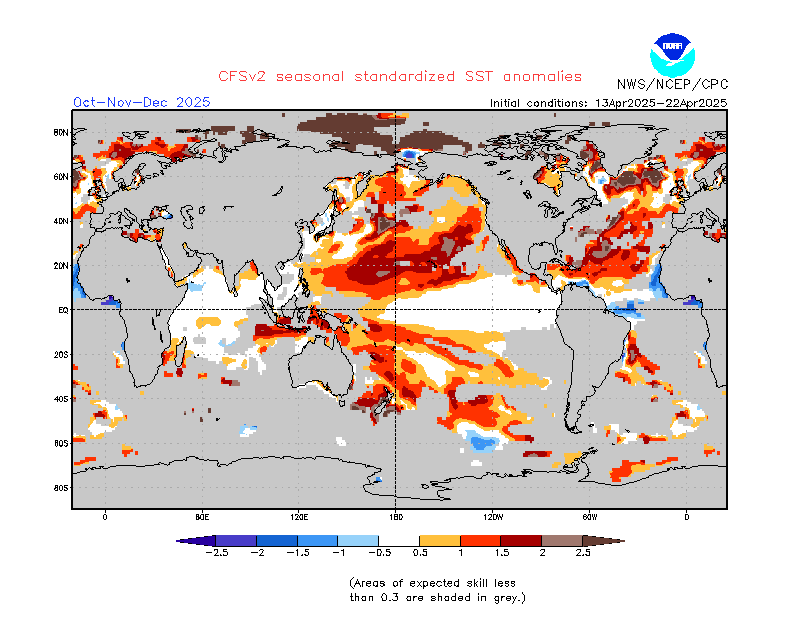 |  |
The key usually is the so-called cold tongue (shown in blue) extending west from Ecuador. Do not be fooled by the differences in how the two agencies use color (NOAA uses more bold colors) to show the Sea Surface Temperature Anomalies. Looking at the Nino 3.4 forecasts shown above these SST forecasts, we would not expect that the two Agencies would be viewing SSTA in a very similar way and in general they are not. I thought that SON and DJF 2018/2019 were more useful than the Summer since the two Agencies have no choice but to agree for the Summer as the Nino 3.4 Index changes slowly. NOAAA only shows out to OND 2018.
There is a difference in the forecast for ENSO beyond this Summer. NOAA shows pure ENSO Neutral and JAMSTEC shows some El Nino warming in the Eastern Equatorial Pacific. There are other subtle differences in these maps that impact the forecasts. But I do not see enough to explain the differences and NOAA wiith their maps has not fully revealed their thinking. They have made it clear that they need another month to make more sense out of this transition phase.
Updates from JAMSTEC can be found here. Updates from NOAA can be found here. You have to look for the SST row and go to the right where it says “normalized with mask” and click on E3 which provides the latest model run..
A. Focus on the NOAA Update
A note about terminology; the deviations from climatology/normal are color coded but also labeled “A” for more than (above) normal and “B” for less than (below) normal. The area designated EC means Equal Chances of being more or less than normal. JAMSTEC relies on their color coding. In my comments I have used EC to cover all the situations where a clear anomaly is not shown. So the words “warm”, “cool”, “wet”, “dry” should be generally interpreted as being relative to climatology/normal for that location and time of year.
First we will take a look at the NOAA Early Outlook for April 2018. It is called the Early Outlook because it will be updated at the end of March. Only the April Outlook will be updated at that time.
Temperature

Precipitation

We have nothing to compare these maps with as NOAA does not in their Update provide a forecast for each of the subsequent two months separate from their three-month forecast. Thus I do not have previously forecasted maps for May from the previous NOAA Report to compare against. And the current month is not over so we can not really compare the forecast for next month against the actual for this month. It is probably best to just try to understand what NOAA is trying to convey about May which can be summarized as for temperature, Alaska and the full latitude Southern Tier will be warmer than climatology and there is a small cool anomaly impacting Montana and North Dakota. With respect to precipitation, Alaska will be wet, CONUS east of the Mississippi will be wet, the North Central cool anomaly will be generally wet and there may be (some doubts cast by the Week 3 – 4 Forecast issued on Friday) a warm anomaly running southeast from the Northwest to Northwest Texas.
It is useful to see how the month forecast fits with the set of shorter forecasts that we have. Probably only the 8 – 14 and week 3-4 apply as the 6 – 10 falls within April (today) but it provides a segue to May.
First Temperature
 |  |  |
| The new monthly forecast is to the right. Does it appear to be reflective of the three parts of the month for which we have forecasts? → |
| ↑ ← The full month forecast seems to not fit very well with the 8- 14 day and the Week 3/4 forecast. But we do not have the last part of the month in the sequence of maps above. |
And then Precipitation
 |  |  |
| The new monthly forecast is to the right. Does it appear to be reflective of the three parts of the month for which we have forecasts? → | | ↑ ← The concatenation of the 8-14 Day and Week 3-4 Map seems to not fit well. But we do not have the last part of the month in the sequence of maps above. |
Now we consider the three-month Outlook.
Notice that the three-month periods are abbreviated e.g. April/May/June is shown as AMJ. You will see such abbreviations often in this report.
Prior Temperature Outlook for MJJ 2018

New Temperature Outlook for MJJ 2018

Prior Precipitation Outlook for MJJ 2018

New Precipitation Outlook for MJJ 2018

Now let us focus on the long-term situation and compare the new set of maps with the maps issued on April 19, 2018.
Prior 14 Month Temperature Outlook: MJJ 2018 – AMJ 2019

New 14 Month Temperature Outlook: JJA 2018 – MJJ 2019

To compare maps from one release to another, one needs to remember that the new release drops one three-month period and adds a later one. So to make the comparisons one has to shift the new maps to the right one position and that makes the map on the right drop down to become the left-most map in the next level. I do not have a computer software tool for doing that for you so you have to do it mentally. When I do the comparison, I print the two sets of maps and put them side by side and number the same three-month maps 1, 2, 3,…..,11 in both sets of maps to make it easier for me to easily compare the same three-month period in the new with the previous forecast. One uses the same procedure to compare the precipitation maps. Based on this procedure, I conclude that:
Now Precipitation
Prior 14 Month Precipitation Outlook: MJJ 2018 – AMJ 2019

New 14 Month Precipitation Outlook: JJA 2018 – MJJ 2019
If you want larger versions of each map (temperature and precipitation) you can find them here. And then each of those maps can be clicked on to further enlarge them.
Sometimes it is useful to compare the three-month outlook to the forecast for the first of the three months. It shows how much the pattern changes over the three-month period.

One can mentally subtract the First-Month Outlook from the Three-month Outlook and create the Outlook for the last two months in the three-month period.
*The concept is that the probabilities of a deviation from climatology in the First Month and the combined Month Two and Three forecast that one derives must average out to the probabilities shown in the three-month maps.
NOAA Discussion
Below are excerpts (significantly reorganized and with a lot of the redundancy and discussion of methodology removed) from the Discussion released by NOAA on April 19, 2018. Headings that are “Initial Cap” only rather than all caps were added by the Author of this Update Report for clarity. Also we have organized the sequence of the sections of NOAA Discussion to first present the Atmospheric and Oceanic Conditions and then the Initial Month, the Three-month period, and finally the remainder of the 15 Month Forecast. We think that sequence with the three- to four-month period broken out separately, makes the discussion more useful for more readers.
CURRENT ATMOSPHERIC AND OCEANIC CONDITIONS
ACCORDING TO THE ENSO DIAGNOSTIC DISCUSSION ISSUED APRIL 12, 2018, A LA NINA ADVISORY IS STILL IN EFFECT. LA NINA IS EXPECTED TO TRANSITION TO ENSO-NEUTRAL DURING APRIL-MAY, WITH ENSO-NEUTRAL THEN LIKELY (GREATER THAN 50% CHANCE) TO CONTINUE THROUGH BOREAL SUMMER 2018.
BELOW AVERAGE SEA SURFACE TEMPERATURES (SSTS) CONTINUED ACROSS MUCH OF THE CENTRAL AND EASTERN EQUATORIAL PACIFIC OCEAN, THOUGH THE NEGATIVE SST ANOMALIES ARE MODEST (-0.5C). THE VERY LATEST WEEKLY SST DEPARTURE VALUE FOR THE NINO-3.4 REGION IS -0.4C, UP SLIGHTLY FROM TWO WEEKS AGO. AS THE NEGATIVE SST ANOMALIES WERE WEAKENING NEAR THE SURFACE, THE SUB-SURFACE TEMPERATURES (50-250 METERS DEEP) OF THE EQUATORIAL CENTRAL AND EASTERN PACIFIC WARMED DUE TO THE EASTWARD PROPAGATION OF DOWNWELLING EQUATORIAL OCEANIC KELVIN WAVES. THE GREATEST POSITIVE TEMPERATURE ANOMALIES, +4 TO +6 DEG C, WERE LOCATED JUST EAST OF THE DATE LINE, AT A DEPTH OF ABOUT 150 METERS. INCIDENTALLY, CLOSE TO THE COAST OF SOUTH AMERICA, SUB-SURFACE TEMPERATURE ANOMALIES OF -1 TO -4 DEG C BELOW AVERAGE WERE OBSERVED. ALTHOUGH SOME OF THIS RELATIVELY COOL WATER AT DEPTH MAY BE ASSOCIATED WITH THE LAST VESTIGES OF LA NINA, IT APPEARS THAT EASTERLY OR NORTHEASTERLY TRADE WINDS ON A HIGHER-FREQUENCY TIME SCALE MAY BE THE MAIN DRIVER BEHIND THE UPWELLING IN THIS AREA.
OUTGOING LONGWAVE RADIATION (OLR) ANOMALIES AVERAGED OVER THE PAST MONTH DEPICT ENHANCED CONVECTION NORTHEAST OF AUSTRALIA ACROSS THE CORAL SEA (IN PART RELATED TO TROPICAL CYCLONE ACTIVITY), WHICH CONTINUES SOUTHEASTWARD ALONG THE GENERAL LOCATION OF THE SOUTH PACIFIC CONVERGENCE ZONE (SPCZ). OLR ANOMALIES WERE SLIGHTLY NEGATIVE OVER THE MARITIME CONTINENT REGION, AND MODERATELY POSITIVE NEAR THE DATE LINE, BOTH OF WHICH ARE CONSISTENT WITH A RESIDUAL LA NINA. DURING THE PAST 30-DAYS, NEAR-EQUATORIAL LOW-LEVEL (850-HPA) WIND ANOMALIES WERE WESTERLY NEAR AND JUST EAST OF THE MARITIME CONTINENT, AND EASTERLY NEAR AND EAST OF THE DATE LINE. AT UPPER-LEVELS (200-HPA), TWO LARGE CYCLONIC VORTICES STRADDLED THE EQUATOR OVER THE EASTERN PACIFIC. OVERALL, OCEANIC AND ATMOSPHERIC INDICATORS ARE CONSISTENT WITH A RESIDUAL LA NINA IN THE PROCESS OF TRANSITIONING TO ENSO-NEUTRAL.
OTHER FACTORS TO CONSIDER INCLUDE SOIL MOISTURE AND PRECIPITATION ANOMALIES. THE SOIL MOISTURE CHANGE MAP FOR THE PAST SEASON (FEBRUARY THROUGH MID-APRIL 2018) DEPICTS ANOMALOUSLY WET SOILS FROM EASTERN PORTIONS OF THE SOUTHERN GREAT PLAINS EASTWARD AND NORTHEASTWARD ACROSS THE SOUTHERN HALF OF THE MISSISSIPPI VALLEY, THE CENTRAL GREAT LAKES REGION, AND THE OHIO AND TENNESSEE VALLEYS. ANOMALOUSLY DRY SOILS ARE NOTED OVER THE SOUTH-CENTRAL GREAT PLAINS AND THE FLORIDA PENINSULA. THE PRECIPITATION ANOMALY PATTERN GENERALLY MIRRORS THE SOIL MOISTURE ANOMALY PATTERN FOR THE SAME PERIOD. FARTHER NORTH, SNOW COVER IS STILL A CONCERN FOR PARTS OF THE DAKOTAS, MINNESOTA, WISCONSIN, NORTHERN IOWA AND MICHIGAN, ESPECIALLY AFTER THE RECENT SNOWSTORM WHICH DEPOSITED UP TO 20 INCHES OF SNOW IN THE TWIN CITIES AREA OF MINNEAPOLIS-ST. PAUL.
PROGNOSTIC DISCUSSION OF SST FORECASTS
THE CPC SST CONSOLIDATION (CON) FORECAST FOR THE NINO 3.4 REGION PREDICTS A SLOW, GRADUAL INCREASE IN ANOMALY VALUES FROM ABOUT -0.5C TO +0.4C OVER THE NEXT SIX MONTHS OR SO, PEAKING AT A MAXIMUM SST ANOMALY OF +0.6C (JUST INSIDE WEAK EL NINO TERRITORY) BY NDJ 2018/19. THE CON CLOSELY PARALLELS THE CFS SST ANOMALY FORECAST THROUGH OND 2018. SOME OF THE INPUTS TO THE CON FORECAST, SUCH AS THE CCA AND THE CONSTRUCTED ANALOG (CA), PREDICT SOLUTIONS THAT ARE SOMEWHAT COOLER AND WARMER (RESPECTIVELY) THAN THE CON. THE CPC-IRI CONSENSUS PREDICTS THE PROBABILITY FOR ENSO-NEUTRAL TO REACH A PEAK OF 70% IN MJJ, GRADUALLY DECLINING THROUGHOUT THE SUMMER AND AUTUMN TO ABOUT 40% BY NDJ 2018/19. IN CONTRAST, THE PROBABILITY OF AN EL NINO STARTS OFF NEAR 10% IN MJJ, AND STEADILY RISES TO JUST UNDER 50% BY NDJ 2018/19. IT IS DURING THE OND SEASON THAT THE CHANCES OF AN EL NINO EXCEED THOSE OF A NEUTRAL EVENT. CHANCES FOR A LA NINA DROP RAPIDLY FROM JUST UNDER 20% IN MJJ TO 10-15% IN JJA, AND CONTINUE AT THAT REDUCED LEVEL THROUGHOUT THE SUMMER AND AUTUMN MONTHS. THE NMME AND IMME SST PLUMES FORECAST SST ANOMALIES TO RISE FROM ABOUT -0.5C THROUGH NEUTRAL TERRITORY (-0.49 TO +0.49), EVENTUALLY REACHING THE MINIMAL THRESHOLD FOR EL NINO (+0.5C) BY SEPTEMBER AND OCTOBER, RESPECTIVELY. THE ECMWF SST ANOMALY FORECAST, WHICH USES A 51-MEMBER ENSEMBLE, IS THE WARMEST OF ALL SOLUTIONS, WITH ALL 51 MEMBERS FORECASTING AT LEAST POSITIVE SST ANOMALIES FOR THE NINO 3.4 REGION BY OCTOBER, AND MOST OF THOSE MEMBERS BEING CONSIDERABLY WARMER AND MORE BULLISH FOR A EL NINO. SOME MEMBERS REACH THE NOMINAL EL NINO THRESHOLD AS EARLY AS JULY.
PROGNOSTIC TOOLS USED FOR U.S. TEMPERATURE AND PRECIPITATION OUTLOOKS
THE FIRST FEW LEADS OF THE CURRENT SUITE OF SEASONAL TEMPERATURE OUTLOOKS ARE SLIGHTLY COOLER OVER THE MIDSECTION OF THE CONUS COMPARED TO THE SET OF OUTLOOKS ISSUED LAST MONTH, WHICH IS CONSISTENT WITH SLIGHTLY INCREASED ODDS OF AN EL NINO. INITIALLY, A SMALL AREA OF BELOW NORMAL TEMPERATURES WAS FORECAST OVER PART OF THE NORTH-CENTRAL CONUS IN JJA AND JAS, BUT THIS FORECAST WAS DEEMED UNLIKELY TO VERIFY IN THE ABSENCE OF A PRONOUNCED WET SIGNAL IN THIS SAME AREA. FOR THE MJJ-ASO SEASONS, ENSO-NEUTRAL CONDITIONS ARE EXPECTED TO DOMINATE, WITH A SLIGHTLY INCREASING INFLUENCE FROM A POTENTIAL INCIPIENT EL NINO. THE POSSIBLE IMPACTS OF AN EL NINO ARE WEIGHTED A BIT MORE FOR THE SON 2018 TO MAM 2019 SEASONS. THOUGH WE APPEAR HEADED TOWARD A COLD-SEASON EL NINO, THERE HAVE BEEN SEVERAL FALSE STARTS IN RECENT YEARS WHERE PROMISING EL NINOS SIMPLY FADED AWAY. IT IS TOO EARLY IN THE CALENDAR YEAR TO PREDICT A FULL-FLEDGED EL NINO AT THIS TIME, SO FOR THIS PARTICULAR SET OF OUTLOOKS, WE CONSERVATIVELY INTRODUCE POTENTIAL EL NINO INFLUENCES LATER THIS SUMMER, AND ASSUME A WEAK EL NINO DURING THE UPCOMING WINTER SEASON 2018-19. MODELS AND TOOLS USED IN THE CONSTRUCTION OF THESE SEASONAL OUTLOOKS INCLUDE BIAS-CORRECTED AND CALIBRATED MODEL OUTPUT FROM THE NMME DYNAMICAL MODEL SUITE, THE IMME, CFS, CON, AND THE CONSTRUCTED ANALOG WHICH INCORPORATES PACIFIC SST INFORMATION (CA-SST). A BASELINE TOOL THAT COMBINES THE INFLUENCES OF ENSO AND DECADAL TEMPERATURE AND PRECIPITATION TRENDS ANCHORED TO THE CPC NINO 3.4 SST CON FORECAST (ENSO-OCN TOOL) WAS HEAVILY RELIED UPON DURING LEADS 5-11 (SON 2018 THROUGH MAM 2019). FOR LEADS 12-13 (AMJ AND MJJ 2019), DECADAL TRENDS IMPLICIT IN THE CON TOOL WERE USED.
30-DAY OUTLOOK DISCUSSION FOR MAY 2018
THE MAY 2018 IS ISSUED AGAINST THE BACKDROP OF A TRANSITIONING ENSO STATE (TO ENSO-NEUTRAL) AND FOLLOWING A PROLONGED STRETCH (INCLUDING FORECASTS THAT EXTEND THROUGH THE END OF APRIL) OF BELOW-NORMAL TEMPERATURES ACROSS MANY PARTS OF THE CONUS. AS WITH ANY CLIMATE FORECAST, WE MUST BE COGNIZANT OF LONG-TERM TRENDS; BOTH A 15-YEAR OCN AND A LEAST-SQUARES LINEAR FIT REVEAL STRONG WARMING TRENDS ACROSS THE SOUTHERN AND EASTERN CONUS DURING LATE SPRING AND EARLY SUMMER. SLIGHTLY NEGATIVE TEMPERATURE TRENDS ARE OBSERVED FOR A SMALL PORTION OF THE NORTHERN HIGH PLAINS AND NORTHERN ROCKIES. PRECIPITATION TRENDS ARE NOT NEGLIGIBLE THIS TIME OF YEAR EITHER; AN INCREASING (DECREASING) TREND IN LATE SPRING AND EARLY SUMMER PRECIPITATION HAS BEEN OBSERVED ACROSS MUCH OF THE NORTHERN AND EASTERN CONUS (SOUTHWESTERN CONUS). THESE LONG-TERM TRENDS FORM THE STARTING POINT FOR THE MAY 2018 OUTLOOK, AT WHICH POINT WE CONSIDER SUBSEASONAL TO SEASONAL CLIMATE VARIABILITY, INCLUDING ENSO, SOIL MOISTURE, AND VARIOUS STATE-OF-THE-ART DYNAMICAL MODEL FORECASTS.
THE TEMPERATURE OUTLOOK IS CONSTRUCTED WITH THE AFOREMENTIONED TRENDS IN MIND, BUT TWEAKED COLDER ACROSS PARTS OF THE EAST-CENTRAL CONUS CENTERED ON THE MISSISSIPPI RIVER. THIS IS DUE TO VERY HIGH SOIL MOISTURE CONTENT AND THE LATEST MODEL GUIDANCE FROM THE NMME AND ECMWF. OVER THE MID-ATLANTIC AND NORTHEAST THE OBJECTIVE GUIDANCE, TAKEN IN ITS ENTIRETY, STILL EXHIBITS A SLIGHT TILT TOWARD ABOVE-NORMAL TEMPERATURES DESPITE DYNAMICAL MODEL WEEK 3-4 GUIDANCE, FOR EXAMPLE, THAT TILTS COLD THROUGH THE FIRST HALF OF MAY. PROBABILITIES FAVORING ABOVE-NORMAL TEMPERATURES ARE HIGHEST OVER THE SOUTHWEST, WHERE LONG-TERM TRENDS, NEGATIVE SOIL MOISTURE ANOMALIES, LAGGED ENSO REGRESSIONS, AND DYNAMICAL MODEL GUIDANCE ARE ALL IN AGREEMENT. OVER THE NORTHERN HIGH PLAINS, A SIMILAR ALIGNMENT OF GUIDANCE POINTS MORE TOWARD BELOW-NORMAL TEMPERATURES. THERE IS BROAD CONSENSUS FAVORING ABOVE-NORMAL TEMPERATURES FOR ALASKA, WITH THE HIGHEST PROBABILITIES NEAR THE NORTHERN AND WESTERN COASTS, WHERE ICE BREAKUP IS LIKELY TO OCCUR EARLIER THAN NORMAL.
THE PRECIPITATION OUTLOOK IS CONSTRUCTED IN SIMILAR FASHION TO THE TEMPERATURE OUTLOOK, STARTING WITH LONG-TERM TRENDS AND ADJUSTING FOR SUBSEASONAL TO SEASONAL VARIABILITY MANIFEST IN EITHER STATISTICAL OR DYNAMICAL GUIDANCE. LAGGED ENSO REGRESSIONS AND THE PREPONDERANCE OF DYNAMICAL GUIDANCE CONSTRUCTIVELY INTERFERE WITH LONG-TERM TRENDS OVER MUCH OF THE WEST, SO BELOW-NORMAL PRECIPITATION IS MODESTLY FAVORED FOR PARTS OF THE WEST EXTENDING FROM THE NORTHWEST COAST SOUTHEASTWARD TO PARTS OF THE SOUTHERN HIGH PLAINS. ABOVE-NORMAL PRECIPITATION IS FAVORED SLIGHTLY OVER THE NORTHERN HIGH PLAINS WHERE LONG-TERM TRENDS ARE FAIRLY STRONG, AND CALIBRATED GUIDANCE FROM THE NMME HAS A COHERENT WET SIGNAL. OVER THE EASTERN CONUS THERE ARE SOME CONFLICTING SIGNALS, BUT THE MAJORITY OF FORECAST GUIDANCE, INCLUDING THE NMME, LONG-TERM TRENDS, AND THE ECWMF, TILTS SLIGHTLY TOWARD ABOVE-NORMAL PRECIPITATION. THE VARIOUS TOOLS ARE IN QUITE GOOD AGREEMENT OVER ALASKA, BROADLY FAVORING ABOVE-NORMAL PRECIPITATION, WITH THE BEST ODDS IN SOUTHWESTERN ALASKA.
Three Months May-June-July (MJJ) 2018
Temperature
THE TEMPERATURE OUTLOOK FOR MJJ FAVORS ABOVE NORMAL TEMPERATURES OVER MUCH OF THE CONUS, AND ALL OF ALASKA. THIS IS SUPPORTED BY SUCH TOOLS AS THE ENSO-OCN TOOL, SST-CA, CALIBRATED NMME, AND CON. THE HIGHER PROBABILITIES FOR ABOVE NORMAL TEMPERATURES ACROSS THE SOUTHWEST AND NORTHEAST REFLECT HISTORICAL TRENDS. FOR THE NORTH-CENTRAL CONUS, EC IS CONSIDERED THE BEST CATEGORY, SUPPORTED BY THE CON, IMME, CA-SST, ENSO-CON, AND THE TRADITIONAL STATISTICAL TOOLS (SMLR, CCA, AND OCN). THE IDEA OF THE NORTH-CENTRAL CONUS BEING SLIGHTLY COOLER THAN ITS SURROUNDINGS IS A NOD IN THE DIRECTION OF THE EARLY STAGES OF A POTENTIAL EL NINO. AS ALLUDED TO EARLIER,
THE MAY-JUN-JUL (MJJ) 2018 TEMPERATURE OUTLOOK FAVORS ABOVE NORMAL TEMPERATURES OVER MUCH OF THE CONTIGUOUS UNITED STATES (CONUS), THE EXCEPTION BEING THE VICINITY OF THE NORTHERN GREAT PLAINS AND UPPER MISSISSIPPI VALLEY, WHERE EQUAL CHANCES (EC) OF BELOW, NEAR, AND ABOVE NORMAL TEMPERATURES ARE FAVORED. THE GREATEST PROBABILITIES REACH OR EXCEED 60% ACROSS PORTIONS OF THE SOUTHWEST. PROBABILITIES REACH OR EXCEED 50% OVER THE NORTHEAST. ABOVE NORMAL TEMPERATURES ARE ALSO FAVORED FOR ALL OF ALASKA, WITH MAXIMUM PROBABILITIES REACHING OR EXCEEDING 50% OVER MUCH OF THE NORTH SLOPE, THE EXTREME WESTERN PARTS OF THE STATE, THE ALASKA PENINSULA, AND THE EASTERN ALEUTIANS.
Precipitation
THE PRECIPITATION OUTLOOK FOR MJJ DEPICTS ENHANCED ODDS OF ABOVE NORMAL PRECIPITATION FOR MOST OF MAINLAND ALASKA, THE ALASKA PENINSULA, AND THE ALEUTIANS, WITH PROBABILITIES REACHING OR EXCEEDING 50% IN THE VICINITY OF THE SEWARD PENINSULA. ABOVE NORMAL PRECIPITATION IS ALSO FAVORED FOR THE GREAT LAKES REGION, THE NORTHEAST, MID-ATLANTIC, AND MOST OF THE OHIO VALLEY. THESE WET ANOMALIES ARE SUPPORTED (TO VARYING DEGREES) BY THE CA-SST, SMLR, OCN, CFS, CALIBRATED NMME, IMME, CON, CALIBRATED COMPONENT OF THE CBAM, AND ESPECIALLY THE ENSO-OCN TOOL. BELOW NORMAL PRECIPITATION IS FAVORED FROM ABOUT THE EASTERN FOOTHILLS OF THE NORTHERN AND CENTRAL ROCKIES WESTWARD TO THE PACIFIC COAST, AS FAR SOUTH AS CENTRAL CALIFORNIA. THIS DRY ANOMALY ALSO DRAWS MUCH OF ITS SUPPORT FROM THE ENSO-OCN TOOL, CCA, OCN, CFS, CALIBRATED NMME, IMME, AND CON. THE ENSO-OCN TOOL, IN PARTICULAR, REVEALS THE SIGNIFICANT CONTRIBUTIONS FROM THE ENSO PHASE AND DECADAL TRENDS IN THE MJJ PRECIPITATION FORECAST.
THE MJJ 2018 PRECIPITATION OUTLOOK FAVORS ABOVE NORMAL PRECIPITATION OVER MOST OF MAINLAND ALASKA, THE ALASKA PENINSULA AND ALEUTIANS, AND OVER THE GREAT LAKES REGION, NORTHEAST, MID-ATLANTIC, AND MOST OF THE OHIO VALLEY. PROBABILITIES REACH OR EXCEED 50% ACROSS THE VICINITY OF THE SEWARD PENINSULA IN WESTERN ALASKA. BELOW NORMAL PRECIPITATION IS FAVORED FROM THE EASTERN FOOTHILLS OF THE NORTHERN AND CENTRAL ROCKIES WESTWARD TO THE PACIFIC COAST ABOUT AS FAR SOUTH AS CENTRAL CALIFORNIA.
EQUAL CHANCES (EC) ARE FORECAST IN AREAS WHERE CLIMATOLOGICAL PROBABILITIES ARE INDICATED FOR SEASONAL MEAN TEMPERATURES AND SEASONAL ACCUMULATED PRECIPITATION AMOUNTS.
PROGNOSTIC DISCUSSION OF OUTLOOKS – MJJ 2018 TO MJJ 2019 with a focus on the months beyond MJJ.
TEMPERATURE
SEVERAL TOOLS PREDICTED BELOW NORMAL TEMPERATURES ACROSS PORTIONS OF THIS REGION NOT ONLY DURING MJJ, BUT ALSO JJA AND JAS. ONE OF THE BIGGEST PROPONENTS FAVORING ANOMALOUS COLD (ESPECIALLY IN JJA) IS THE BRIDGED COMPONENT OF THE CBAM TOOL, WHICH OVERWHELMS THE MINOR CONTRIBUTION FROM THE WARMER CALIBRATION COMPONENT IN THIS AREA. THE PRIMARY REASON FOR NOT FORECASTING BELOW NORMAL TEMPERATURES IN THIS AREA IS THE ANTICIPATED LACK OF A PRONOUNCED WET SIGNAL IN THIS SAME GENERAL REGION, WHICH MAKES THE FORECAST FOR ANOMALOUS COLD MUCH LESS LIKELY. FOR JJA AND JAS, THE MAIN DIFFERENCE COMPARED WITH MJJ IS THE EXPECTED INCREASE IN COVERAGE OF EC ACROSS THE CENTRAL STATES, DUE IN PART TO THE BRIDGED COMPONENT OF THE CBAM TOOL AS NOTED PREVIOUSLY, AND ALSO THE UNCERTAINTY REGARDING THE POTENTIAL UPCOMING WARM PHASE OF ENSO. BY ASO, THIS LARGE REGION OF PREDICTED EC IS FORECAST TO DIMINISH SIGNIFICANTLY IN SIZE. THE OUTLOOKS FROM SON 2018 THROUGH MAM 2019 ARE TILTED IN THE DIRECTION OF A WEAK EL NINO, AND ARE BASED HEAVILY ON THE ENSO-OCN TOOL. ABOVE NORMAL TEMPERATURES ARE FAVORED ACROSS THE ENTIRE CONUS IN SON, WITH AN INCREASE IN UNCERTAINTY (EXPRESSED AS EC) ACROSS PORTIONS OF THE SOUTHEAST AND PACIFIC NORTHWEST IN OND. THE EXPECTED COVERAGE OF EC INCREASES DURING NDJ, DJF, AND JFM OF NEXT YEAR. BY JFM, ANOMALOUS WARMTH IS FAVORED FOR APPROXIMATELY THE WESTERN HALF OF THE CONUS, WITH EC PREDICTED ELSEWHERE. BY FMA, ANOMALOUS WARMTH IS FORECAST TO EXPAND ACROSS THE SOUTHEASTERN QUARTER OF THE CONUS, AND CONTINUE EXPANDING ACROSS THE MID-ATLANTIC, NORTHEAST, AND EASTERN GREAT LAKES REGION DURING MAM 2019. THE ONLY AREA OF PREDICTED EC IS AGAIN LOCATED OVER THE NORTH-CENTRAL STATES BY THIS TIME. FOR THE FINAL TWO SEASONS (AMJ AND MJJ 2019), HISTORICAL TRENDS IMPLICIT IN THE CON TOOL ARE THE PRIMARY FORECAST TOOL, PRODUCING AN OVERALL TEMPERATURE PATTERN SIMILAR TO MAM. THE DIFFERENCE IS THAT WARMING TREND SIGNALS BECOME STRONGER IN PARTS OF THE EASTERN AND SOUTHERN CONUS, WARRANTING HIGHER PROBABILITIES FOR ABOVE NORMAL TEMPERATURES. IN ALASKA DURING SON, NEARLY ALL TOOLS AGREED ON ABOVE NORMAL TEMPERATURES, WITH THE HIGHEST PROBABILITIES OVER NORTHERN AND WESTERN PORTIONS OF THE STATE ATTRIBUTED TO EARLIER-THAN-NORMAL BREAKUP OF SEA ICE, AND RELATIVELY WARM SSTS (ESPECIALLY NEAR THE SOUTHWEST COAST). SEA ICE TRENDS RELATED TO THE DELAYED ONSET OF SEA ICE IN RECENT YEARS IS THE DRIVING FACTOR BEHIND PROBABILITIES FOR ABOVE NORMAL TEMPERATURES REACHING OR EXCEEDING 60 PERCENT ACROSS THE NORTH SLOPE IN SON, AND AT LEAST 50% IN OND. DECADAL TEMPERATURE TRENDS PLAY A LARGE ROLE FOR THE 49TH STATE THROUGHOUT THE WINTER AND SPRING SEASONS.
PRECIPITATION
FOR JJA AND JAS, THESE THREE PRECIPITATION ANOMALIES CONTINUE, THOUGH VARY IN SPATIAL COVERAGE. IN ADDITION, THERE ARE ELEVATED CHANCES FOR WETTER-THAN-NORMAL CONDITIONS IN NEW MEXICO AND THE FLORIDA PENINSULA (JJA), AND FOR MOST OF THE FOUR CORNERS REGION AND THE FLORIDA PENINSULA IN JAS. WELL BELOW NORMAL WINTER SNOWPACK ACROSS MOST OF THE FOUR CORNERS REGION TENDS TO FAVOR THE EARLY ONSET OF THE SOUTHWEST MONSOON. SOME TOOLS, SUCH AS THE CA-SST, SMLR, OCN, CBAM, IMME, FORECAST (TO VARYING DEGREES), ABOVE NORMAL PRECIPITATION IN THE MONSOON REGION DURING JJA AND JAS. THE CFS IS BULLISH ON ITS PREDICTION OF AN ACTIVE MONSOON, BUT SKILL MAPS THAT TAKE INTO ACCOUNT PRIOR PERFORMANCE DO NOT SUPPORT THIS SCENARIO. IN ADDITION, THE ENSO-OCN TOOL DOES NOT PREDICT ANY SUBSTANTIAL SIGNAL FOR AN ACTIVE MONSOON SEASON. THE FLORIDA PENINSULA WET SIGNAL DRAWS ITS SUPPORT FROM THE CA-SST, CON, AND THE ENSO-OCN. THE CFS AND CALIBRATED NMME PROVIDE, AT BEST, MARGINAL SUPPORT FOR THIS WET SIGNAL. BY ASO, ONLY THE NORTHEAST/MID-ATLANTIC COAST AND ALASKA WET SIGNALS REMAIN, WITH THE FORMER DISAPPEARING BY SON, AND THE LATTER DISAPPEARING BY OND. WITH SIGNIFICANT UNCERTAINTY REGARDING THE ENSO PHASE DURING THIS UPCOMING COLD SEASON, IT WAS DECIDED TO GO WITH EC FOR ALL AREAS. THIS WILL LIKELY CHANGE OVER THE NEXT FEW MONTHS, AS THE NEW ENSO PHASE BECOMES BETTER ESTABLISHED. BY NEXT SPRING (AMJ & MJJ 2019), HISTORICAL TRENDS BEGIN TO FAVOR WETNESS ACROSS THE GREAT LAKES REGION AND NORTHEAST, BUT THEY ARE FAIRLY WEAK AND NOT INCORPORATED INTO THIS SET OF SEASONAL OUTLOOKS.
B. Now we begin our comparison of the NOAA and JAMSTEC Forecasts (Focus on next nine months i.e. three seasons)
In this Update, we compare the JAMSTEC temperature and precipitation forecast maps, which are for the World, with the NOAA temperature and precipitation forecast maps that cover only CONUS and Alaska. We do this primarily for educational purposes.
JAMSTEC works in three-month intervals which correspond to seasons and does not change the selection of months each time they update but does so every three months. At that time they drop one season and add another season further in the future. So for JAMSTEC we now have Summer (JJA), Fall (SON) and Winter (DJF) to work with and we have the corresponding maps from NOAA except that NOAA has also issued a MJJ map. We decided to match the JAMSTEC seasons with the corresponding NOAA maps. It is not ideal to not be able to compare the MJJ forecasts but JAMSTEC only provides three sets of maps and they only change every three months.
I show the NOAA Maps first followed by the JAMSTEC maps. I extract North America from the Worldwide JAMSTEC map and use that to compare with the NOAA Maps. I also extract Europe including parts of North Africa and Western Asia from the Worldwide JAMSTEC maps and include those excerpted maps in the summary table at the beginning of this article.
Summer (JJA)
Temperature
NOAA
And here is the JJA 2018 temperature forecast for North America that I extracted from the JAMSTEC World Forecast.
| ||
And now the JAMSTEC WORLD FORECAST (for this graphic my comments are mostly related to areas other than Alaska and CONUS as those comments appear with the larger graphics above)

Precipitation
NOAA
And here is the JJA 2018 Precipitation Forecast for North America that I extracted from the JAMSTEC World Forecast.
JAMSTEC WORLD FORECAST

Of interest, Europe is dry. India and most of Southeast Asia are wet. Australia is dry.
Here is the precipitation forecast from Queensland Australia:
It is kind of amazing that you can make a worldwide forecast based on just one parameter the SOI and changes in the SOI. Basically it is an ENSO forecast just considering the state of ENSO as measured by the SOI. Western CONUS looks fairly wet, Northern Africa is dry.
SON (Fall)
Temperature
NOAA
And here is the SON 2018 Temperature Forecast for North America that I extracted from the JAMSTEC World Forecast.
| ||
JAMSTEC WORLD FORECAST

Precipitation
NOAA
And here is the SON 2018 Precipitation Forecast for North America that I extracted from the JAMSTEC World Forecast.
JAMSTEC WORLD FORECAST

DJF 2018/2019 (Winter)
Temperature
NOAA
And here is the DJF 2018/2019 Temperature Forecast for North America that I extracted from the JAMSTEC World Forecast.
| ||
JAMSTEC WORLD FORECAST

The cool areas are Central Siberia and Southeast Asia. Northeast Canada is also cool. Brazil is also mostly cool.
Precipitation
NOAA
And here is the DJF 2018/2019 Precipitation Forecast for North America that I extracted from the JAMSTEC World Forecast
JAMSTEC WORLD FORECAST

C. An analysis of the forecasts for ENSO by NOAA and JAMSTEC and others including the Australian Bureau of Meteorology
A major driver of weather is Surface Ocean Temperatures. Evaporation only occurs from the Surface of Water. So we are very interested in the temperatures of water especially when these temperatures deviate from seasonal norms thus creating an anomaly. The geographical distribution of the anomalies is very important. To a substantial extent, the temperature anomalies along the Equator have disproportionate impact on weather so we study them intensely and that is what the ENSO (El Nino – Southern Oscillation) cycle is all about. Subsurface water can be thought of as the future surface temperatures. They may have only indirect impacts on current weather but they have major impacts on future weather by changing the temperature of the water surface. Winds and Convection (evaporation forming clouds) is weather and is a result of the Phases of ENSO and also a feedback loop that perpetuates the current Phase of ENSO or changes it. That is why we monitor winds and convection along or near the Equator especially the Equator in the Eastern Pacific.
Since we are in ENSO Neutral at this point and that is not likely to change very much, we are abbreviating this section of the report this month.
Starting with Surface Conditions.
TAO/TRITON GRAPHIC (a good way of viewing data related to the part of the Equator and the waters close to the Equator in the Eastern Pacific where we monitor to determine the current phase of ENSO. It is probably not necessary in order to follow the discussion below, but here is a link to TAO/TRITON terminology.
Here is the current version of the TAO/TRITON Graphic. The top part shows the actual temperatures, the bottom part shows the anomalies i.e. the deviation from normal.

Location Bar for Nino 3.4 Area Above and Below
| ———————————————— | A | B | C | D | E | —————– |
Now let us look at the subsurface.
Now for a more detailed look. Below is the pair of graphics that I regularly provide. The date shown is the midpoint of a five-day period with that date as the center of the five-day period. The bottom graphic shows the absolute values, the upper graphic shows anomalies compared to what one might expect at this time of the year in the various areas both 130E to 90W Longitude and from the surface down to 450 meters. At different times I have discussed the difference between the actual values and the deviation of the actual values from what is defined as current climatology (which adjusts every ten years except along the Equator where it is adjusted every five years) and how both measures are useful for other purposes.
| There is neutral water from the Dateline to 110W and spotty but colder to the east. We now have warm water with a maximum anomaly of +4C developing west of the Dateline and crossing the Dateline at depth to 110W, the result of another Down-welling Kelvin Wave: Wave #2. La Nina is over but its demise is not yet acknowledged by NOAA. |
 |
| The 28C Isotherm is at the Dateline, the 27C Isotherm is at 160W, the 25C Isotherm is now at100W and in many places at the surface further east. The 20C Isotherm is no longer close to reaching the surface. |
The flattening of the Isotherm Pattern is an indication of ENSO Neutral just as the steepening of the pattern indicates La Nina or El Nino depending on where the slope shows the warm or cool pool to be. That flattening has occurred and we have gone to an ENSO Neutral thermocline.
Tracking the change.
 |  |
I have “frozen” the graphic on the left side above which shows the situation as reported for September 15, 2017. The one on the right which is the current situation. The situation with the cool anomaly is now much different east of the Dateline from the situation as reported for September 15, 2017. The cool pool is much reduced in size. To the west we have the second Down-welling Kelvin Wave. It will erupt to the surface soon if it has not already started to do so.
A major driver of weather is Surface Ocean Temperatures. Evaporation only occurs from the Surface of Water. So we are very interested in the temperatures of water especially when these temperatures deviate from seasonal norms thus creating an anomaly. The geographical distribution of the anomalies is very important. To a substantial extent, the temperature anomalies along the Equator have disproportionate impact on weather so we study them intensely and that is what the ENSO (El Nino – Southern Oscillation) cycle is all about. Subsurface water can be thought of as the future surface temperatures. They may have only indirect impacts on current weather but they have major impacts on future weather by changing the temperature of the water surface. Winds and Convection (evaporation forming clouds) is weather and is a result of the Phases of ENSO and also a feedback loop that perpetuates the current Phase of ENSO or changes it. That is why we monitor winds and convection along or near the Equator especially the Equator in the Eastern Pacific.
It can be useful to “integrate” the subsurface temperature Anomalies (to reflect the average value of the anomaly for the various subsurface layers and averaging it over the Central and Eastern Pacific) and this is shown next.

The discussion in this slide says it better than I could. One might compare the current reading to Oct/Nov 2017. The anomaly had returned to zero then reversed for a month and then returned to zero and now has gone positive. In retrospect it was the Kelvin Wave (#1) Activity the Upwelling Phase and the MJO which caused the brief reversal of the warming trend. Kelvin Wave #2 has made the average anomaly now a positive number not a negative number..
A side by side comparison can be useful
| Comparison Week Probably Third Week of December 2017 | Current Week |
|  |

This graphic provides both a summary perspective and a history (small images on the right) of the graphic presented earlier that shows the subsurface.
.
There is essentially no cold water left at the surface (west of 120W) and no cold water at depth to reinforce the surface. The La Nina is gone but still being reported by NOAA (but Australia has declared the La Nina to be over). But at the same time the Indo-Pacific Warm Pool is showing to be a lot more robust. So we are headed for an extended period of being either borderline El Nino or Neutral. The chances of a minor short El Nino or Neutral with a warm bias are increasing. Notice the warm anomaly from the west extends at depth now to beyond 120W. So this former La Nina is being attacked from below from the west. To me the Indo-Pacific warm pool moving east is not enough warm water to flip the switch to an El Nino but only to Neutral. There is still a small amount of cool water east of 120W but this does not record in the Nino 3.4 Measurement Area.
Anomalies are strange. You can not really tell for sure if the blue area is colder or warmer than the water above or below. All you know is that it is cooler than usual for this time of the year. A later graphic will provide more information. Aside from buoyancy the currents tend to bring water from that depth up to the surface mostly farther east. These currents are very complicated and made even more so by the uneven nature of the ocean floor. So the exact pattern of where this warm water will erupt is beyond my level of understanding. But it will erupt to the surface in multiple different places.
How does this translate into Index readings?
Here are two sets of estimates on the Nino 3.4 Index.
This graphic shows a fairly long history of weekly values of the index and is easy to read.

You can see that this is a double dip La Nina (with the second dip being deeper than the first hence the Southern Tier drought). You can also see that it has turned up and no longer is cooler than -0.5C.
Here is the current readings by NOAA of Nino 3.4 and three other related indices with the recent history shown on the right.

How about forecasts?
Here is the NOAA primary forecast model. I have drawn in the +0.5C and – 0.5C lines.

It indicates that we are no longer in the La Nina Phase and the forecasts calls for ENSO to remain in the Neutral Phase through the end of the year.
And here is another approach by IRI International Research Institute for Climate and Society which is a contractor to NOAA.

If you look at the midpoint of the AMJ forecast, it suggests that ENSO Neutral is strongly favored for May..

Not much change since the prior forecast earlier this month. One wonders why NOAA insists on characterizing the current situation as a La Nina.
IRI Technical ENSO Update
Published: April 19, 2018
Note: The SST anomalies cited below refer to the OISSTv2 SST data set, and not ERSSTv4. OISSTv2 is often used for real-time analysis and model initialization, while ERSSTv4 is used for retrospective official ENSO diagnosis because it is more homogeneous over time, allowing for more accurate comparisons among ENSO events that are years apart. During ENSO events, OISSTv2 often shows stronger anomalies than ERSSTv4, and during very strong events the two datasets may differ by as much as 0.5 C. Additionally, the ERSSTv4 may tend to be cooler than OISSTv2, because ERSSTv4 is expressed relative to a base period that is updated every 5 years, while the base period of OISSTv2 is updated every 10 years and so, half of the time, is based on a slightly older period and does not account as much for the slow warming trend in the tropical Pacific SST.
Recent and Current Conditions
In mid-April 2018, the NINO3.4 SST anomaly was at the level of warm-neutral to borderline La Niña. For March the SST anomaly was -0.73 C, indicating weak La Niña, and for January-March it was -0.79 C, also in that range. The IRI’s definition of El Niño, like NOAA/Climate Prediction Center’s, requires that the SST anomaly in the Nino3.4 region (5S-5N; 170W-120W) exceed 0.5 C. Similarly, for La Niña, the anomaly must be -0.5 C or less. The climatological probabilities for La Niña, neutral, and El Niño conditions vary seasonally, and are shown in a table at the bottom of this page for each 3-month season. The most recent weekly anomaly in the Nino3.4 region was -0.4, showing warm-neutral conditions. However, the pertinent atmospheric variables, including the lower level zonal wind anomalies, the Southern Oscillation Index and the anomalies of outgoing longwave radiation (convection), continue showing patterns suggestive of La Niña. On the other hand, subsurface temperature anomalies across the eastern equatorial Pacific have warmed to moderately above-average, suggesting that the dissipation of the La Niña is imminent, if not occurring right now. Given the current and recent SST anomalies, the subsurface profile and the conditions of most key atmospheric variables, it appears we are currently in transition from weak La Niña to neutral, ending the weak-to-moderate La Niña of 2017-18.
Expected Conditions
What is the outlook for the ENSO status going forward? The most recent official diagnosis and outlook was issued approximately one week ago in the NOAA/Climate Prediction Center ENSO Diagnostic Discussion, produced jointly by CPC and IRI; it stated that the La Niña is likely to transition to ENSO-neutral during the March-May season. A La Niña Advisory was once again issued with that Discussion. The latest set of model ENSO predictions, from mid-April, now available in the IRI/CPC ENSO prediction plume, is discussed below. Those predictions also suggest that the SST is likely to return to neutral during within the March-May season.
As of mid-March, more than 90% of the dynamical or statistical models predict neutral conditions for the initial Apr-Jun 2018 season, with less than 10% showing a continuation of La Niña conditions. Over the course of the rest of 2018, probabilities for neutral remain greater than 50% through Sep-Nov, after which probabilities for El Niño rise to over 60% for Oct-Dec and over 70% for Nov-Jan and Dec-Feb 2018-19. At lead times of 3 or more months into the future, statistical and dynamical models that incorporate information about the ocean’s observed subsurface thermal structure generally exhibit higher predictive skill than those that do not. For the Jul-Sep 2018 season, among models that do use subsurface temperature information, 65% of models predicts neutral conditions and 35% predict El Niño conditions. For all models, predictions for La Niña probabilities are less than 10% for the Apr-Jun and May-Jul periods, and near zero during the second half of 2018.
Note – Only models that produce a new ENSO prediction every month are included in the above statement.
Caution is advised in interpreting the distribution of model predictions as the actual probabilities. At longer leads, the skill of the models degrades, and skill uncertainty must be convolved with the uncertainties from initial conditions and differing model physics, leading to more climatological probabilities in the long-lead ENSO Outlook than might be suggested by the suite of models. Furthermore, the expected skill of one model versus another has not been established using uniform validation procedures, which may cause a difference in the true probability distribution from that taken verbatim from the raw model predictions.
An alternative way to assess the probabilities of the three possible ENSO conditions is more quantitatively precise and less vulnerable to sampling errors than the categorical tallying method used above. This alternative method uses the mean of the predictions of all models on the plume, equally weighted, and constructs a standard error function centered on that mean. The standard error is Gaussian in shape, and has its width determined by an estimate of overall expected model skill for the season of the year and the lead time. Higher skill results in a relatively narrower error distribution, while low skill results in an error distribution with width approaching that of the historical observed distribution. This method shows probabilities for La Niña at approximately 10% for the full range of seasons, from Apr-Jun 2018 through to Dec-Feb 2018-19. Probabilities for neutral conditions begin at 90% for Apr-Jun, drop to about 60% for Jun-Aug and to less than 40% from Sep-Nov through the final season of Dec-Feb. Meanwhile the probabilities for El Niño, which begin at 0% for Apr-Jun, rise to about 30% for Jun-Aug, 40% for Jul-Sep, exceed 50% beginning with Sep-Nov and reach 60-65% for Nov-Jan and Dec-Feb 2018-19. A plot of the probabilities generated from this most recent IRI/CPC ENSO prediction plume using the multi-model mean and the Gaussian standard error method summarizes the model consensus out to about 10 months into the future. The same cautions mentioned above for the distributional count of model predictions apply to this Gaussian standard error method of inferring probabilities, due to differing model biases and skills. In particular, this approach considers only the mean of the predictions, and not the total range across the models, nor the ensemble range within individual models.
In summary, the probabilities derived from the models on the IRI/CPC plume describe, on average, a strong preference for ENSO-neutral from Apr-Jun to Jun-Aug 2018, approximately equal probabilities for neutral or El Niño conditions for Aug-Oct, followed by a period from Sep-Nov through Dec-Feb 2018-19 when El Niño conditions are between approximately 55% and 65% likely. Probabilities for La Niña are roughly 10% throughout the entire forecast period. A caution regarding this latest set of model-based ENSO plume predictions, is that factors such as known specific model biases and recent changes that the models may have missed will be taken into account in the next official outlook to be generated and issued early next month by CPC and IRI, which will include some human judgment in combination with the model guidance.
And finally the SOI which is used to confirm the Phase of ENSO. The SOI relates to atmospheric conditions rather than Sea Surface Temperatures.

Forecasts from Other Meteorological Agencies.
Here is what is called the plume of a variety of forecast models.

It is difficult to find the NOAA NCEP model in the graphic but it is near the middle but lower than the mean. Notice all the models have bottomed and are rising going forward.
Here is the JAMSTEC Model Forecast

And the short discussion related to the March 1 ENSO forecast. We should have an updated discussion soon. .
Mar. 16, 2018. Prediction from 1st Mar., 2018 ENSO forecast:
The La Niña-like condition will disappear by late spring. Then the tropical Pacific will return to a normal state by summer.
Indian Ocean forecast:
A normal state in the tropical Indian Ocean will persist in 2018.
Atlantic Ocean forecast:
The Atlantic Niño appears to develop in 2018.
Regional forecast:
On a seasonal scale, most part of the Eurasian Continent will experience a warmer-than-normal condition in spring and summer. In India, however, we expect colder-than-normal condition in summer. Northwestern U.S., western Canada, northern Brazil, Peru, Ecuador, western, eastern and southern Africa, and northern Australia will experience a colder-than-normal condition in boreal spring. This colder condition in northern Brazil and southern Africa will stay even in boreal summer.
As regards to the seasonally averaged rainfall, a wetter-than-normal condition is predicted for the Philippines, Indochina, northern India, eastern Africa, Mexico, eastern U.S. and northern Brazil during boreal spring, whereas western/central U.S., Europe, Iran, Indonesia, southern China, Australia, southern Africa, and southern Brazil will experience a drier-than-normal condition during boreal spring. This drier condition will stay in Europe, central U.S., southeastern Australia, and Indonesia in summer.
Most part of Japan will experience warmer and wetter-than-normal conditions in spring and summer; we expect an active rainy season in 2018.
Here is the Nino 3.4 report from the Australian BOM (it updates every two weeks)
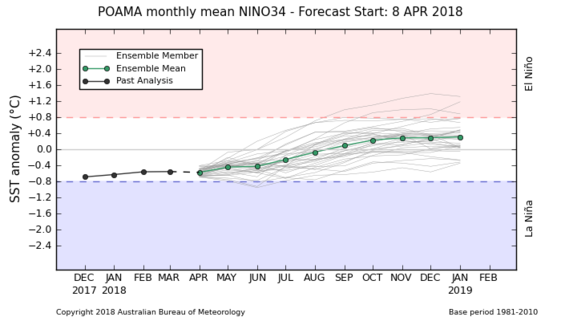
And the ENSO Outlook Discussion Issued on April 10, 2018
El Niño – Southern Oscillation influence on the climate remains weak
The El Niño – Southern Oscillation (ENSO) remains neutral—neither El Niño nor La Niña. Most models predict a neutral ENSO pattern will persist through the southern autumn and winter.
Most atmospheric and oceanic indicators of ENSO are at neutral levels. Sea surface temperatures in the central Pacific are close to average for this time of year. Beneath the surface, the tropical Pacific Ocean is slightly warmer than average, but well within the neutral range. In the atmosphere, cloud and pressure patterns remain weakly La Niña-like, but trade winds are close to average.
Climate models indicate that tropical Pacific Ocean sea surface temperatures will continue to rise, but remain ENSO neutral for the remainder of the southern autumn and winter.
All eight of the surveyed international climate models indicate equatorial Pacific sea surface temperatures are likely to continue rising over the coming months. A neutral ENSO state is the most likely outcome for the remainder of the southern hemisphere autumn and winter. The Bureau’s model predicts the equatorial Pacific will continue to gradually warm throughout winter but remain within the neutral range.
Climate model outlooks for ENSO and the IOD have lower accuracy during autumn than at other times of the year. Hence, current model outlooks of these climate drivers should be viewed with some caution.
Indian Ocean IOD (It updates every two weeks)
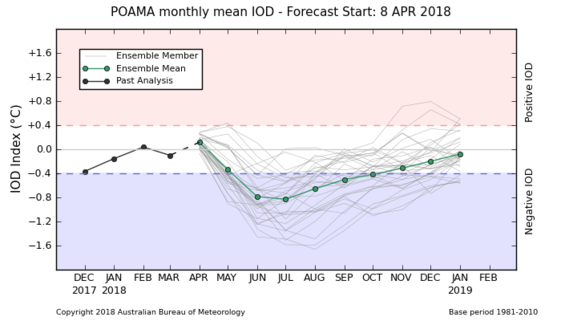
Indian Ocean Dipole Outlook Discussion Issued April 10, 2018
The Indian Ocean Dipole (IOD) is currently neutral with a weekly index value to 8 April of +0.2 °C. All of the six international climate models surveyed by the Bureau indicate that the IOD will remain neutral during autumn. However, two models, including the Bureau’s model, suggest that a negative IOD event is possible during the southern hemisphere winter. It should be noted that outlook skill is lower at this time of year.
A negative IOD during winter tends to enhance rainfall across southern Australia..
The IOD Forecast is indirectly related to ENSO but in a complex way. It is important to understand how and where the IOD is measured.

IOD Positive is the West Area being warmer than the East Area (with of course many adjustments/normalizations). IOD Negative is the East Area being warmer than the West Area. Notice that the Latitudinal extent of the western box is greater than that of the eastern box. This type of index is based on observing how these patterns impact weather and represent the best efforts of meteorological agencies to figure these things out. Global Warming may change the formulas probably slightly over time but it is costly and difficult to redo this sort of work because of long weather cycles.
Some Housekeeping Issues.
If you are reading this Update Report and wish to transfer to the Current Weather and Climate Report, Click Here for the list of Weather Posts. That link takes you to the archive of all weather articles written by Sig Silber so you can see if the new Weekly Weather Report has been published go there or back to an earlier report but please keep in mind that the graphics in earlier reports in some cases auto-update and the text may no longer apply to the graphics shown. Remember, if you leave this page to visit links provided in this article, you can return by hitting your “Back Arrow”, usually top left corner of your screen just to the left of the URL box. The next Regular Weekly Weather and Climate Report will be published on Monday April 23, 2018. It will as usual focus on the next twenty-five days. Our most recent Drought and Agriculture Report can be accessed here.


