Written by Sig Silber
Last night, we noted that NOAA’s refusal to recognize that La Nina was over might come back to bite them fairly soon. As of yesterday, the precipitation forecasts were very conflicted but somewhat hopeful. They now seem to be resolving in a way that is more favorable initially for eastern New Mexico and then gradually for Kansas, Oklahoma and Northern Texas. We begin to address this tonight in a special update report. We will provide more detail in our Seasonal Outlook Update tomorrow night and in our Weekly Weather and Climate Report on Monday. It takes time to create a drought and it takes time to relieve a drought. But it looks like the process for reducing extreme drought is starting.

Please share this article – Go to very top of page, right hand side for social media buttons.
There was a hint yesterday of improving conditions as the La Nina abated.
This graphic which was issued yesterday suggested that we might start seeing improvement at least in the eastern end of the area most impacted by significant drought as the La Nina Pattern changed to an ENSO Neutral pattern.

It showed an area where the drought was expected to improve. But the Experimental Week 3 – 4 Precipitation Forecast from last Friday contradicted this. We thought the picture might be clearer when the Week 3 – 4 forecast was updated today and it is.
We now have an updated Week 3 -4 Experimental Precipitation Forecast and the above map seems to have been based on that forecast.

Here is the discussion that was issued with this forecast.
Week 3-4 Forecast Discussion Valid Sat May 05 2018-Fri May 18 2018
La Nina conditions currently are present across the equatorial Pacific Ocean. Equatorial sea surface temperatures (SSTs) are below average across the east-central and eastern Pacific Ocean, however the weekly average Nino 3.4 SST anomaly is now above the -0.5 Celsius threshold used to identify La Nina conditions. La Nina conditions have weakened in recent weeks, and a transition to ENSO-neutral conditions is expected in the spring. The RMM MJO indices indicate a weakening MJO signal over the Indian Ocean in the past few days, with dynamical models forecasting no MJO signal in the next several weeks. The Week 3-4 temperature and precipitation outlooks rely primarily on dynamical model forecasts from the NCEP CFS, ECMWF, and JMA operational ensemble prediction systems, as well as forecasts from the Subseasonal Experiment (SubX), a multi-model ensemble (MME) of experimental ensemble prediction systems. Consideration is also given to the possible evolution of the predicted circulation pattern in Week 2.
The various dynamical model guidance for the Week 3-4 Outlook shows some significant differences between individual models. Early in the Week 2 period, dynamical models consistently predict a ridge over western North America and troughs over the eastern CONUS and the Aleutian Islands. As Week 2 progresses, a trough is forecast to lift out of the eastern CONUS as 500-hPa heights rise. The ECMWF ensemble predicts a trough over the eastern CONUS to redevelop in Week 3-4. CFSv2 forecasts are somewhat consistent with the ECMWF, indicating below normal 500-hPa heights and troughing over the central CONUS in Week 3-4. The CFS predicts above normal 500-hPa heights over the Northeast, which is more consistent with several of the SubX models, including the NCEP GEFS. The MME mean of the SubX indicates above normal 500-hPa heights over the Northeast and near-zero anomalies over the remainder of the CONUS, due to substantial model disagreement. CFS, ECMWF, and the SubX MME mean predict positive 500-hPa height anomalies over most of mainland Alaska, and relatively weak troughing over the Aleutian Islands in Week 3-4. Most dynamical model forecasts predict near or above normal 500-hPa heights over Hawaii.
There is substantial disagreement among the various dynamical model temperature forecasts for Week 3-4. The ECMWF model predicts a large area of below normal temperatures from the Great Plains states across the Mississippi Valley to the Eastern Seaboard, with below normal temperatures extending southward to the Gulf Coast. The CFS and ECCC (Environment Canada) model forecasts confine below normal temperatures to the Central and Northern Plains states and eastward, predicting near to above normal temperatures for parts of the Southern Plains and Southeast. CFS temperature forecasts also indicate near to above normal temperatures for parts of the Great Lakes and Northeast regions.
The Week 3-4 Outlook indicates below normal temperatures are most likely from parts of the Northern and Central Plains eastward into the Midwest region. Equal chances of above and below normal temperatures are indicated for most other areas of the eastern CONUS, where there is substantial disagreement among the various model forecasts. Above normal temperatures are most likely for Alaska, under above normal mid-level heights. Above normal temperatures are most likely for the western CONUS, as indicated by a consensus of dynamical models, as well as along the Gulf Coast to the Florida Peninsula, consistent with surrounding above normal SSTs. Hawaii is likely to have above normal temperatures, as predicted by nearly all dynamical models and consistent with above normal SSTs.
Dynamical model forecasts are in very good agreement on the precipitation outlook for Week 3-4, despite substantial disagreement in the mean circulation pattern for the period. The ECMWF, CFS, and all SubX models indicate an area of above median precipitation over the central CONUS. Uncertainty in the location of precipitation leads to a forecast of equal chances of above and below median precipitation over most areas of the CONUS. Above median precipitation is indicated in Week 3-4 across parts of the Central and Southern Plains into the Central Mississippi Valley, where there is greater confidence due to a consensus among dynamical model forecasts. Below median precipitation is most likely for the Northwest CONUS and from eastern areas of the Northern Plains into the Great Lakes region, where the CFS and ECMWF precipitation forecasts are in agreement. Below median precipitation is most likely for areas of Northwest Alaska, and above median precipitation is most likely for southwestern regions of the state, consistent with the CFS, ECMWF, and the SubX MME mean forecasts. Forecasts from the CFS, ECMWF, and virtually all individual SubX models indicate increased probabilities of above median precipitation for Hawaii for the Week 3-4 period.
The NOAA Seasonal Forecast for May still partially contradicts the improvement potential.

The new three-month forecast from NOAA (which we will be reporting on tomorrow night) also seems a bit non-committal.

I think readers should pay attention to our Seasonal Outlook Report tomorrow night and our Weekly Report on Monday as this is an evolving situation but it seems evolving in a positive way.
The rest of the report has not changed except to reflect the new Week 3 – 4 Forecast.
This report is organized into three parts plus Additional Reference Information:
- The U.S. Drought Monitor (full report can be accessed here)
- Selected parts of our Weekly Weather and Climate Report (Monday’s full report can be accessed here) which has forecasts for the next 25 days and which auto-updates
- Selections from the Tuesday USDA Weather and Crop Bulletin (full report can be accessed here) supplemented by related information.
1. U.S. Drought Monitor
The U.S. Drought Monitor is a comprehensive way of understand the drought situation for the U.S. It is issued every Thursday and reflects the conditions as of the prior Tuesday. Drought is defined as a moisture deficit bad enough to have social, environmental or economic effects. Thus, more factors than recent precipitation are considered and more information on how it is done is found at the end of this report.

This adds some statistics to the overall picture and shows that the overall extent of drought has declined somewhat but the area in the extreme drought categories has increased a bit. The numbers in this graphic are small so harder to read but shown again below the graphic.


| Last Week | This Week |
 |  |
This compares the two maps i.e. last week and this week and shows the changes.

 |
| Improvement especially in the North. |
 |
| Midwest in good shape with improvement in the North |
 |
| No problem in Northeast |
 |
| Very slight deterioration in the South |
 |
| Substantial improvement in the Southeast |
 |
| Deterioration in the part of the West with the worst conditions combined with Improvement in some areas to the north. |
This might make it easier to get a general idea of what is happening in the worst part of the drought area.
| Last Week | This Week |
 |  |
Animation of twelve weeks of change.

Here is the discussion which was issued with the Drought Monitor today.
This Week’s Drought Summary
A powerful spring storm emerged from the West and brought extreme conditions to several regions. For example, historic, late-season snow blanketed portions of the northern Plains, upper Midwest, and Great Lakes region, snarling traffic and severely stressing livestock. Meanwhile, dry, windy weather contributed to a major wildfire outbreak, starting on April 12, and led to blowing dust and further reductions in rangeland, pasture, and crop conditions. Farther east, heavy showers and locally severe thunderstorms swept across portions of the southern and eastern U.S. Elsewhere, unsettled, showery weather lingered in the Northwest, extending as far south as northern California.
Northeast
A storm system crossing the Northeast on April 15-16 delivered widespread rain and—in northern areas—some wintry precipitation. The U.S. Department of Agriculture reported topsoil moisture approximately one-half surplus on April 15 in Maine (51% surplus), New York (49%), and Delaware (48%). The storm, which produced 1- to 3-inch rainfall totals in many areas, resulted in a reduction in the coverage of abnormal dryness (D0) and moderate drought (D1) in the northern Mid-Atlantic region.
Southeast
A cold front sweeping across the Southeast from April 14-16 produced heavy showers and locally severe thunderstorms. As a result, there were substantial reductions in the coverage of abnormal dryness (D0) and moderate drought (D1) from Alabama to Virginia. In general, rainfall was lighter east of the Appalachians, resulting in fewer improvements—and even some increase in drought coverage—in the southern Atlantic region. For example, there was a slight increase in coverage of moderate and severe drought (D1 and D2) in southern Florida, while D2 persisted in many areas along and near the Atlantic Coast in Georgia and South Carolina. Through April 17, year-to-date rainfall in Savannah, Georgia, totaled just 5.24 inches (44% of normal).
South
A sharp line between no drought and moderate to exceptional drought (D1 to D4) continued to slice across Oklahoma and Texas. On April 15, topsoil moisture was rated 72% very short in Oklahoma, along with 66% in Texas. In stark contrast, topsoil moisture was at least one-third surplus in Mississippi (58%), Tennessee (41%), Arkansas (37%), and Louisiana (34%). In the drought-affected areas, rangeland, pastures, and winter grains continued to greatly suffer. On April 15, nearly two-thirds of the winter wheat was rated in very poor to poor condition in Oklahoma (65%) and Texas (63%). On April 12-13 and 16-17, high-wind events brought blowing dust and a rash of major wildfires to western Oklahoma and portions of neighboring states. As of April 17, the two largest wildfires in Oklahoma had charred more than 300,000 acres of grass and brush and had destroyed more than 100 structures. The Rhea Fire, in Dewey County, had consumed more than one-quarter million acres, while the 34 Complex, in Woodward County, had burned across nearly 70,000 acres.
Midwest
A major, late-season storm dumped heavy snow across much of the northern half of the region, sharply reducing the coverage of abnormal dryness (D0). In Wisconsin, April 13-16 storm-total snowfall included 24.2 inches in Green Bay and 20.7 inches in Wausau. In both locations, it was the biggest April storm (previously, 11.0 inches in Green Bay on April 4-5, 1977, and 12.1 inches in Wausau on April 15-16, 1993) and the second-highest event total on record. Green Bay’s greatest snowfall occurred on March 1-2, 1888, with 29.0 inches; Wausau’s biggest snowfall, on March 5-6, 1959, was 22.1 inches.
High Plains
Heavy snow also blanketed portions of the northern Plains, while dry, windy weather dominated drought-affected areas of the central Plains. The storm contributed to the elimination of severe drought (D2) from the Dakotas, and brought substantial reductions in the coverage of abnormal dryness (D0) and moderate drought (D1). In South Dakota, 2-day April snowfall records were broken on April 13-14 in Mitchell (16.2 inches) and Huron (15.5 inches), while peak gusts were clocked to 60 and 57 mph, respectively. Sioux Falls, South Dakota, received 14.5 inches of snow from April 13-15, and reported a gust to 67 mph on the 14th. Most of Sioux Falls’ snow—13.7 inches—fell on the 14th, easily becoming the snowiest April day on record in that location (previously, 10.5 inches on April 28, 1994). Farther south, however, topsoil moisture was rated 72% very short to short on April 15 in Kansas, along with 61% in Colorado. On the same date, winter wheat in Kansas was rated 46% very poor to poor. In Colorado, there was a significant introduction of exceptional drought (D4) into the southwestern corner of the state, where winter snowfall was abysmal and spring and summer runoff prospects are poor.
West
Late-season precipitation continued to move ashore as far south as northern California, resulting in some minor reductions in the coverage of abnormal dryness (D0). In the Southwest, however, dry, often windy weather resulted in drought persistence or intensification. Arizona’s rangeland and pastures were rated 86% very poor to poor on April 15, compared to the 5-year average of 30%. On the same date, New Mexico’s rangeland and pastures were rated 50% very poor to poor, while winter wheat was rated 68% very poor to poor. New Mexico’s topsoil moisture on April 15 was rated 91% very short to short. Due to deteriorating agricultural and hydrological conditions, exceptional drought (D4) was expanded in the Four Corners region as well as northeastern New Mexico.
Alaska, Hawaii, and Puerto Rico
Neither dryness nor drought was observed in Hawaii and Puerto Rico. In Alaska, there were no changes to the depiction, although recent precipitation in the southeastern part of the state resulted in some improvement with respect to the generation of hydroelectric power. Nevertheless, significant cold-season snowpack and precipitation deficits exist across southeastern Alaska.
Looking Ahead
A storm system crossing the nation’s northern tier will reach the Northeast on Thursday, bearing rain and snow. A more significant storm will traverse the West and produce heavy snow in the central Rockies before crossing the Plains on Friday. Precipitation totals associated with the storm will be variable, but some drought-stricken areas of the central and southern Plains could receive as much as 0.5 to 2.0 inches of rain. During the weekend, showers and thunderstorms will erupt across the mid-South and spread into the Southeast. By early next week, warm, dry weather should overspread much of the western U.S., while chilly conditions will linger across the South and East.
The NWS 6- to 10-day outlook for April 24 – 28 calls for the likelihood of near- to below-normal temperatures across most of the eastern half of the U.S., while warmer-than-normal weather will cover the West. Meanwhile, near- to below-normal precipitation across the majority of the country should contrast with wetter-than-normal conditions in a few areas, including the Atlantic Coast States and central and southern sections of the Rockies and High Plains.
2. Selected parts of our Weekly Weather and Climate Report (Monday’s full report can be accessed here) which has forecasts for the next 25 days and which auto-updates
Current Forecast for Precipitation (Commentary was updated on April 20 to reflect the updated Week 3 – 4 Experimental Precipitation Forecast. This was especially important this week as the current Day 6 – 14 forecasts and the week old week 3 – 4 forecast which overlap to some extent were very different)
| The five day QPF is shown to the right. The units are different than the other maps i.e. in units of precipitation (inches) not probabilities of exceeding or being less than climatology. |  | It is difficult to compare this with the other maps as some places are naturally more wet than others. But it is generally consistent with the 6 – 10 day forecast as one can see how the 6 -10 day might follow the 1 – 5 day. | |
 | Transitioning from the 6 to 10 day outlook on the left to the 8 to 14 day outlook on the right. → |  | |
It is hopeful if it plays out as forecast. . | |||
To the right is the week 3 and 4 Experimental Forecast which I had updated on April 13 when we went to press. → The forecast was then updated on Friday April 20, 2018. The new forecast is more optimistic about relief for Kansas, Oklahoma and Northern Texas. |  | ↑ ← In generally it would seem that the Week 3 -4 Forecast may evolve from the Day 6 – 14 Pattern. | |
3. Selections from the Tuesday USDA Weather and Crop Bulletin (full report can be accessed here) supplemented by related information.
The Summary for the U.S.


The U.S. Drought Monitor does not make forecasts of drought conditions but this part of NOAA does.
And here is a graphic that pulls a lot of information together. Image provided by the NOAA/ESRL Physical Sciences Division, Boulder, Colorado see website. It shows the demands of the atmosphere for moisture from the ground and is based on temperature, wind, relative humidity and solar radiation. It tells you nothing about how much precipitation you will get but it tells you how much you need to retain the same amount of surface soil 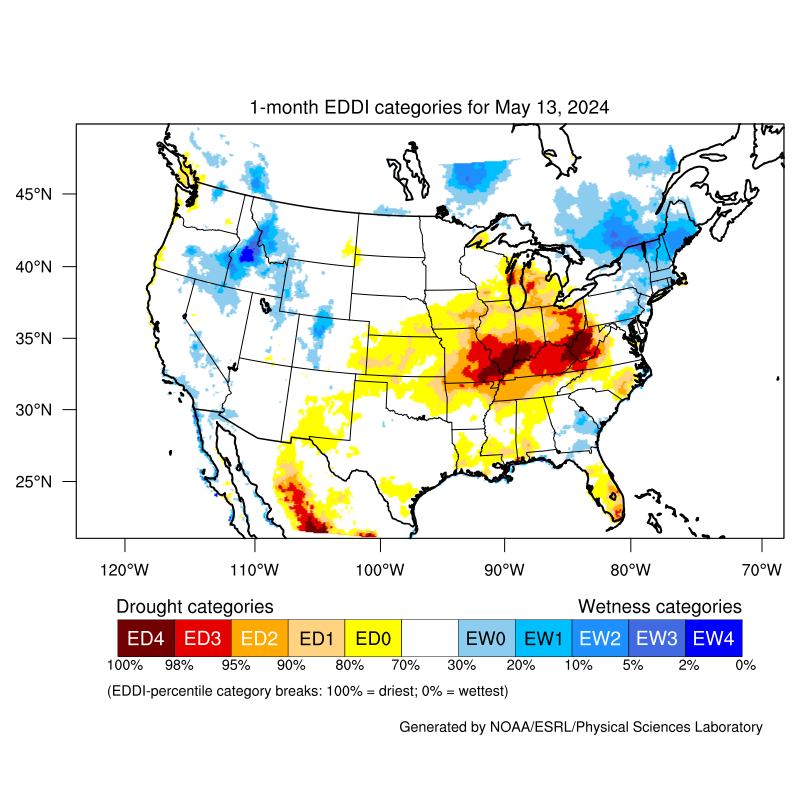
Here is another way of looking at things.

Soil Moisture is a very important part of understanding drought.
| Surface | Subsurface |
 |  |
| The numbers in parenthesis show the changes by state. Overall the situation is static. | |
 |  |
| Again not much change based on the text in the legend or the per state changes in parentheses. | |

Sometimes a map can be helpful to make text come alive.


Additional Reference Information
A more complete description of


Source: National Drought Mitigation Center, University of Nebraska-Lincoln, U.S.A.


