Written by Sig Silber
There may be some relief for the eastern end of this crescent of dry areas (The D3 or worse) but it is getting worse in the areas shown in red. The relatively small D4 area of “Exceptional Drought” has also expanded. If New Mexico is a guide, the immediate impact is not on public water supplies or reservoirs but for those doing dry farming and also rangelands and forests. The impact on reservoirs will be next year as snow runoff is minimal this year. As usual, the magic number is three. One year of drought is bad, two years is intolerable and three years would be a disaster. We are in Year One. Next winter needs to be better.

Please share this article – Go to very top of page, right hand side for social media buttons.
The U.S. Drought Monitor is a comprehensive way of understand the drought situation for the U.S. It is issued every Thursday and reflects the conditions as of the prior Tuesday. Drought is defined as a moisture deficit bad enough to have social, environmental or economic effects. Thus, more factors than recent precipitation are considered and more information on how it is done is found at the end of this report.

A comparison of the change: I enlarged four areas so that the changes would be easier to see.
| Last Week | This Week |
 | |
| Looking at key areas below. | |
 |  |
| The gap where the Rio Grande enters New Mexico from Colorado has been filled with D3 even though river valleys usually are the last to feel a drought due to mountain runoff even when reduced. The area along the Texas/Kansas border of Exceptional Drought has expanded. | |
 |  |
| Not sure why the drought area was not delineated this week. It has moderated some except the Virginia part. | |
 |  |
| There is overlap with an earlier insert but you can see how Central California and the Sierras have dropped out of drought conditions due to a lot of precipitation. You can also see the drought expansion in Arizona. | |
 |  |
| Not much change but part of South Dakota now has the “L” added. | |
Animation of twelve weeks of change.

Here is the discussion which was issued with the Drought Monitor today. It provides more detail than my summary comments above.
Early in the drought week, moderate precipitation fell in an area covering southern Minnesota stretching southeastward through central Iowa and Illinois, southern Indiana, Kentucky, southwestern Virginia, and much of North Carolina. Heavier precipitation fell in coastal California and the Sierra range. Coastal Oregon and Washington also saw moderate to heavy precipitation amounts during the first half of the drought week. The Northeast experienced its fourth Nor’easter in as many weeks. Near the end of the drought week, a swath of precipitation fell from Texas, eastern Oklahoma, into Missouri and Indiana. The dry pattern continued for the drought stricken areas of the southern Rockies and Plains and parts of the Southeast.
Northeast
The Northeast endured another nor’easter this week – its fourth in as many weeks. Based on preliminary reports, as much as 20 inches of snow fell in parts of the region. Dryness was confined to the inland areas of Maine, New Hampshire, New York and Vermont where 30-day precipitation deficits are 1-2 inch below normal in places. Recent precipitation allowed D0 to be contracted in northern Maryland and D1 to be contracted around Washington D.C.
Southeast
Precipitation was above normal (1-2 inch surplus) across much of Virginia and North Carolina during the USDM period. Precipitation was near to slightly above normal for western Virginia, much of North Carolina and northern Alabama during the past 30 days. Elsewhere in the region, 30-day precipitation deficits of 1-3 inches are widespread. Long-term deficits in the region remain steady; however, short-term deficits have increased due to the recent lack of precipitation. Streamflows have also decreased at many sites. Despite the recent dryness, the drought depiction this week remained mostly unchanged. There was an expansion of D0 in southwest Georgia and the D0 in northwest Alabama was extended eastward. In Florida, recent dryness has continued, prompting the expansion of D0 in the central part of the state where the 180-day precipitation deficits are 7-10 inches. The Keetch-Byram Drought Index, an index used to determining forest fire potential, continues to worsen. The values are especially high in the Miami-Dade county area.
South
Precipitation was generally above normal (0.5-2.0 inch surpluses) across north central Texas, eastern Oklahoma and extreme northwestern Arkansas during the USDM period. During the last 30 days, much of Texas, Oklahoma and Louisiana were running 1-3 inches below normal while Arkansas was as much as 5 inches above normal. According to the USDA, 65 percent of wheat in Texas was in poor to very poor condition while 72 percent of topsoil moisture across the state was short to very short. Moderate and Extreme drought was expanded in central and parts of southern Texas. Precipitation continues to miss western Oklahoma where 28-day streamflows are running below the fifth percentile and precipitation for the last 6-months is around 20 percent of normal. Extreme drought was expanded to cover more of the Panhandle of Oklahoma, reaching into Kansas and Texas. Drought and dryness is not currently affecting the majority of the other states of the region.
Midwest
Precipitation was generally above normal across the region during the USDM week. Totals were in the 2-4 inch range for much of southern Indiana where 2 separate systems, one early and another later in the week, converged. Precipitation during the last 30 days was above normal (2-5 inches) for parts of Indiana and Missouri. Abnormally dry conditions continued for much of Wisconsin and the Upper Peninsula of Michigan where D0 was expanded. D0 was contracted in central Missouri due to the recent precipitation.
High Plains
Precipitation was light across the region during the USDM period as, generally speaking, less than 1 inch of precipitation fell. Aside from Kansas and Colorado, precipitation during the past 30-days was just ahead of normal as surpluses of 0.50 to 1 inch fell in much of North Dakota, eastern South Dakota and eastern Nebraska. Winter wheat conditions were rated 49 percent poor to very poor in Kansas while 69 percent of topsoil moisture across the state was short to very short. In southern Kansas, 180-day precipitation departures are 4-8 inches below normal. In southwestern South Dakota, recent precipitation allowed for D0 and D1 to be contracted. Severe drought (D2) was contracted in west central Colorado and in the Dakotas. Extreme drought (D3) was expanded southern and western Colorado and southern Kansas.
West
Copious amounts of precipitation fell in the West during the USDM period, helping to restore the below-normal seasonal mountain snowpack in the Sierra. In the lower elevations, the atmospheric river event caused flash flooding and mudslides in the same area where forest fires last December charred the landscape. Little to no precipitation fell during the week in Arizona and New Mexico. Despite the recent precipitation in California, departures are evident beyond 30 days. At the 6-month time scale, precipitation amounts are 30-50 percent of normal in Southern California. However, for the same period (6-month), the recent storm brought the precipitation totals closer to normal in the central and northern Sierra. River basin snow water content now measures 75-90 percent of average in the central Sierra. The recent storm allowed the contraction of drought across much of the West this USDM period. However, where the precipitation did not fall (Desert Southwest and northwestern New Mexico), Severe and Extreme drought (D2-D3) was expanded.
*For details on Eastern Colorado and Eastern Wyoming, refer to the High Plains region.
Alaska, Hawaii, and Puerto Rico
No changes were made in Alaska this USDM period. Drought or abnormally dry conditions do not exist for Hawaii or Puerto Rico this week.
Looking Ahead
During the next 5 days, precipitation amounts are forecast to be high (3-5 inches) in an area stretching from Louisiana, Arkansas, Alabama, western Tennessee and into Kentucky. Elsewhere, lighter precipitation is forecasted to fall in the northern and central Rockies, High Plains, and Northeast. The drought-stricken Four Corners region, western Texas and the Southwest are expected to continue to be dry.
The 6-10 day outlook from the Climate Prediction Center calls for an increased chance of below-normal precipitation in the High Plains stretching into the Great Lakes region while the highest probability of above normal temperatures is centered around the Southwest. The probability of above-normal precipitation is highest in the South. Below-normal precipitation is most likely to occur across parts of the Southwest.
It is useful to consider the Historical Perspective.
 |  |
According to preliminary data provided by the National Centers for Environmental Information, the contiguous U.S. experienced its 24th-wamest winter during the 123 period of record. December-February temperatures averaged 34.0F, 1.7F above the 1901-2000 mean. State Temperature rankings ranged from the 39th coldest winter in Montana to among the ten warmest winters in California, Nevada, and the Four Corners States. For Arizona, it was the second warmest winter behind 2014-2015
Meanwhile, December-February precipitation across the Lower 48 States averaged 6.25 inches, 92 percent of normal representing the 34th driest winter on record. State precipitation rankings ranged from the second-driest winter in California to the fourth-wettest winter in Arkansa. California, which had a drier winter only in1976-77, also weathered its third-warmest winter, behind 2014-2015 and 2013-14.
Current Forecast for Precipitation (Commentary slight updated on March 30 to reflect the updated Week 3 – 4 Experimental Precipitation Forecast)
| The five day QPF is shown to the right. The units are different than the other maps i.e. in units of precipitation (inches) not probabilities of exceeding or being less than climatology. |  | It is difficult to compare this with the other maps as some places are naturally more wet than others. But it is generally consistent with the 6 – 10 day forecast as one can see how the 6 -10 day might follow the 1 – 5 day. | |
 | Transitioning from the 6 to 10 day outlook on the left to the 8 to 14 day outlook on the right. → |  | |
It is a fairly stagnant pattern but generally wet in many places. . | |||
To the right is the week 3 and 4 Experimental Forecast. → The Southern Tier is dry. . |  | I updated the commentary on Friday March 30, 2018 when the updated graphic came out. It is not a bg change but makes it easier to interpret when it is current rather than six days old. ↑ ← It appears that the Southern Tier will revert to being dry in Weeks 3 -4 not continue the mixed situation in the 6 – 14 Day Forecast? | |
Also of interest is the USDA Weekly Weather and Crop Bulletin which can be found here. These are some of the key graphics related to the drought. I have added graphics from other sources where it is helpful.
It has something to say about flood risk which they have not called it such but may be part of what is called the Trans-Nino Pattern as a La Nina decays.

Here is another way of looking at things.

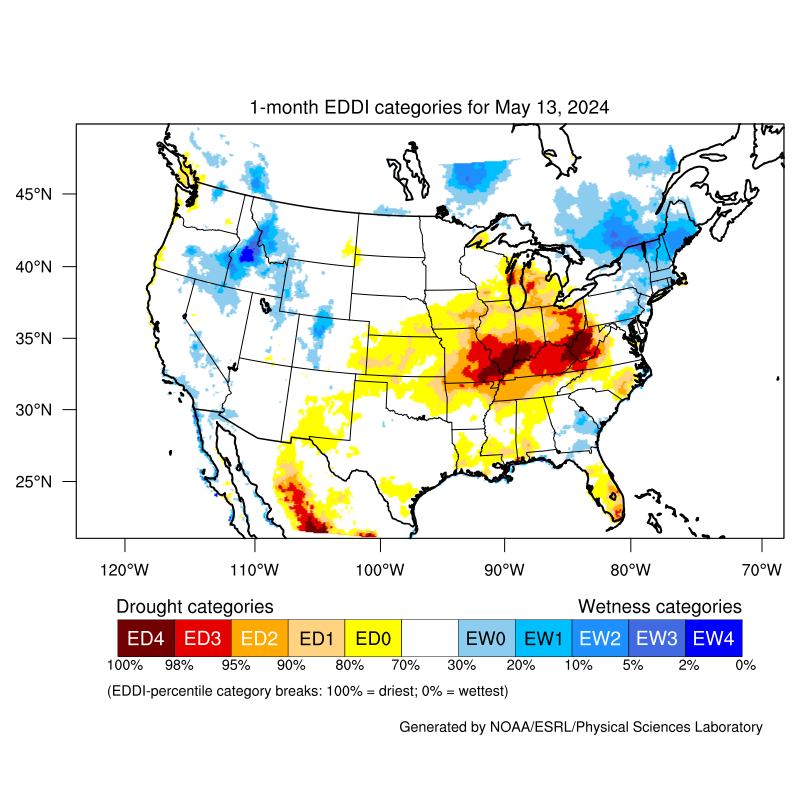
And here is something that pulls a lot of information together. Image provided by the NOAA/ESRL Physical Sciences Division, Boulder, Colorado see website. It shows the demands of the atmosphere for moisture from the ground and is based on temperature, wind, relative humidity and solar radiation. It tells you nothing about how much precipitation you will get but it tells you how much you need to retain the current drought level of severity
The Summaries for the U.S. and International follow:

For the rest of the World and it is important to keep in mind that La Nina tends to be a dry pattern for CONUS but a wet pattern for much of the World.

Maps can explain things better than a table.

Additional Reference Information
A more complete description of


Source: National Drought Mitigation Center, University of Nebraska-Lincoln, U.S.A.


