Written by Sig Silber
The main focus of this report is the NOAA April, Three-Month and 15-Month Forecasts, the JAMSTEC Three-Season Forecast, and a comparison of the JAMSTEC with the NOAA forecast. There is fairly good agreement in the short term and then it diverges. In this report, we provide a detailed analysis of NOAA and JAMSTEC forecasts for Alaska and CONUS and we also provide the JAMSTEC Maps for the Rest of the World.

Please share this article – Go to very top of page, right hand side for social media buttons.
This report is organized into a summary that has two tables of graphics that show the temperature and precipitation forecasts for the upcoming three seasons, A brief discussion of the ENSO assumptions by both NOAA and JAMSTEC and then a lengthy analysis which is organized into three parts:
A. A full discussion of the recent NOAA Seasonal Outlook
B. A comparison between the NOAA and JAMSTEC Forecasts.
C. A more detailed analysis of the forecasts for ENSO by NOAA and JAMSTEC and others including the Australian Bureau of Meteorology and other factors influencing the forecasts.
For those who want a quick synopsis of the two forecasts, below is a summary of the temperature and precipitation forecasts for three time-periods and from left to right the NOAA forecast for Alaska and CONUS (the contiguous mid-latitude U.S), then JAMSTEC for North America (which includes Canada and Northern Mexico), and then JAMSTEC for Europe and surrounding areas. Larger graphics are provided later in the report. It is kind of a tease to keep you reading but you can see the evolution of the weather pattern through Spring, Summer and into Fall. For some readers, these two sets of summary graphics may be all the information they wish to look at and that is fine.
Temperature
| NOAA Alaska Plus CONUS | JAMSTEC North America | JAMSTEC Europe | |
MAM Spring Temp |  |  |  |
JJA Summer Temp |  |  |  |
SON FALL Temp |  |  |  |
Precipitation
| NOAA Alaska Plus CONUS | JAMSTEC North America | JAMSTEC Europe | |
MAM (AMJ for NOAA) Spring Precip |  |  |  |
JJA Summer Precip |  |  |  |
SON Fall Precip |  |  |  |
This is a summary of the ENSO forecasts of the two agencies. But the CFSv2 is not the only tool NOAA uses but the JAMSTEC Nino 3.4 forecast is input to their forecasting model.
| NOAA CFSv2* | JAMSTEC |
 |  |
This model keeps us in La Nina or near La Nina Conditions indefinitely | JAMSTEC quickly goes to Neutral for the Summer and then stays close to Neutral but with somewhat of a cool bias in Fall. Australia has a warm bias i.e. positive values of the Nino3.4 Index but in the Neutral Zone. |
| Here is the longer version of the JAMSTEC forecast. It tends towards El Nino values towards the end of 2019 into 2020 |
|
NOAA relies on a variety of forecasts including the CPC/IRI forecast which we discuss in Section C in addition to the CFSv2 model shown above. JAMSTEC uses the above in developing their forecast Maps. A part of forecasting is the forecast of Sea Surface Temperatures (SST) as this is very important for many forecasting models.
 |  |
 |  |
The key is the so-called cold tongue (shown in blue) extending west from Ecuador. Do not be fooled by the differences in how the two agencies use color (NOAA uses more bold colors) to show the Sea Surface Temperature Anomalies. Looking at the Nino 3.4 forecasts shown above these SST forecasts, we would not expect that the two Agencies would be viewing SSTA in a very similar way and in general they are not. I thought that JJA and SON were more useful than the Spring since the two Agencies have no choice but to agree for the Spring as the Nino 3.4 Index changes slowly.
There is an enormous difference in the forecast for ENSO beyond this Spring. NOAA shows a cold tongue for JJA (westerly displaced no doubt) but JAMSTEC does not. In SON, the NOAA cold tongue is less prominent and JAMSTEC also shows a rudimentary cold tongue. There are other major differences also. Fortunately at that far out, NOAA uses mostly statistical methods and ENSO does not factor in much in the longer term NOAA maps. It becomes mostly statistical and trends.
Updates from JAMSTEC can be found here. Updates from NOAA can be found here. You have to look for the SST row and go to the right where it says “normalized with mask” and click on E3 which provides the latest model run..
A. Focus on the NOAA Update
A note about terminology; the deviations from climatology/normal are color coded but also labeled “A” for more than (above) normal and “B” for less than (below) normal. The area designated EC means Equal Chances of being more or less than normal. JAMSTEC relies on their color coding. In my comments I have used EC to cover all the situations where a clear anomaly is not shown. So the words “warm”, “cool”, “wet”, “dry” should be generally interpreted as being relative to climatology/normal for that location and time of year.
First we will take a look at the NOAA Early Outlook for April 2018. It is called the Early Outlook because it will be updated at the end of March. Only the April Outlook will be updated at that time.
Temperature

Precipitation

We have nothing to compare these maps with as NOAA does not in their Update provide a forecast for each of the subsequent two months separate from their three-month forecast. Thus I do not have previously forecasted maps for April from the previous NOAA Report to compare against. And the current month is not over so we can not really compare the forecast for next month against the actual for this month. It is probably best to just try to understand what NOAA is trying to convey about April which can be summarized as for temperature, the Southern Tier and everything east of the Mississippi River will be warmer than climatology and there is a cool anomaly along the Northern Tier from Minnesota to and including Washington State. Northern and Western Alaska are warm and Southern Alaska and the Panhandle are cool. With respect to precipitation, the Southwest will be dry There is a North-Central and also a Mid-Mississippi-Valley wet anomaly. Northern Alaska is wet and Southern Alaska and the Panhandle are dry.
It is useful to see how the month forecast fits with the set of shorter forecasts that we have. Probably only the 8 – 14 and week 3-4 apply as the 6 – 10 falls within March (today) but it provides a segue to April.
First Temperature
 |  |  |
| The new monthly forecast is to the right. Does it appear to be reflective of the three parts of the month for which we have forecasts? → |
| ↑ ← The full month forecast seems to fit very well with the 8- 14 day and the Week 3/4 forecast except in the Northeast. But we do not have the last part of the month in the sequence of maps above. |

And then Precipitation
 |  |  |
| The new monthly forecast is to the right. Does it appear to be reflective of the three parts of the month for which we have forecasts? → | | ↑ ← The concatenation of the 8-14 Day and Week 3-4 Map seems to fit well except in the Northeast and also to some extent the North Central. But we do not have the last part of the month in the sequence of maps above. |
Now we consider the three-month Outlook.
Notice that the three-month periods are abbreviated e.g. April/May/June is shown as AMJ. You will see such abbreviations often in this report.
Prior Temperature Outlook for AMJ 2018

New Temperature Outlook for AMJ 2018
Prior Precipitation Outlook for AMJ 2018

New Precipitation Outlook for AMJ 2018
Now let us focus on the long-term situation and compare the new set of maps with the maps issued on February 15, 2018.
Prior 14 Month Temperature Outlook: AMJ 2018 – MAM 2019

New 14 Month Temperature Outlook: MJJ 2018 – AMJ 2019

To compare maps from one release to another, one needs to remember that the new release drops one three-month period and adds a later one. So to make the comparisons one has to shift the new maps to the right one position and that makes the map on the right drop down to become the left-most map in the next level. I do not have a computer software tool for doing that for you so you have to do it mentally. When I do the comparison, I print the two sets of maps and put them side by side and number the same three-month maps 1, 2, 3,…..,11 in both sets of maps to make it easier for me to easily compare the same three-month period in the new with the previous forecast. One uses the same procedure to compare the precipitation maps. Based on this procedure, I conclude that:
Now Precipitation
Prior 14 Month Precipitation Outlook: AMJ 2018 – MAM 2019

New 14 Month Precipitation Outlook: MJJ 2018 – AMJ 2019

If you want larger versions of each map (temperature and precipitation) you can find them here. And then each of those maps can be clicked on to further enlarge them.
Sometimes it is useful to compare the three-month outlook to the forecast for the first of the three months. It shows how much the pattern changes over the three-month period.

One can mentally subtract the First-Month Outlook from the Three-month Outlook and create the Outlook for the last two months in the three-month period.
*The concept is that the probabilities of a deviation from climatology in the First Month and the combined Month Two and Three forecast that one derives must average out to the probabilities shown in the three-month maps.
NOAA Discussion
Below are excerpts (significantly reorganized and with a lot of the redundancy and discussion of methodology removed) from the Discussion released by NOAA on March 15, 2018. Headings that are “Initial Cap” only rather than all caps were added by the Author of this Update Report for clarity. Also we have organized the sequence of the sections of NOAA Discussion to first present the Atmospheric and Oceanic Conditions and then the Initial Month, the Three-month period, and finally the remainder of the 15 Month Forecast. We think that sequence with the three- to four-month period broken out separately, makes the discussion more useful for more readers.
CURRENT ATMOSPHERIC AND OCEANIC CONDITIONS
EQUATORIAL PACIFIC OCEAN TEMPERATURES REMAIN BELOW AVERAGE FROM NEAR THE DATE LINE TO JUST WEST OF THE SOUTH AMERICAN COAST WITH THE GREATEST NEGATIVE DEPARTURES FROM CLIMATOLOGY LOCATED GENERALLY BETWEEN 150 W AND 120 W WITH A VALUE OF NEAR -1.0 DEGREES C. THE LATEST WEEKLY ANOMALY VALUE OF NINO3.4 IS -0.7 DEGREES C. OVER THE PAST MONTH, HOWEVER, MUCH OF THE EQUATORIAL PACIFIC OCEAN TEMPERATURES HAVE WARMED CONSIDERABLY. THE EQUATORIAL UPPER OCEAN HEAT CONTENT HAS BECOME POSITIVE DURING THE END OF FEBRUARY INTO EARLY MARCH AND SUBSURFACE TEMPERATURE ANOMALIES INDICATE A ROBUST DOWNWELLING OCEANIC KELVIN WAVE MOVING EASTWARD WITH TIME AT DEPTH IN THE WEST CENTRAL PACIFIC.
RECENT ATMOSPHERIC CONDITIONS ACROSS THE TROPICAL PACIFIC REMAIN CONSISTENT WITH LA NINA, BUT HAVE WEAKENED OVER THE PAST MONTH. SUPPRESSED CONVECTION REMAINED NEAR THE DATE LINE AS DID AREAS OF WEAK ENHANCED CONVECTION OVER THE MARITIME CONTINENT AND SOUTH PACIFIC CONVERGENCE ZONE. UPPER-LEVEL WINDS AT 200-HPA ARE ANOMALOUSLY WESTERLY OVER MOST OF THE TROPICAL PACIFIC OCEAN.
OTHER FACTORS TO REVIEW INCLUDE SOIL MOISTURE AND SNOWPACK ANOMALIES. POSITIVE SOIL MOISTURE ANOMALIES ARE EVIDENT IN VICINITY OF THE GREAT LAKES, OHIO VALLEY SOUTHEASTWARD TO INCLUDE PARTS OF THE LOWER MISSISSIPPI VALLEY. PRECIPITATION DEFICITS IN PRECEDING MONTHS HAVE RESULTED IN DRIER THAN NORMAL CONDITIONS ACROSS MUCH OF THE SOUTHERN TIER OF U.S. AND SOME AREAS OF THE CENTRAL PLAINS. ALSO, ANOMALOUSLY POSITIVE SNOWPACK IS OBSERVED FOR AREAS OF THE FAR NORTHERN ROCKIES AND HIGH PLAINS.
PROGNOSTIC DISCUSSION OF SST FORECASTS
A REVIEW OF THE LATEST NINO3.4 SST FORECASTS DEPICT A DECAYING LA NINA IN SHORT ORDER FOLLOWED BY ENSO-NEUTRAL CONDITIONS THROUGH THE BOREAL SUMMER AND IN SOME CASES INTO THE AUTUMN AND WINTER MONTHS. THE CPC CONSOLIDATION NINO3.4 SST FORECAST MAINTAINS ENSO-NEUTRAL CONDITIONS THROUGH ITS OUTLOOK PERIOD WHICH RUNS TO AMJ 2019. THE LATEST AVAILABLE PLUME OF NINO3.4 SST FORECASTS FROM IRI INDICATES LARGE AND INCREASING SPREAD THROUGH OCT-NOV-DEC (OND) 2018. THE STATISTICAL MODEL FORECAST AVERAGE MAINTAINS ENSO-NEUTRAL CONDITIONS THROUGH THIS OND 2018 PERIOD WHILE THE DYNAMICAL MODEL AVERAGE INCREASES NINO3.4 SSTS SLIGHTLY MORE RAPIDLY DURING THE SUMMER AND ENTERS WEAK EL NINO TERRITORY (NINO3.4 ANOMALY GREATER THAN 0.5 DEGREES C) NEAR OR BY OND 2018. AN INTERESTING OUTLIER TO THIS, IS THE CFS WHICH MAINTAINS LA NINA OR NEAR LA NINA CONDITIONS THROUGH OND 2018 WITH LARGE SPREAD. MOST OF THE REMAINING MODELS FROM THE NMME SUITE MIMIC SIMILAR BEHAVIOR AS THAT SHOWN BY THE IRI DYNAMICAL MODEL AVERAGE.
30-DAY OUTLOOK DISCUSSION FOR APRIL 2018
THE MADDEN JULIAN OSCILLATION (MJO) HAS WEAKENED CONSIDERABLY DURING THE PAST FEW WEEKS, WITH THE ENHANCED CONVECTIVE PHASE CURRENTLY LOCATED OVER THE EASTERN INDIAN OCEAN. DURING THE NEXT TWO WEEKS, THE MJO IS PREDICTED TO WEAKEN FURTHER, AND ITS EFFECTS ON THE U.S. TEMPERATURE AND PRECIPITATION OUTLOOKS FOR APRIL ARE CONSIDERED MINIMAL.
Temperature
THE TEMPERATURE OUTLOOK FOR APRIL 2018 DEPICTS ELEVATED ODDS FOR BELOW NORMAL TEMPERATURES OVER SOUTHEASTERN MAINLAND ALASKA AND THE PANHANDLE, AND FROM WASHINGTON STATE EASTWARD ACROSS THE NORTHERN ROCKIES, THE NORTHERN PLAINS (PERHAPS AS FAR SOUTH AS NEBRASKA), AND MUCH OF THE UPPER MISSISSIPPI VALLEY. THIS AREA OF FAVORED BELOW NORMAL TEMPERATURES HAS BROAD SUPPORT FROM THE CALIBRATED AND UNCALIBRATED NMME ENSEMBLE MEAN, CFS, CA-SST, AND DECADAL TRENDS. OFTEN DURING THE WANING STAGES OF A LA NINA, THE ANOMALOUS COLD SIGNAL OVER THE NORTH-CENTRAL CONUS SHIFTS FARTHER WEST INTO THE PACIFIC NORTHWEST, LENDING ADDITIONAL SUPPORT TO THE TEMPERATURE OUTLOOK. THE GREATEST PROBABILITIES FOR BELOW NORMAL TEMPERATURES, IN EXCESS OF 50 PERCENT, ARE FORECAST OVER NORTH DAKOTA AND SMALL PORTIONS OF NEIGHBORING STATES. ABOVE NORMAL TEMPERATURES ARE FAVORED ACROSS APPROXIMATELY THE SOUTHERN HALF AND EASTERN THIRD OF THE CONUS, BASED IN LARGE PART ON THE NMME, CFS, DECADAL TEMPERATURE TRENDS, AND TO A LESSER DEGREE, THE CA-SST. THE NMME (ESPECIALLY THE CALIBRATED VERSION) AND THE CFS ALSO PREDICT A RELATIVE WEAKNESS IN THE PREDICTED ANOMALOUS WARMTH FROM APPROXIMATELY THE EASTERN CORN BELT AREA EASTWARD ACROSS THE OHIO AND TENNESSEE VALLEYS, THE MID-ATLANTIC AND NORTHEAST. A FEW OF THE MORE RECENT CFS RUNS, INCLUDING TODAY’S SOLUTION, CAST DOUBT ON HIGHER PROBABILITIES FOR ABOVE NORMAL TEMPERATURES OVER THE NORTHEAST CONUS. ACCORDINGLY, ONLY MODEST TILTS IN THE PROBABILITIES FOR ABOVE NORMAL TEMPERATURES ARE FORECAST FOR THE NORTHEAST. ABOVE NORMAL TEMPERATURES ARE ALSO FAVORED OVER WESTERN ALASKA, SUPPORTED BY THE NMME AND LATEST FEW RUNS OF THE CFS, CA-SST, RELATIVELY WARM COASTAL SSTS, AND REDUCED SEA ICE COVERAGE RELATIVE TO NORMAL (NORTHWESTERN ALASKA). THE GREATEST ODDS FOR ABOVE NORMAL TEMPERATURES ARE INDICATED OVER THE BERING SEACOAST OF ALASKA, AND ALONG THE SOUTHERN TIER OF THE CONUS (BOTH IN EXCESS OF 50 PERCENT).
Precipitation
THE PRECIPITATION OUTLOOK FOR APRIL 2018 FAVORS ABOVE NORMAL PRECIPITATION OVER WESTERN AND NORTHERN ALASKA, FROM THE NORTHERN ROCKIES TO MINNESOTA, AND FROM NORTHEASTERN ARKANSAS NORTHEASTWARD TO SOUTHEASTERN MICHIGAN. THE RELATIVE WETNESS FAVORED IN WESTERN AND NORTHERN ALASKA IS SUPPORTED PRIMARILY BY THE LAST 9 RUNS OF THE CFS, AND TO A LESSER EXTENT, THE CA-SST. THE FAVORED ABOVE NORMAL PRECIPITATION FROM THE NORTHERN ROCKIES EASTWARD TO MINNESOTA, AND FROM NORTHEASTERN ARKANSAS NORTHEASTWARD TO SOUTHEASTERN MICHIGAN IS SUPPORTED TO VARIOUS DEGREES BY THE CAS TOOL, THE NMME (ESPECIALLY UNCALIBRATED VERSION), CFS, CA-SST (OHIO VALLEY AREA), AND OBSERVED SOIL MOISTURE ANOMALIES FOR THE PAST 30-DAYS FOR MOST OF THESE AREAS. ODDS ARE TILTED TOWARDS BELOW NORMAL PRECIPITATION ACROSS SOUTHEASTERN MAINLAND ALASKA AND THE PANHANDLE REGION, MOST OF CALIFORNIA AND NEVADA, SOUTHWESTERN UTAH, ARIZONA, MOST OF NEW MEXICO, AND APPROXIMATELY THE SOUTHWESTERN HALF OF TEXAS. ODDS OF BELOW NORMAL PRECIPITATION ARE ALSO ELEVATED OVER MUCH OF THE SOUTHERN ATLANTIC COAST REGION. SUPPORT FOR THESE REGIONS OF ANTICIPATED BELOW NORMAL PRECIPITATION COMES FROM THE NMME, CFS, CA-SST (ALASKA COAST ONLY), APRIL CLIMATOLOGY, AND RECENT SOIL MOISTURE CONDITIONS (CONUS). THE HIGHEST CHANCES (IN EXCESS OF 50 PERCENT) FOR THE PRECIPITATION OUTLOOK ARE DEPICTED OVER CENTRAL AND SOUTHERN FLORIDA (FOR BELOW NORMAL PRECIPITATION), IN PART DUE TO APRIL BEING THE PEAK OF THE CLIMATOLOGICAL DRY SEASON FOR THIS AREA.
PROGNOSTIC TOOLS USED FOR U.S. TEMPERATURE AND PRECIPITATION LONG-LEAD OUTLOOKS
ALTHOUGH LA NINA IS WEAKENING IN ITS REPRESENTATION IN BOTH THE OCEAN AND ATMOSPHERE, LA NINA AND ITS ASSOCIATED FOOTPRINT FROM WINTER TEMPERATURE AND PRECIPITATION ANOMALIES ARE STILL CONSIDERED IN PREPARATION OF THE AMJ 2018 OUTLOOK. THESE FOOTPRINTS INCLUDE ANOMALOUS SOIL MOISTURE AND SNOWPACK IN SOME AREAS OF THE CONTIGUOUS UNITED STATES. A HOST OF BOTH STATISTICAL AND DYNAMICAL MODEL OBJECTIVE FORECAST TOOLS WERE ALSO UTILIZED. SOME PRIMARY INPUTS FROM THIS LIST INCLUDED A BASELINE TOOL COMBINING THE INFLUENCES OF ENSO AND DECADAL TEMPERATURE [Editor’s Note: Global Warming] TRENDS (TEMPERATURE ONLY) ANCHORED TO THE CPC NINO3.4 SST CONSOLIDATION FORECAST THROUGHOUT THIS ENTIRE OUTLOOK PERIOD (AMJ 2019), LONG TERM TRENDS (OCN) DIRECTLY, AS WELL AS BIAS-CORRECTED, CALIBRATED MODEL OUTPUT FROM THE NMME SUITE OF DYNAMICAL MODELS.
Three-Month April-May-June Outlook
Temperature
THE MAJORITY OF THE COUNTRY IS FAVORED TO SEE ABOVE NORMAL TEMPERATURES DURING THE AMJ 2018 PERIOD. THIS INCLUDES PORTIONS OF NORTHERN AND WESTERN ALASKA AND MOST OF THE CONTIGUOUS U.S. EXCEPT AREAS OF THE NORTHERN ROCKIES WHICH IS THE ONLY REGION LEANING TOWARD BELOW NORMAL TEMPERATURES THIS SPRING. A NUMBER OF FACTORS LEAD TO THE AMJ 2018 FORECAST AND INCLUDE WEAK AND/OR RESIDUAL LA NINA IMPACTS, SIGNALS FROM BOTH OBJECTIVE STATISTICAL AND DYNAMICAL MODEL FORECAST GUIDANCE AND DECADAL TEMPERATURE TRENDS. THE GREATEST CONFIDENCE IN THE AMJ 2018 OUTLOOK IS ACROSS THE SOUTHERN TIER WHERE INFLUENCES FROM LA NINA, OVERWHELMING CONSISTENCY IN DYNAMICAL MODEL GUIDANCE AND STATISTICAL TOOLS, LONG TERM TRENDS, SOIL MOISTURE DEFICITS ALL COINCIDED AND FAVOR WARMER THAN NORMAL CONDITIONS. THE PROBABILITIES FOR ABOVE NORMAL TEMPERATURES ARE TEMPERED SOMEWHAT (ALTHOUGH STILL REFLECT ENHANCED ODDS FOR ABOVE NORMAL TEMPERATURES) FOR SOME AREAS IN THE GREAT LAKES, OHIO VALLEY AND TENNESSEE VALLEY DUE TO POSITIVE SOIL MOISTURE DEPARTURES FROM RECENT HEAVY PRECIPITATION WHICH MAY HAVE A LINGERING COOLING IMPACT THAT SOMEWHAT DECREASES THE ODDS OF WARMER THAN NORMAL CONDITIONS. ANOMALOUS SNOWPACK AND SUPPORT FROM STATISTICAL FORECAST GUIDANCE FAVOR THE RELATIVELY SMALL REGION OF BELOW NORMAL TEMPERATURES IN THE FAR NORTHERN ROCKIES. ANOMALOUSLY WARMER THAN AVERAGE AND OPEN WATERS IN PROXIMITY TO COASTAL AREAS OF ALASKA FAVOR ABOVE NORMAL TEMPERATURES THERE IN ADDITION TO OTHER FORECAST GUIDANCE.
THE GENERAL THEME OF THE DEPICTION AND EVOLUTION OF THE TEMPERATURE OUTLOOKS WITH THIS FORECAST PACKAGE FOLLOWED IN GENERAL TERMS THE BASELINE GUIDANCE THAT OBJECTIVELY COMBINES ENSO AND DECADAL TEMPERATURE TRENDS KEYED TO THE CPC NINO3.4 SST CONSOLIDATION FORECAST. THIS APPROACH IS ADJUSTED AND REINFORCED WHERE NECESSARY AT EARLY LEADS BY THE NMME DYNAMICAL MODEL BIAS CORRECTED, CALIBRATED FORECAST GUIDANCE.
Precipitation
THE AMJ 2018 PRECIPITATION OUTLOOK HIGHLIGHTS ANTICIPATED DRIER-THAN-NORMAL CONDITIONS FROM THE WEST COAST SOUTHEASTWARD TO TEXAS AND PROSPECTS FOR ABOVE NORMAL PRECIPITATION FOR A REGION GENERALLY CENTERED ACROSS THE GREAT LAKES BUT EXTENDING BOTH EAST AND WEST TO THE NORTHEAST AND NORTHERN PLAINS RESPECTIVELY. BOTH AREAS SHOW MODEST PROBABILITIES AND SO DEPICT ONLY MODERATE CONFIDENCE. BOTH AREAS IN LARGE EXTENT ARE SUPPORTED BY RESIDUAL LA NINA CONDITIONS DURING THE EARLY PORTION OF THE AMJ 2018 OUTLOOK PERIOD. BELOW NORMAL PRECIPITATION IN THE SOUTHWEST QUARTER OF THE CONTIGUOUS U.S. IS ALSO SUPPORTED BY NMME DYNAMICAL MODEL GUIDANCE WHILE WETTER-THAN NORMAL CONDITIONS HIGHLIGHTED ARE CONSISTENT WITH LONG TERM PRECIPITATION TRENDS.
BELOW NORMAL PRECIPITATION IS FORECAST DURING AMJ 2018 FOR A SMALL AREA FOR THE SOUTH COAST OF ALASKA. WETTER-THAN-NORMAL CONDITIONS ARE HIGHLIGHTED FOR THE NORTHERN TWO-THIRDS OF ALASKA . FOR ALASKA, THE ENHANCED LIKELIHOOD FOR BELOW- (ABOVE-NORMAL) PRECIPITATION DEPICTED ARE PRIMARILY SUPPORTED BY A RESIDUAL LA NINA INFLUENCE AND STATISTICAL FORECAST GUIDANCE.
PROGNOSTIC DISCUSSION OF OUTLOOKS – AMJ 2018 TO AMJ 2019 with a focus on time periods beyond AMJ
TEMPERATURE
ENSO-NEUTRAL CONDITIONS ARE FAVORED THROUGH THE SUMMER MONTHS INTO THE AUTUMN 2018 SO TRENDS AND NMME FORECAST GUIDANCE PLAYED THE LARGEST ROLES IN THE OUTLOOKS THROUGH AUG-SEP-OCT (ASO) 2018. MOST OF THE COUNTRY LEANS TOWARD ABOVE NORMAL TEMPERATURES THROUGH THIS PERIOD WITH THE GREATEST ODDS PRIMARILY LOCATED ACROSS THE WESTERN THIRD OF THE CONTIGUOUS U.S. AND ALONG THE EASTERN SEABOARD, ESPECIALLY THE NORTHEAST. STATISTICAL FORECAST GUIDANCE AND WEAK TEMPERATURE TRENDS TEND TO FOCUS ON THE INTERIOR CENTRAL U.S. AS A LOCATION WITH THE GREATEST UNCERTAINTY IN THE EVENTUAL CATEGORY OF SEASONAL MEAN TEMPERATURES BY JUL-AUG-SEP (JAS) AND ASO 2018.
THE TEMPERATURE OUTLOOKS THROUGH NOV-DEC-JAN (NDJ) 2018-2019 GENERALLY REMAINED UNCHANGED FROM THE PREVIOUS RELEASED PACKAGE IN MID-FEBRUARY.
THE LARGE SPREAD IN THE FORECAST PHASE OF ENSO BY NDJ 2018-2019 CONSIDERABLY INCREASES THE UNCERTAINTY IN EVENTUAL IMPACTS IN KEY AREAS WHERE TEMPERATURE TRENDS ARE LESS OF A FACTOR. CONSEQUENTLY, A LARGER AREA OF EQUAL CHANCES (EC) IS HIGHLIGHTED ON THE OUTLOOK MAP FROM THE PREVIOUS FORECAST PACKAGE FOR DEC-JAN-FEB (DJF) 2018-2019 AND JAN-FEB-MAR (JFM) 2019 IN A CORRIDOR FROM THE NORTHERN PLAINS TO THE SOUTHEAST. DECADAL TEMPERATURE TRENDS DOMINATE THE REMAINDER OF THE OUTLOOKS THROUGH AMJ 2019.
PRECIPITATION
THEREAFTER, THE OUTLOOKS FROM ASO 2018 ARE PRIMARILY BASED ON A COMBINATION OF NMME MODEL GUIDANCE AND LONG TERM PRECIPITATION TRENDS AS THE EXPECTATION OF ENSO NEUTRAL CONDITIONS WILL PREVAIL THROUGHOUT THIS PERIOD. UTILIZING THIS APPROACH, THE OUTLOOKS DEPICT AREAS WHERE BELOW NORMAL PRECIPITATION IS FAVORED IN AMJ 2018 TO GENERALLY MOVE NORTHWARD AND DECREASE IN COVERAGE BY JAS 2018. AREAS FAVORED TO RECEIVE ABOVE NORMAL PRECIPITATION ALSO DECREASE IN COVERAGE AND LATER FOCUS ALONG THE ATLANTIC SEABOARD BY ASO 2018.
DUE TO BELOW NORMAL SNOWPACK AND DRY CONDITIONS IN GENERAL ALONG WITH SOME MODEST DYNAMICAL MODEL GUIDANCE SUPPORT, ABOVE NORMAL PRECIPITATION WAS STRONGLY CONSIDERED FOR THE MONSOON SEASON IN THE SOUTHWEST U.S. AND CENTRAL ROCKIES DURING JAS AND ASO 2018. BUT GIVEN THE LARGE RANGE IN SOLUTIONS AND FORECAST TOOLS AT THE CURRENT TIME, THIS OUTLOOK MAINTAINS EQUAL CHANCES (EC) AS THE FORECAST IN THIS REGION AND SEASON AT THIS TIME.
STATISTICAL FORECAST GUIDANCE AND LONG TERM PRECIPITATION TRENDS ARE NOT STRONG AND CONSISTENT FOR MUCH OF THE REMAINDER OF THE OUTLOOK PACKAGE AND SO EQUAL CHANCES ARE INDICATED AT THESE LEAD TIMES. ALTHOUGH SOME WEAK SIGNALS ARE INDICATED IN THE WINTER SEASONS, THEY CURRENTLY OPPOSE THE MOST LIKELY PHASES OF ENSO (EL NINO OR ENSO-NEUTRAL) CURRENTLY BEING FORECAST AT THIS OUTLOOK TIME RANGE.
B. Now we begin our comparison of the NOAA and JAMSTEC Forecasts (Focus on next nine months i.e. three seasons)
In this Update, we compare the JAMSTEC temperature and precipitation forecast maps, which are for the World, with the NOAA temperature and precipitation forecast maps that cover only CONUS and Alaska. We do this primarily for educational purposes.
JAMSTEC works in three-month intervals which correspond to seasons and does not change the selection of months each time they update but does so every three months. At that time they drop one season and add another season further in the future. So for JAMSTEC we now have Spring (MAM 2018), Summer (JJA), and Fall (SON) to work with and we have the corresponding maps from NOAA except that NOAA does not issue a MAM map so we use their AMJ map which is ok since MAM and AMJ agree for two out of the three months. It is not ideal but JAMSTEC only provides three sets of maps and they only change every three months.
I show the NOAA Maps first followed by the JAMSTEC maps. I extract North America from the Worldwide JAMSTEC map and use that to compare with the NOAA Maps. I also extract Europe including parts of North Africa and Western Asia from the Worldwide JAMSTEC maps and include it in the summary table at the beginning of this article.
MAM for JAMSTEC, AMJ for NOAA 2018 (Spring)
Temperature
NOAA
And here is the MAM 2018 temperature forecast for North America that I extracted from the JAMSTEC World Forecast. To the left and smaller, I show the forecast from last month for the same time period. It has changed. The Northern Cool Anomaly is now Northwest rather than larger and Northeast.
 | | |
And now the JAMSTEC WORLD FORECAST (for this graphic my comments are mostly related to areas other than Alaska and CONUS as those comments appear with the larger graphics above)

Precipitation
NOAA
And here is the MAM 2018 Precipitation Forecast for North America that I extracted from the JAMSTEC World Forecast.
JAMSTEC WORLD FORECAST

Of interest, Europe is dry. So is Afghanistan, Iran and Pakistan. Australia is dry. South Africa is mainly dry with parts of East Africa wet. The Maritime Continent is dry.
Here is the precipitation forecast from Queensland Australia:

It is kind of amazing that you can make a worldwide forecast based on just one parameter the SOI and changes in the SOI. Basically it is an ENSO forecast just considering the state of ENSO as measured by the SOI. Western CONUS looks fairly wet, Eastern Australia is dry.
JJA (Summer)
Temperature
NOAA
And here is the JJA 2018 Temperature Forecast for North America that I extracted from the JAMSTEC World Forecast. On left is the forecast fo the same period but made last month..There has been some change as you can see.
 | | |
JAMSTEC WORLD FORECAST

Precipitation
NOAA
And here is the JJA 2018 Precipitation Forecast for North America that I extracted from the JAMSTEC World Forecast.
JAMSTEC WORLD FORECAST

SON 2018 (Fall)
Temperature
NOAA
And here is the SON 2018 Temperature Forecast for North America that I extracted from the JAMSTEC World Forecast. I show to the left and smaller, the forecast made last month. There is a huge change re the forecast for the West. .It has totally flipped.
|
|
| |

JAMSTEC WORLD FORECAST

The cool areas are Eastern Siberia, China, Northern Australia, Iran and Afghanistan, Venezuela, most of Brazil, Greenland. British Isles. the rest of Europe is warm.
Precipitation
NOAA
And here is the SON 2018 Precipitation Forecast for North America that I extracted from the JAMSTEC World Forecast
JAMSTEC WORLD FORECAST

C. An analysis of the forecasts for ENSO by NOAA and JAMSTEC and others including the Australian Bureau of Meteorology
A major driver of weather is Surface Ocean Temperatures. Evaporation only occurs from the Surface of Water. So we are very interested in the temperatures of water especially when these temperatures deviate from seasonal norms thus creating an anomaly. The geographical distribution of the anomalies is very important. To a substantial extent, the temperature anomalies along the Equator have disproportionate impact on weather so we study them intensely and that is what the ENSO (El Nino – Southern Oscillation) cycle is all about. Subsurface water can be thought of as the future surface temperatures. They may have only indirect impacts on current weather but they have major impacts on future weather by changing the temperature of the water surface. Winds and Convection (evaporation forming clouds) is weather and is a result of the Phases of ENSO and also a feedback loop that perpetuates the current Phase of ENSO or changes it. That is why we monitor winds and convection along or near the Equator especially the Equator in the Eastern Pacific.
Starting with Current Surface Conditions.
Here is the latest four-week Tropical Pacific Sea Surface Temperature (SST) Anomalies.


The full table of historical values can be found here.
This graphic brings the Nino 3.4 up to date and is easy to read.

This overlaps with the subsequent topic but I will show this first.

The discussion in this slide says it better than I could. One might compare the current reading to Oct/Nov 2016. The anomaly had returned to zero then reversed for a month and then returned to zero and now has gone positive. In retrospect it was the Kelvin Wave Activity e.g. the Upwelling Phase and the Active MJO which caused the brief reversal of the warming trend. No strong Active Phases of the MJO are forecast for this summer.
A side by side comparison can be useful
| Comparison Week Probably Third Week of December 2017 | Current Week |
|  |

Sea Surface Temperature and Anomalies
It is the ocean surface that interacts with the atmosphere and causes convection and also the warming and cooling of the atmosphere. So we are interested in the actual ocean surface temperatures and the departure from seasonal normal temperatures which is called “departures” or “anomalies”. Since warm water facilitates evaporation which results in cloud convection, the pattern of SST anomalies suggests how the weather pattern east of the anomalies will be different than normal.

A major advantage of the Hovmoeller method of displaying information is that it shows the history so I do not need to show a sequence of snapshots of the conditions at different points in time. This Hovmoeller provides a good way to visually see the evolution of this ENSO event. I have decided to use the prettied-up version that comes out on Mondays rather that the version that auto-updates daily because the SST Departures on the Equator do not change rapidly and the prettied-up version is so much easier to read. The bottom of the Hovmoeller shows the current readings. Remember the +5, -5 degree strip around the Equator that is being reported in this graphic. So it is the surface but not just the Equator.
This next graphic is more focused on the Equator and looks down to 300 meters rather than just being the surface.

We have two phases of a Kelvin Wave in operation. There is an up-welling phase at 120W and a down-welling phase at 175W. The up-welling phase is impacting areas east of the Nino 3.4 Measurement Area. The down-welling phase will impact the Nino 3.4 readings after a lag. The downwelling phase tends to cancel a La Nina and trigger an El Nino. The last El Nino had four or five Kelvin Waves and was the most powerful El Nino ever (recorded).
Let us look in more detail at the Equatorial Water Temperatures.
We are now going to look at a three-dimensional view of the Equator and move from the surface view and an average of the subsurface heat content to a more detailed view from the surface down This graphic provides both a summary perspective and a history (small images on the right).
.
Anomalies are strange. You can not really tell for sure if the blue area is colder or warmer than the water above or below. All you know is that it is cooler than usual for this time of the year. A later graphic will provide more information. Aside from buoyancy the currents tend to bring water from that depth up to the surface mostly farther east.
Now for a more detailed look. Below is the pair of graphics that I regularly provide. The date shown is the midpoint of a five-day period with that date as the center of the five-day period. The bottom graphic shows the absolute values, the upper graphic shows anomalies compared to what one might expect at this time of the year in the various areas both 130E to 90W Longitude and from the surface down to 450 meters. At different times I have discussed the difference between the actual values and the deviation of the actual values from what is defined as current climatology (which adjusts every ten years except along the Equator where it is adjusted every five years) and how both measures are useful for other purposes.
| There is cold water from 170W to 130W and it is mostly warmer further east. At the west end of the -1C cool anomaly it is now about 75 meters deep (it was once over 200 meters deep). We now have warm water with a maximum anomaly of +5C developing west of the Dateline and crossing the Dateline at depth to 140W, possibly the result of another Downwelling Kelvin Wave. La Nina’s days are numbered and it does not have much longer to go. The cold intrusion at 170E is interesting and reminds us that most likely we are headed for ENSO Neutral not El Nino. |
 |
| The 28C Isotherm is just west of the Dateline, the 27C Isotherm is at the Dateline, the 25C Isotherm is now east of 150W and in places at the surface further east. The 20C Isotherm no longer is reaching the surface. The Indo-Pacific Warm Pool is gradually moving East. |
The flattening of the Isotherm Pattern is an indication of ENSO Neutral just as the steepening of the pattern indicates La Nina or El Nino depending on where the slope shows the warm or cool pool to be. That flattening has occurred and we have gone to a Weak La Nina thermocline.
Tracking the change.
 |  |
And Now the Air Pressure to Confirm that the Atmosphere is Reacting to the Sea Surface Temperature Pattern. The most Common way to do that is to use an Index called the SOI.
This index provides an easy way to assess the location of and the relative strength of the Convection (Low Pressure) and the Subsidence (High Pressure) near the Equator. Experience shows that the extent to which the Atmospheric Air Pressure at Tahiti exceeds or is less than the Atmospheric Pressure at Darwin Australia when normalized is substantially correlated (positively or negatively at different locations) with the Precipitation Pattern of the entire World.
Current SOI Readings

SOI = 10 X [ Pdiff – Pdiffav ]/ SD(Pdiff) where Pdiff = (average Tahiti MSLP for the month) – (average Darwin MSLP for the month), Pdiffav = long term average of Pdiff for the month in question, and SD(Pdiff) = long term standard deviation of Pdiff for the month in question. So really it is comparing the extent to which Tahiti is more cloudy than Darwin, Australia. During El Nino we expect Darwin Australia to have lower air pressure and more convection than Tahiti (Negative SOI especially lower than -7 correlates with El Nino Conditions). During La Nina we expect the Warm Pool to be further east resulting in Positive SOI values greater than +7). The SOI has not been consistanly Positive but is right now.
The SOI fluctuates a lot.

To some extent it is the change in the SOI that is of most importance. It has been declining rapidly until recently. Most likely the return to higher values is related ot the MJO.
Forecasting the Evolution of ENSO
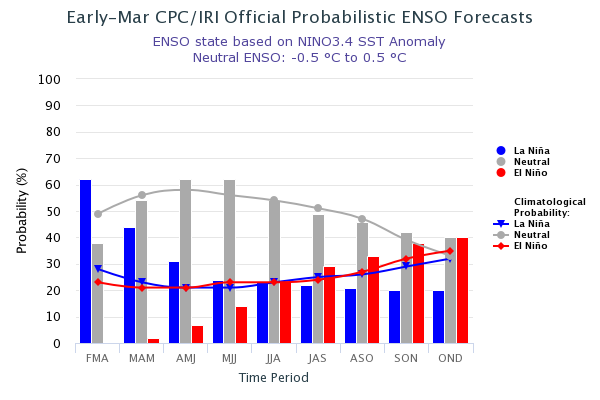
The CFS.v2 is not the only forecast tool used by NOAA. The CPC/IRI Analysis which is produced out of The International Research Institute (IRI) for Climate and Society at Columbia University is also very important to NOAA.
Here is the most recent update. It is quite dramatic. We should have a new update very soon.

This is the discussion
CPC/IRI ENSO Update, Published: March 08, 2018
El Niño/Southern Oscillation (ENSO) Diagnostic Discussion issued jointly by the Climate Prediction Center/NCEP/NWS and the International Research Institute for Climate and Society
ENSO Alert System Status: La Niña Advisory
Synopsis: A transition from La Niña to ENSO-neutral is most likely (~55% chance) during the March-May season, with neutral conditions likely to continue into the second half of the year.
During February 2018, La Niña weakened, but was still reflected by below-average sea surface temperatures (SSTs) in the east-central equatorial Pacific Ocean (Fig. 1). The latest weekly index values were -0.8°C and -0.6°C in the Niño-3.4 and Niño-3 regions, respectively, and were near zero in the surrounding Niño.4 and Niño1+2 regions. While negative anomalies were maintained near the surface, the sub-surface temperature anomalies (averaged across 180°-100°W) warmed to near zero. This warming was due to the eastward propagation of above-average temperatures along the thermocline in association with a downwelling equatorial oceanic Kelvin wave The atmospheric anomalies typical of La Niña weakened considerably across the tropical Pacific. Convection was suppressed near Indonesia and was only weakly enhanced over the far western Pacific. Also, low-level wind anomalies were westerly over the western and central Pacific, while upper-level winds remained anomalously westerly over the eastern Pacific. Overall, the ocean and atmosphere system suggests La Niña is weakening.
Most models in the IRI/CPC plume predict La Niña will decay and return to ENSO-neutral during the Northern Hemisphere spring 2018 . The forecast consensus similarly favors a transition during the spring, with a continuation of ENSO-neutral conditions through the summer. In summary, a transition from La Niña to ENSO-neutral is most likely (~55% chance) during the March-May season, with neutral conditions likely to continue into the second half of the year (click CPC/IRI consensus forecast for the chance of each outcome for each 3-month period).
This discussion is a consolidated effort of the National Oceanic and Atmospheric Administration (NOAA), NOAA’s National Weather Service, and their funded institutions. Oceanic and atmospheric conditions are updated weekly on the Climate Prediction Center web site (El Niño/La Niña Current Conditions and Expert Discussions). Forecasts are also updated monthly in the Forecast Forum section of CPC’s Climate Diagnostics Bulletin. Additional perspectives and analysis are also available in an ENSO blog.
The next ENSO Diagnostics Discussion is scheduled for 12 April 2018.
The above is based on looking at a variety of models and other information but we should not forget that NOAA has their own model.

Here is another view of the same model with on the right the forecasts of the sea surface temperatures that result from the forecast. It is the model as of March 11, 2018 and is frozen i.e. will not update.

And here is what is called the plume of a varied of forecast models. We expect to have an updated version of this graphic next week.

Forecasts from Other Meteorological Agencies.
Here is the JAMSTEC Model Forecast

And the recently released short discussion.
Mar. 16, 2018 Prediction from 1st Mar., 2018 ENSO forecast:
The La Niña-like condition will disappear by late spring. Then the tropical Pacific will return to a normal state by summer.
Indian Ocean forecast:
A normal state in the tropical Indian Ocean will persist in 2018.
Atlantic Ocean forecast:
The Atlantic Niño appears to develop in 2018.
Regional forecast:
On a seasonal scale, most part of the Eurasian Continent will experience a warmer-than-normal condition in spring and summer. In India, however, we expect colder-than-normal condition in summer. Northwestern U.S., western Canada, northern Brazil, Peru, Ecuador, western, eastern and southern Africa, and northern Australia will experience a colder-than-normal condition in boreal spring. This colder condition in northern Brazil and southern Africa will stay even in boreal summer.
As regards to the seasonally averaged rainfall, a wetter-than-normal condition is predicted for the Philippines, Indochina, northern India, eastern Africa, Mexico, eastern U.S. and northern Brazil during boreal spring, whereas western/central U.S., Europe, Iran, Indonesia, southern China, Australia, southern Africa, and southern Brazil will experience a drier-than-normal condition during boreal spring. This drier condition will stay in Europe, central U.S., southeastern Australia, and Indonesia in summer.
Most part of Japan will experience warmer and wetter-than-normal conditions in spring and summer; we expect an active rainy season in 2018.
Here is the Nino 3.4 report from the Australian BOM (it updates every two weeks)

And the ENSO Outlook Discussion Issued on March 13, 2018
La Niña ends, El Niño-Southern Oscillation returns to neutral
The 2017–18 La Niña has ended. El Niño–Southern Oscillation (ENSO) indicators have eased back to neutral levels over the past several weeks. This means the ENSO Outlook has shifted from LA NIÑA to INACTIVE.
The end of the La Niña is clear in oceanic and atmospheric indices. Sea surface temperatures have warmed steadily since December, and are now in the neutral range. Waters beneath the surface have also warmed. In the atmosphere, cloudiness near the Date Line has returned to near-average levels, and trade winds are generally near average across the equatorial Pacific. Likewise, the Southern Oscillation Index (SOI) is well within the neutral range.
All eight of the surveyed international climate models indicate equatorial Pacific sea surface temperatures are likely to continue to warm over the coming months. Only one model anticipates NINO3.4 will meet La Niña thresholds for May, and all models predict ENSO will be in a neutral phase during the southern hemisphere winter.
All eight of the surveyed international climate models indicate equatorial Pacific sea surface temperatures are likely to continue to warm over the coming months. Only one model anticipates NINO3.4 will meet La Niña thresholds for May, and all models predict ENSO will be in a neutral phase during the southern hemisphere winter.
However, model accuracy during autumn is lower than at other times of year. A neutral ENSO pattern does not necessarily signify average rainfall and temperature for Australia. Rather, it indicates a reduced chance of prolonged very wet or dry, or very hot or cold conditions, and that other climate drivers may have greater influence over the coming months.
The weak and short–lived La Niña had relatively little effect on Australian rainfall patterns over the 2017–18 summer. However, it may have kept temperatures higher than average in southern parts of the country due to weather patterns being slower moving, and further south than normal.
Indian Ocean IOD (It updates every two weeks)

Indian Ocean Dipole Outlook Discussion Issued March 13, 2018
The Indian Ocean Dipole (IOD) is neutral. The weekly index value to 11 March was +0.23 °C. All six of the climate models surveyed by the Bureau indicate that the IOD will remain neutral into the southern hemisphere winter of 2018.
The influence of the IOD on Australian climate is weak during December to April. This is because the monsoon trough shifts south over the tropical Indian Ocean changing wind patterns, which prevents the IOD pattern from being able to form.
The IOD Forecast is indirectly related to ENSO but in a complex way. It is important to understand how and where the IOD is measured.

IOD Positive is the West Area being warmer than the East Area (with of course many adjustments/normalizations). IOD Negative is the East Area being warmer than the West Area. Notice that the Latitudinal extent of the western box is greater than that of the eastern box. This type of index is based on observing how these patterns impact weather and represent the best efforts of meteorological agencies to figure these things out. Global Warming may change the formulas probably slightly over time but it is costly and difficult to redo this sort of work because of long weather cycles.
Some Housekeeping Issues.
If you are reading this Update Report and wish to transfer to the Current Weather and Climate Report, Click Here for the list of Weather Posts. That link takes you to the archive of all weather articles written by Sig Silber so you can see if the new Weekly Weather Report has been published go there or back to an earlier report but please keep in mind that the graphics in earlier reports in some cases auto-update and the text may no longer apply to the graphics shown. Remember, if you leave this page to visit links provided in this article, you can return by hitting your “Back Arrow”, usually top left corner of your screen just to the left of the URL box. The next Regular Weekly Weather and Climate Report will be published on Monday March 19, 2018. It will as usual focus on the next twenty-five days.


