Written by Sig Silber
The main focus of this report is the NOAA March, Three-Month and 15-Month Forecasts, the JAMSTEC Three-Season Forecast, and a comparison of the JAMSTEC with the NOAA forecast. The differences in the forecasts for Alaska and CONUS are quite stunning. In this report, we provide a detailed analysis for both Alaska and CONUS and also using the JAMSTEC Maps the Rest of the World as well.

Please share this article – Go to very top of page, right hand side for social media buttons.
THE CPC SST-CONSOLIDATION FORECAST, WHICH INCLUDES THE CONSTRUCTED ANALOG, MARKOV, AND CANONICAL CORRELATION ANALYSIS STATISTICAL FORECASTS, ALONG WITH THE CFS DYNAMICAL MODEL FORECAST, PREDICTS A TRANSITION FROM LA NINA TO ENSO-NEUTRAL CONDITIONS IS LIKELY DURING SPRING 2018 WITH ENSO-NEUTRAL CONDITIONS MOST LIKELY FOR MAM 2018 AND SEASONS THAT FOLLOW. MOST ENSEMBLE MEMBERS OF THE NORTH AMERICAN MULTI-MODEL ENSEMBLE (NMME) PREDICT THE NINO 3.4 SST ANOMALY TO BE BETWEEN -0.5 AND 0.5 C, INDICATING LIKELY ENSO-NEUTRAL CONDITIONS, BY APRIL 2018. THE NMME-MEAN NINO 3.4 TEMPERATURE ANOMALY IS BETWEEN 0.0 C AND 0.5 C FROM JUNE THROUGH SEPTEMBER 2018. BASED ON THE LATEST OBSERVATIONS AND MODEL FORECASTS, THE OFFICIAL CPC/IRI ENSO CONSENSUS INDICATES THAT ENSO-NEUTRAL CONDITIONS ARE MOST LIKELY FOR THE MAM 2018 SEASON AND THEREAFTER, WITH PROBABILITIES EXCEEDING 50 PERCENT THROUGH JJA 2018.
This report is organized into a summary that has two tables of graphics that show the temperature and precipitation forecasts for the upcoming three seasons, A brief discussion of the ENSO assumptions by both NOAA and JAMSTEC and then a lengthy analysis which is organized into three parts:
A. A full discussion of the recent NOAA Seasonal Outlook
B. A comparison between the NOAA and JAMSTEC Forecasts.
C. A detailed analysis of the forecasts for ENSO by NOAA and JAMSTEC and others including the Australian Bureau of Meteorology and other factors influencing the forecasts.
For those who want a quick synopsis of the two forecasts, below is a summary of the temperature and precipitation forecasts for three time-periods and from left to right the NOAA forecast for Alaska and CONUS (the contiguous mid-latitude U.S), then JAMSTEC for North America (which includes Canada and Northern Mexico), and then JAMSTEC for Europe and surrounding areas. Larger graphics are provided later in the report. It is kind of a tease to keep you reading but you can see the evolution of the weather pattern through Spring, Summer and into Fall. For some readers, these two sets of summary graphics may be all the information they wish to look at and that is fine.
Temperature
| NOAA Alaska Plus CONUS | JAMSTEC North America | JAMSTEC Europe | |
MAM Spring Temp |  |  |  |
JJA Summer Temp |  |  |  |
SON FALL Temp |  |  |  |
Precipitation
| NOAA Alaska Plus CONUS | JAMSTEC North America | JAMSTEC Europe | |
MAM Spring Precip |  |  |  |
JJA Summer Precip |  |  |  |
SON Fall Precip |  |  |  |
This is a summary of the ENSO forecasts of the two agencies. But the CFSv2 is not the only tool NOAA uses but the JAMSTEC Nino 3.4 forecast is input to their forecasting model.
| NOAA CFSv2* | JAMSTEC |
 |  |
| This model keeps us in La Nina or near La Nina Conditions indefinitely | JAMSTEC stays in ENSO Neutral into 2020. But in the short term, the slope of the Nino 3.4 Index is sharply positive moving promptly into ENSO Neutral and close to Nino 3.4 being slightly warm but very close to pure Neutral. It remains this way in this month’s forecast for about a year Spring to Spring. |
| The JAMSTEC forecast extends to early 2020 so it may be confusing comparing it to the NOAA forecast that only goes out to SON 2018. The right is a shorter version of the JAMSTEC forecast. It makes comparison a bit easier. |  |
* NOAA relies on a variety of forecasts including the CPC/IRI forecast which we discuss in Section C. JAMSTEC uses the above in developing their forecast Maps.
 |  |
Updates from JAMSTEC can be found here. Updates from NOAA can be found here. You have to look for the SST row and go to the right where it says “normalized with mask” and click on E3 which provides the latest model run..
The key is the so-called cold tongue (shown in blue) extending west from Ecuador. Do not be fooled by the differences in how the two agencies use color to show the Sea Surface Temperature Anomalies. So we would expect that the two Agencies would be viewing SSTA in a very similar way and in general they are. So for MAM the estimate of Nino 3.4 and the short term forecast of SST’s is very similar. That changes in subsequent seasons.
A. Focus on the NOAA Update
A note about terminology; the deviations from climatology/normal are color coded but also labeled “A” for more than (above) normal and “B” for less than (below) normal. The area designated EC means Equal Chances of being more or less than normal. JAMSTEC relies on their color coding. In my comments I have used EC to cover all the situations where a clear anomaly is not shown. So the words “warm”, “cool”, “wet”, “dry” should be generally interpreted as being relative to climatology/normal for that location and time of year.
First we will take a look at the NOAA Early Outlook for March 2018. It is called the Early Outlook because it will be updated at the end of February. Only the March Outlook will be updated at that time.
Temperature

Precipitation

We have nothing to compare these maps with as NOAA does not in their Update provide a forecast for each of the subsequent two months separate from their three-month forecast. Thus I do not have previously forecasted maps for March from the previous NOAA Report to compare against. And the current month is not over so we can not really compare the forecast for next month against the actual for this month. It is probably best to just try to understand what NOAA is trying to convey about March which can be summarized as for temperature, the Northeast, South Florida, and Southwest will be warm and the Northern Tier from west of the Great Lakes to the West Coast will be cool. Northern Alaska will be warm. For precipitation, the anomalies are smaller and map against temperature to some extent except for the Tennessee River Valley wet anomaly.
I do not usually do this but I think it is useful to compare the Monthly maps issued on Thursday February 15 with the two week maps for March 3 – 16 issued the following day by another part of NOAA.
| Temperature | Precipitation | |
| Monthly Map | | |
| March 3 -16 |  |  |
Now we consider the three-month Outlook.
Notice that the three-month periods are abbreviated e.g. March/April/May is shown as MAM. You will see such abbreviations often in this report.
Prior Temperature Outlook for MAM 2018

New Temperature Outlook for MAM 2018
Prior Precipitation Outlook for MAM 2018

New Precipitation Outlook for MAM 2018

Now let us focus on the long-term situation and compare the new set of maps with the maps issued on January 18, 2018.
Prior 14 Month Temperature Outlook: MAM 2018 – FMA 2019

New 14 Month Temperature Outlook: AMJ 2018 – MAM 2019

To compare maps from one release to another, one needs to remember that the new release drops one three-month period and adds a later one. So to make the comparisons one has to shift the new maps to the right one position and that makes the map on the right drop down to become the left-most map in the next level. I do not have a computer software tool for doing that for you so you have to do it mentally. When I do the comparison, I print the two sets of maps and put them side by side and number the same three-month maps 1, 2, 3,…..,11 in both sets of maps to make it easier for me to easily compare the same three-month period in the new with the previous forecast. One uses the same procedure to compare the precipitation maps. Based on this procedure, I conclude that:
Now Precipitation
Prior 14 Month Precipitation Outlook: MAM 2018 – FMA 2019

New 14 Month Precipitation Outlook: AMJ 2018 – MAM 2019

If you want larger versions of each map (temperature and precipitation) you can find them here. And then each of those maps can be clicked on to further enlarge them.
Sometimes it is useful to compare the three-month outlook to the forecast for the first of the three months. It shows how much the pattern changes over the three-month period.

One can mentally subtract the First-Month Outlook from the Three-month Outlook and create the Outlook for the last two months in the three-month period.
*The concept is that the probabilities of a deviation from climatology in the First Month and the combined Month Two and Three forecast that one derives must average out to the probabilities shown in the three-month maps.
NOAA Discussion
Below are excerpts (significantly reorganized and with a lot of the redundancy and discussion of methodology removed) from the Discussion released by NOAA on February 15, 2018. Headings that are “Initial Cap” only rather than all caps were added by the Author of this Update Report for clarity. Also we have organized the sequence of the sections of NOAA Discussion to first present the Atmospheric and Oceanic Conditions and then the Initial Month, the Three or Four-month period, and finally the remainder of the 15 Month Forecast. We think that sequence with the three- to four-month period broken out separately, makes the discussion more useful for more readers.
SUMMARY OF THE OUTLOOK FOR NON-TECHNICAL USERS
CURRENT ATMOSPHERIC AND OCEANIC CONDITIONS
OCEANIC OBSERVATIONS INDICATE THAT LA NINA CONDITIONS CONTINUED THROUGH JANUARY INTO EARLY FEBRUARY, AS CENTRAL AND EASTERN EQUATORIAL SST ANOMALIES ARE NEGATIVE FROM THE DATE LINE TO THE SOUTH AMERICAN COAST. THE LATEST WEEKLY NINO 3.4 TEMPERATURE ANOMALY WAS -0.9 C. NEGATIVE SUB-SURFACE TEMPERATURE ANOMALIES IN THE CENTRAL AND EAST-CENTRAL EQUATORIAL PACIFIC WEAKENED IN EARLY JANUARY AND STRENGTHENED AGAIN IN LATE JANUARY AND EARLY FEBRUARY, WITH ANOMALOUSLY WARM WATER AT DEPTHS OF GREATER THAN 200 METERS IN THE WESTERN PACIFIC. THE MOST RECENT THREE MONTH MEAN TEMPERATURE ANOMALY FOR THE NINO 3.4 REGION, FOR NOVEMBER 2017 THROUGH JANUARY 2018, IS -1.0 C.
RECENT ATMOSPHERIC CONDITIONS OVER THE TROPICAL PACIFIC OCEAN ARE ALSO CONSISTENT WITH LA NINA, WITH SUPPRESSED CONVECTION NEAR THE INTERNATIONAL DATE LINE AND ENHANCED CONVECTION OVER THE MARITIME CONTINENT. UPPER-LEVEL WINDS AT 200-HPA ARE ANOMALOUSLY WESTERLY OVER THE CENTRAL AND EASTERN PACIFIC.
THE MADDEN JULIAN OSCILLATION (MJO) IS ACTIVE WITH ENHANCED CONVECTION OVER THE WESTERN PACIFIC. DYNAMICAL MODELS FORECAST THE ACTIVE PHASE OF THE MJO TO PROPAGATE EASTWARD AND WEAKEN IN THE NEXT COUPLE WEEKS. THE ACTIVE MJO IS EXPECTED TO HAVE AN IMPACT ON TEMPERATURES FOR NORTH AMERICA IN MARCH. THE IMPACT OF MJO ON THE FORECAST DECREASES IN APRIL AND MAY WITH GREATER UNCERTAINTY.
PROGNOSTIC DISCUSSION OF SST FORECASTS
THE CPC SST-CONSOLIDATION FORECAST, WHICH INCLUDES THE CONSTRUCTED ANALOG, MARKOV, AND CANONICAL CORRELATION ANALYSIS STATISTICAL FORECASTS, ALONG WITH THE CFS DYNAMICAL MODEL FORECAST, PREDICTS A TRANSITION FROM LA NINA TO ENSO-NEUTRAL CONDITIONS IS LIKELY DURING SPRING 2018 WITH ENSO-NEUTRAL CONDITIONS MOST LIKELY FOR MAM 2018 AND SEASONS THAT FOLLOW. MOST ENSEMBLE MEMBERS OF THE NORTH AMERICAN MULTI-MODEL ENSEMBLE (NMME) PREDICT THE NINO 3.4 SST ANOMALY TO BE BETWEEN -0.5 AND 0.5 C, INDICATING LIKELY ENSO-NEUTRAL CONDITIONS, BY APRIL 2018. THE NMME-MEAN NINO 3.4 TEMPERATURE ANOMALY IS BETWEEN 0.0 C AND 0.5 C FROM JUNE THROUGH SEPTEMBER 2018. BASED ON THE LATEST OBSERVATIONS AND MODEL FORECASTS, THE OFFICIAL CPC/IRI ENSO CONSENSUS INDICATES THAT ENSO-NEUTRAL CONDITIONS ARE MOST LIKELY FOR THE MAM 2018 SEASON AND THEREAFTER, WITH PROBABILITIES EXCEEDING 50 PERCENT THROUGH JJA 2018.
30-DAY OUTLOOK DISCUSSION FOR MARCH 2018
LA NINA CONDITIONS CONTINUE INTO MID-FEBRUARY, WITH NEGATIVE SST ANOMALIES OBSERVED ACROSS THE CENTRAL AND EASTERN PACIFIC OCEAN FROM NEAR THE DATE LINE TO THE COAST OF SOUTH AMERICA. THE COUPLED ATMOSPHERIC RESPONSE TO LA NINA REMAINS READILY OBSERVED, WITH POSITIVE OLR ANOMALIES DUE TO REDUCED CONVECTION NEAR THE DATE LINE AND NEGATIVE OLR ANOMALIES DUE TO ENHANCED CONVECTION OVER PARTS OF THE MARITIME CONTINENT. THE MJO REMAINED ACTIVE OVER THE PAST SEVERAL WEEKS; THE ENHANCED PHASE PROPAGATED ACROSS THE WEST PACIFIC OF LATE AND EASTWARD PROPAGATION HAS SLOWED. THE CURRENT MJO STATE FAVORS BELOW-NORMAL TEMPERATURES OVER MUCH OF THE CONUS IN EARLY MARCH. ADDITIONALLY, A SUDDEN STRATOSPHERIC WARMING OCCURRED ON FEBRUARY 12. EMPIRICALLY, THIS FAVORS A MODEST SHIFT IN THE LOW-FREQUENCY AO TOWARD THE NEGATIVE PHASE. THE RECENT RUNS OF THE GEFS AND CFS FORECAST A TRANSITIONS TOWARD A STRONGLY NEGATIVE AO REGIME, WITH HIGH-LATITUDE BLOCKING FORECAST NEAR THE DAVIS STRAIT. THE ECWMF SHOWS A SIMILAR EVOLUTION, BUT WITHOUT THE ASSOCIATED TELECONNECTION PATTERN OVER THE EASTERN CONUS. DYNAMICAL MODEL GUIDANCE INITIALIZED IN EARLY FEBRUARY SEEMS TO EMPHASIZE LA NINA AND LONG-TERM TRENDS, A REASONABLE STARTING PLACE FOR THE MARCH OUTLOOK.
Temperature
THE MARCH TEMPERATURE OUTLOOK STARTS WITH THE CALIBRATED DYNAMICAL MODEL GUIDANCE, BUT MAKES RATHER SUBSTANTIAL CHANGES BASED ON THE LATEST CFS FORECASTS AND EMPIRICAL FORECAST MODELS THAT ARE CONSISTENT WITH A STRONG NEGATIVE AO PROJECTION DURING THE EARLY PART OF THE MONTH. ANY MJO IMPACTS DURING THE SECOND HALF OF THE MONTH ARE A BIT OF A WILD CARD GIVEN UNCERTAINTY IN MJO EVOLUTION DURING LATE FEBRUARY AND EARLY MARCH.
THE MARCH TEMPERATURE OUTLOOK INDICATES INCREASES IN THE PROBABILITIES OF BELOW-NORMAL TEMPERATURES OVER MUCH OF THE NORTHWESTERN AND NORTH-CENTRAL CONUS, AND WITH REASONABLY LARGE PROBABILITIES FOR A 0.5-MONTH LEAD OUTLOOK. THIS SIGNAL IS CONSISTENT WITH LA NINA, EARLY MONTH MJO IMPACTS, AND A COMBINATION OF DYNAMICAL MODEL GUIDANCE. OVER THE FAR SOUTHERN AND EASTERN PARTS OF THE CONUS, ABOVE-NORMAL TEMPERATURES ARE FAVORED. THE SIGNAL IS STRONGEST OVER NEW ENGLAND WHERE THE LATEST MODEL GUIDANCE SUGGESTS THE HIGHEST PROBABILITIES. THIS IS ALSO CONSISTENT WITH TELECONNECTIONS UPON A BLOCKING PATTERN OVER DAVIS STRAIT. LONG-TRENDS AND LA NINA FAVOR ABOVE-NORMAL TEMPERATURES OVER THE SOUTHWEST, BUT THIS IS TEMPERED BY THE LATEST DYNAMICAL MODEL GUIDANCE THAT SUGGESTS A RELATIVELY COLD START TO THE MONTH. EQUAL CHANCES OF ABOVE-, NEAR-, AND BELOW-NORMAL TEMPERATURES IS FORECAST OVER A LARGE SWATH OF THE CONUS FROM THE SOUTH-CENTRAL U.S. EASTWARD. OVER THIS REGION THERE ARE CONFLICTING SIGNALS BETWEEN THE LOW-FREQUENCY TRENDS AND ENSO AND HIGHER-FREQUENCY AO AND MJO CONTRIBUTIONS. ABOVE-NORMAL TEMPERATURES ARE FAVORED OVER WESTERN ALASKA WHERE THE MAJORITY OF FORECAST TOOLS ARE IN GOOD AGREEMENT.
Precipitation
THE MARCH PRECIPITATION OUTLOOK, LIKE THE TEMPERATURE OUTLOOK, ATTEMPTS TO COMBINE THE INFLUENCE OF LA NINA WITH THE LATEST CFS GUIDANCE AND THE AO AND MJO FOOTPRINTS EARLY IN THE MONTH. ABOVE-NORMAL PRECIPITATION IS FAVORED OVER THE NORTHERN ROCKIES, AND EXTENDED EASTWARD INTO PARTS OF THE CENTRAL AND NORTHERN HIGH PLAINS. ABOVE-NORMAL PRECIPITATION IS ALSO FAVORED OVER PARTS OF THE INTERIOR SOUTHEAST; THIS REGION IS SHIFTED SOUTHEAST OF THE CANONICAL LA NINA FOOTPRINT BASED ON THE MJO AND AO. BELOW-NORMAL PRECIPITATION IS FAVORED ACROSS THE SOUTHERN TIER OF THE CONUS EXCEPT FOR MUCH OF THE GULF COAST. THIS IS BROADLY CONSISTENT WITH LA NINA AND BASED ON THE PREPONDERANCE OF DYNAMICAL MODEL GUIDANCE. EQUAL CHANCES IS FORECAST FOR LARGE SECTIONS OF THE CENTRAL AND EASTERN CONUS WHERE THE VARIOUS AFOREMENTIONED CLIMATE SIGNALS CONFLICT, AS DOES THE LATEST CFS WITH COUPLED MODEL INITIALIZED AT THE BEGINNING OF THE MONTH. ANOMALOUS RIDGING CENTERED JUST SOUTH OF ALASKA FAVORS A NORTHWARD SHIFTED STORM TRACK, AND THUS A NORTH-SOUTH DIPOLE IN PROBABILITIES FAVORING ABOVE- AND BELOW-NORMAL PRECIPITATION.
PROGNOSTIC TOOLS USED FOR U.S. TEMPERATURE AND PRECIPITATION OUTLOOKS
THE TEMPERATURE AND PRECIPITATION OUTLOOKS FOR MAM 2018 THROUGH JJA 2018 WERE PRIMARILY BASED ON DYNAMICAL MODEL GUIDANCE, INCLUDING THE NCEP CLIMATE FORECAST SYSTEM (CFS) AND THE NORTH AMERICAN MULTI-MODEL ENSEMBLE (NMME), AS WELL AS STATISTICAL GUIDANCE, INCLUDING A MODEL COMBINING REGRESSIONS OF TEMPERATURE/PRECIPITATION ON THE CPC SST-CONSOLIDATION OF NINO3.4 FORECASTS WITH DECADAL TRENDS. GUIDANCE FOR FMA 2018 THROUGH JAS 2018 WAS ALSO OBTAINED FROM A STATISTICAL-DYNAMICAL HYBRID MODEL THAT MERGES A STATISTICAL FORECAST OF TEMPERATURE/PRECIPITATION PROBABILITIES FROM NMME FORECASTS OF THE NINO 3.4 SST ANOMALY WITH CALIBRATED NMME TEMPERATURE/PRECIPITATION PROBABILITY FORECASTS. THE LONGER-LEAD OUTLOOKS, FROM ASO 2018 THROUGH MAM 2019, WERE BASED ON DECADAL TEMPERATURE/PRECIPITATION TRENDS, AS WELL AS THE CPC TEMPERATURE/PRECIPITATION CONSOLIDATION OF STATISTICAL FORECASTS.
Three Month March-April- May (and to some extent June
Temperature
ABOVE-NORMAL TEMPERATURES DURING MAM 2018 ARE MOST LIKELY ACROSS MUCH OF THE SOUTHERN HALF OF THE U.S., NORTHWARD UP THE ATLANTIC COAST TO MAINE, AS WELL AS WESTERN AND NORTHERN ALASKA. PROBABILITIES ARE GREATEST FOR THE SOUTHWEST AND SOUTHERN PLAINS, AS WELL AS FOR WESTERN AND NORTHERN REGIONS OF ALASKA, WHERE POSITIVE DECADAL TEMPERATURE TRENDS ARE LARGEST. BELOW-NORMAL TEMPERATURES ARE MORE LIKELY FOR PARTS OF THE PACIFIC NORTHWEST AND NORTHERN HIGH PLAINS, AS WELL AS SOUTHEASTERN MAINLAND ALASKA AND THE ALASKA PANHANDLE. THIS TEMPERATURE PATTERN IS CONSISTENT WITH IMPACTS OF CURRENT LA NINA CONDITIONS. AN ACTIVE MJO INCREASES THE PROBABILITIES OF BELOW-NORMAL TEMPERATURES OVER MUCH OF THE NORTHERN AND CENTRAL GREAT PLAINS IN MARCH, AND INCREASES THE UNCERTAINTY OF THE MARCH TEMPERATURE OUTLOOK OVER A LARGE PART OF THE EAST, AS INCREASED PROBABILITIES OF BELOW-NORMAL TEMPERATURES FROM MJO IMPACTS CONFLICT WITH INCREASED PROBABILITIES OF ABOVE-NORMAL TEMPERATURES IN THE SEASONAL OUTLOOK. AS A RESULT, PROBABILITIES OF ABOVE-NORMAL TEMPERATURES ARE MODERATED OVER THE EAST IN THE MAM 2018 OUTLOOK
Precipitation
THE MAM 2018 PRECIPITATION OUTLOOK INDICATES ELEVATED PROBABILITIES OF ABOVE-NORMAL PRECIPITATION FOR THE NORTHERN ROCKIES, EAST ACROSS THE NORTHERN GREAT PLAINS INTO THE MIDWEST, THE OHIO VALLEY AND THE NORTHEAST, AND SOUTH TO THE TENNESSEE VALLEY. INCREASED PROBABILITIES OF ABOVE-NORMAL PRECIPITATION ARE ALSO INDICATED FOR NORTHWESTERN ALASKA. BELOW-NORMAL PRECIPITATION IS MOST LIKELY FROM CALIFORNIA ACROSS THE GREAT BASIN AND SOUTHWEST INTO THE CENTRAL AND SOUTHERN GREAT PLAINS, AS WELL AS ALONG THE GULF COAST INTO FLORIDA. BELOW-NORMAL PRECIPITATION IS ALSO MOST LIKELY FOR THE SOUTHERN COAST OF ALASKA, INCLUDING THE ALEUTIAN ISLANDS AND THE ALASKA PANHANDLE.
THIS PRECIPITATION PATTERN IS CONSISTENT WITH THE PERSISTENT IMPACTS OF LA NINA. INCREASED PROBABILITIES OF ABOVE-NORMAL PRECIPITATION FOR THE NORTHEAST ARE SUPPORTED BY FORECASTS FROM THE NMME AND CFS DYNAMICAL MODELS, AS WELL AS STATISTICAL GUIDANCE BASED ON DECADAL TRENDS.
PROGNOSTIC DISCUSSION OF OUTLOOKS – MAM 2018 TO MAM 2019 (With a focus on months after MAM)
TEMPERATURE
THE AREA OF LIKELY ABOVE-NORMAL TEMPERATURES INCREASES THROUGH THE SON 2018 OUTLOOK, FOLLOWING CALIBRATED TEMPERATURE FORECASTS FROM THE NMME, LARGELY DUE TO DECADAL TRENDS AND A DIMINISHED ROLE OF ENSO IMPACTS. PROBABILITIES OF ABOVE-NORMAL TEMPERATURES HAVE INCREASED IN THE FEBRUARY SEASONAL OUTLOOKS THROUGH SON 2018, RELATIVE TO THE JANUARY SEASONAL OUTLOOKS, FOLLOWING GUIDANCE FROM THE CALIBRATED NMME FORECASTS AND FROM STATISTICAL ANALYSIS OF THE DECADAL TRENDS. ABOVE-NORMAL TEMPERATURES ARE NOW MOST LIKELY OVER A GREATER AREA OF THE CENTRAL AND UPPER MISSISSIPPI VALLEY FOR JJA THROUGH ASO 2018. THE SEASONAL OUTLOOKS FOR OND 2018 THROUGH MAM 2018 FOLLOW GUIDANCE FROM THE CPC CONSOLIDATION, INDICATING AREAS OF LIKELY ABOVE-NORMAL TEMPERATURES, LARGELY DUE TO DECADAL TRENDS.
PRECIPITATION
INCREASED PROBABILITIES OF BELOW-NORMAL PRECIPITATION MOVE INTO PARTS OF THE NORTHWEST CONUS FROM MJJ THROUGH JAS 2018, FOLLOWING CALIBRATED NMME FORECASTS AND DECADAL TRENDS.
NMME FORECASTS OF INCREASING LIKELIHOOD AS THE SUMMER PROGRESSES OF EL NINO CONDITIONS AND RELATED IMPACTS ARE PARTLY DISCOUNTED, DUE TO LOW SKILL IN BOTH THE ENSO AND PRECIPITATION FORECASTS AT THIS TIME OF YEAR. A SLIGHT INCREASE IN THE PROBABILITIES OF BELOW-NORMAL PRECIPITATION IS INDICATED FOR PARTS OF THE CENTRAL PLAINS FROM MJJ THROUGH JAS 2018, SUPPORTED BY CALIBRATED NMME FORECAST PROBABILITIES AND HYBRID STATISTICAL-DYNAMICAL NMME FORECASTS. THE GREATER AREA OVER THE CENTRAL CONUS OF INCREASED PROBABILITIES OF BELOW-NORMAL PRECIPITATION IN THE CALIBRATED NMME PROBABILITIES IS NOT SUPPORTED BY EITHER ENSO IMPACTS OR DECADAL PRECIPITATION TRENDS. INCREASED PROBABILITIES OF ABOVE-NORMAL PRECIPITATION FOR THE NORTHEAST THROUGH ASO 2018 ARE SUPPORTED BY DECADAL PRECIPITATION TRENDS. THE PROBABILITIES OF BELOW-NORMAL PRECIPITATION ARE INCREASED FOR THE SOUTHERN COAST OF ALASKA FROM MAM THROUGH AMJ 2018, WHILE ABOVE-NORMAL PRECIPITATION IS MOST LIKELY FOR NORTHWESTERN ALASKA FROM MAM 2018 THROUGH JJA 2018, AS INDICATED BY CALIBRATED PROBABILITY FORECASTS FROM THE NMME, CONSISTENT WITH DECADAL TRENDS.
WITH NO CLEAR CLIMATE SIGNALS OR PRECIPITATION TRENDS, OUTLOOKS FOR SON 2018 THROUGH MAM 2019 INDICATE EQUAL CHANCES (EC), WHERE PROBABILITIES OF PRECIPITATION ARE SIMILAR TO CLIMATOLOGICAL PROBABILITIES.
B. Now we begin our comparison of the NOAA and JAMSTEC Forecasts (Focus on next nine months i.e. three seasons)
In this Update, we compare the JAMSTEC temperature and precipitation forecast maps, which are for the World, with the NOAA temperature and precipitation forecast maps that cover only CONUS and Alaska. We do this primarily for educational purposes.
JAMSTEC works in three-month intervals which correspond to seasons and does not change the selection of months each time they update but does so every three months. At that time they drop one season and add another season further in the future. So for JAMSTEC we now have Spring (MAM 2018), Summer (JJA), and Fall (SON) to work with and we have the corresponding maps from NOAA.
I show the NOAA Maps first followed by the JAMSTEC maps. I extract North America from the Worldwide JAMSTEC map and use that to compare with the NOAA Maps. I also extract Europe including parts of North Africa and Western Asia from the Worldwide JAMSTEC maps and include it in the summary table at the beginning of this article.
MAM 2018 (Spring)
Temperature
NOAA
And here is the MAM 2018 temperature forecast for North America that I extracted from the JAMSTEC World Forecast
And now the JAMSTEC WORLD FORECAST (for this graphic my comments are mostly related to areas other than Alaska and CONUS as those comments appear with the larger graphics above)

Precipitation
NOAA
And here is the MAM 2018 Precipitation Forecast for North America that I extracted from the JAMSTEC World Forecast.
JAMSTEC WORLD FORECAST

Here is the precipitation forecast from Queensland Australia:

It is kind of amazing that you can make a worldwide forecast based on just one parameter the SOI and changes in the SOI. Western CONUS looks fairly wet, Eastern Australia is dry.
JJA (Summer)
Temperature
NOAA
x
And here is the JJA 2018 Temperature Forecast for North America that I extracted from the JAMSTEC World Forecast
There is more similarity here. The cool area is further west for JAMSTEC.
JAMSTEC WORLD FORECAST

Precipitation
NOAA
And here is the JJA 2018 Precipitation Forecast for North America that I extracted from the JAMSTEC World Forecast
Again there is some similarity here. But NOAA shows the Northeast wet and JAMSTEC shows the wet anomaly further north into Canada. The forecasts for Alaska are opposites. They agree on a dry Great Plains but not a dry Northwest. The dry Great Plains and wet New Mexico makes sense from a climatology perspective. This is shown for JAMSTEC but not NOAA. .
JAMSTEC WORLD FORECAST

SON 2018 (Fall)
Temperature
NOAA
And here is the SON 2018 Temperature Forecast for North America that I extracted from the JAMSTEC World Forecast
x
JAMSTEC WORLD FORECAST

The cool areas are again Northern Euro-Asia, Northern Africa, and Northern South America and Greenland.
Precipitation
NOAA
And here is the SON 2018 Precipitation Forecast for North America that I extracted from the JAMSTEC World Forecast
JAMSTEC WORLD FORECAST

C. An analysis of the forecasts for ENSO by NOAA and JAMSTEC and others including the Australian Bureau of Meteorology
A major driver of weather is Surface Ocean Temperatures. Evaporation only occurs from the Surface of Water. So we are very interested in the temperatures of water especially when these temperatures deviate from seasonal norms thus creating an anomaly. The geographical distribution of the anomalies is very important. To a substantial extent, the temperature anomalies along the Equator have disproportionate impact on weather so we study them intensely and that is what the ENSO (El Nino – Southern Oscillation) cycle is all about. Subsurface water can be thought of as the future surface temperatures. They may have only indirect impacts on current weather but they have major impacts on future weather by changing the temperature of the water surface. Winds and Convection (evaporation forming clouds) is weather and is a result of the Phases of ENSO and also a feedback loop that perpetuates the current Phase of ENSO or changes it. That is why we monitor winds and convection along or near the Equator especially the Equator in the Eastern Pacific.
Starting with Current Surface Conditions.
Here is the latest four-week Tropical Pacific Sea Surface Temperature (SST) Anomalies.

Let us look in more detail at the Equatorial Water Subsurface Temperatures.
We are now going to look at the subsurface heat content along the Equator from the surface down. This graphic provides both a summary perspective and a history (small images on the right).
.
Tracking the change Equatorial Subsurface Temperatures going back a bit further than shown in the above graphic.
 |  |
Tha above two graphics show the longitude and depth of anomalies and their intensity. For some purposes it is useful to have a single measure of the strength and sign of the entire pattern of the anomalies. And this can be done by integrating (adding) all the anomalies and assigning the value to the date of the graphic. This is shown below.

The discussion in this slide says it better than I could. One might compare the current reading to Oct/Nov 2016. The temperature anomaly slowly vanished but lately has reversed and is a bit colder. It explains why the models have added a month or half-month to when the La Nina will be gone. The weather may already be reflecting the transition but this La Nina is saying “not so fast”.
A side by side comparison can be useful
| Comparison Week Probably Third Week of December 2017 | Current Week |
| |

Converting the Surface SST’s into Indices Useful to do Regression Analysis on Past Weather in Order to Use the Indices to Forecast Future Weather.
Basically the Eastern Pacific is divided into four areas shown in the below graphic and the surface temperature in each of the four areas is estimated. Over time the conclusion is that neither Nino 3 Nino 4 is the best fit for meteorologists in the U.S. so an overlapping area 3.4 was defined and is most used. In Asia, they pay a lot of attention to Nino 3. The below chart shows the current readings and a partial history of the values of these four indices.

This graphic provides a longer history for the one index Nino 3.4.. I am not going to freeze this graphic and just let it continue to update since the historical values will remain correct.

So Far We Have Shown Current and Historical Conditions. But What About the Future i.e. The Forecast?
This is te NOAA proprietary model for forecasts the Nino 3.4 Index.

But the CFS.v2 is not the only forecast tool used by NOAA. The CPC/IRI Analysis which is produced out of The International Research Institute (IRI) for Climate and Society at Columbia University is also very important to NOAA.
And now we have a recent update.


This is the discussion
IRI ENSO Forecast CPC/IRI ENSO Update Published: February 08, 2018
El Niño/Southern Oscillation (ENSO) Diagnostic Discussion issued jointly by the Climate Prediction Center/NCEP/NWS and the International Research Institute for Climate and Society
ENSO Alert System Status: La Niña Advisory
Synopsis: A transition from La Niña to ENSO-neutral is most likely during the Northern Hemisphere spring (~55% chance of ENSO-neutral during the March-May season).
During January 2018, La Niña was evident in the pattern of below-average sea surface temperatures (SSTs) across the central and eastern equatorial Pacific Ocean. The latest weekly index values were close to -1.0°C in the Niño-1+2, Niño-3, and Niño-3.4 regions, while the western-most Niño-4 region was -0.5°C . While negative anomalies were maintained near the surface, the sub-surface temperatures in the eastern Pacific Ocean returned to near average during the last month. This was due to the eastward propagation of above-average temperatures in association with a downwelling equatorial oceanic Kelvin wave, which undercut the below-average temperatures near the surface. The atmospheric conditions over the tropical Pacific Ocean also reflected La Niña, with suppressed convection near and east of the International Date Line and enhanced convection around Indonesia . Also, the low-level trade winds remained stronger than average over the western and central Pacific, while upper-level winds were anomalously westerly. Overall, the ocean and atmosphere system remained consistent with La Niña.
Most models in the IRI/CPC plume predict La Niña will decay and return to ENSO-Neutral during the Northern Hemisphere spring 2018 . The forecast consensus also favors a transition during the spring with a continuation of ENSO-neutral conditions thereafter. In summary, a transition from La Niña to ENSO-neutral is most likely during the Northern Hemisphere spring (~55% chance of ENSO-neutral during the March-May season) (click CPC/IRI consensus forecast for the chance of each outcome for each 3-month period).
La Niña is anticipated to continue affecting temperature and precipitation across the United States during the next few months (the 3-month seasonal temperature and precipitation outlooks will be updated on Thursday February 15th). The outlooks generally favor above-average temperatures and below-median precipitation across the southern tier of the United States, and below-average temperatures and above-median precipitation across the northern tier of the United States
This discussion is a consolidated effort of the National Oceanic and Atmospheric Administration (NOAA), NOAA’s National Weather Service, and their funded institutions. Oceanic and atmospheric conditions are updated weekly on the Climate Prediction Center web site (El Niño/La Niña Current Conditions and Expert Discussions). Forecasts are also updated monthly in the Forecast Forum section of CPC’s Climate Diagnostics Bulletin. Additional perspectives and analysis are also available in an ENSO blog.
The next ENSO Diagnostics Discussion is scheduled for 8 March 2018.
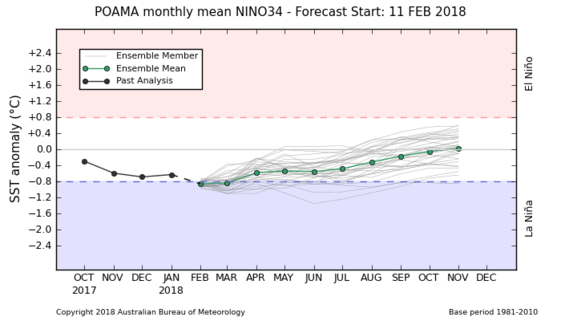
And here is what is called the plume of a varied of forecast models. This is used in the above.

Forecasts from Other Meteorological Agencies.
Here is the Nino 3.4 report from the Australian BOM (it updates every two weeks)
And the ENSO Outlook Discussion Issued on February 13, 2018:
La Niña decline may be hastened by recent shift in trade winds
The La Niña in the Pacific Ocean continues to decline. Sea surface temperatures in the central tropical Pacific have warmed steadily since late December, with most models forecasting La Niña will end early in the southern hemisphere autumn.
El Niño–Southern Oscillation (ENSO) indicators continue to show at least some La Niña characteristics. Sea surface temperatures indicate a weak La Niña pattern, with the coolest waters concentrated in the eastern Pacific Ocean, while the Southern Oscillation Index is neutral, but weakly positive. However, a very strong pulse of the Madden-Julian Oscillation (MJO), which drove a burst of monsoonal activity over northern Australia in late January, has caused the western Pacific trade winds to weaken considerably. The rapid weakening of the trade winds may hasten the decline of La Niña. The MJO also led to above-average cloudiness at the Date Line for the first time since early September 2017.
In order for 2017–18 to be classed as a La Niña year, thresholds need to be exceeded for at least three months. Four of the eight climate models surveyed by the Bureau suggest this event is likely to last at least until late summer, while a few continue the event into the southern hemisphere autumn of 2018.
Typically, the strength of a La Niña event reflects the strength of its impact upon Australian climate. The current event is weak, and hence climate patterns have been significantly different from those observed in the last strong La Nina of 2010–12. Large parts of eastern Australia have been drier than average for the past two or three months, the opposite of what is typically expected during La Niña.
And Now the Air Pressure to Confirm that the Atmosphere is Reacting to the Sea Surface Temperature Pattern. The most Common way to do that is to use an Index called the SOI.
This index provides an easy way to assess the location of and the relative strength of the Convection (Low Pressure) and the Subsidence (High Pressure) near the Equator. Experience shows that the extent to which the Atmospheric Air Pressure at Tahiti exceeds the Atmospheric Pressure at Darwin Australia when normalized is substantially correlated with the Precipitation Pattern of the entire World.

Normally La Nina Conditions are confirmed by SOI 30 day values that are greater than or equal to +7.0. El Nino Conditions are confirmed by SOI 30 day values that are less than or equal to -7.0. So right now the 30 Day value is not at all a LA Nina value. What is up with that?
The SOI Index is quite volatile. So even + or – 7.0 is not that significant. + or – 20 means something.

Indian Ocean IOD (It updates every two weeks)
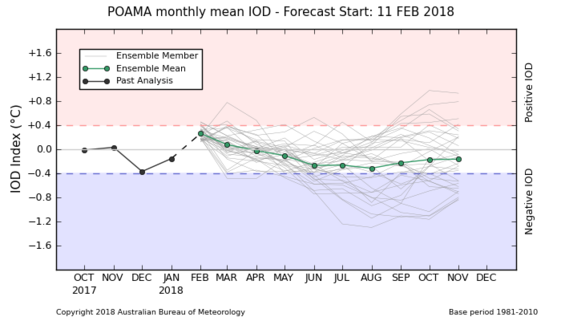
The Indian Ocean Dipole (IOD) is another Index of interest to those bordering the Indian Ocean. It is somewhat correlated with ENSO but not nearly perfectly so it also is a factor in the forecast by JAMSTEC.
Indian Ocean Dipole Outlook Discussion Issued February 13, 2018
The Indian Ocean Dipole (IOD) is currently neutral. IOD events are unable to form between December and April.
The Indian Ocean Dipole (IOD) is neutral. The weekly index value to 11 February was −0.08 °C. All six of the climate models surveyed by the Bureau indicate that the IOD will remain neutral into the southern hemisphere winter of 2018.
The influence of the IOD on Australian climate is weak during December to April. This is because the monsoon trough shifts south over the tropical Indian Ocean changing wind patterns, which prevents the IOD pattern from being able to form.
The IOD Forecast is indirectly related to ENSO but in a complex way. It is important to understand how and where the IOD is measured.

IOD Positive is the West Area being warmer than the East Area (with of course many adjustments/normalizations). IOD Negative is the East Area being warmer than the West Area. Notice that the Latitudinal extent of the western box is greater than that of the eastern box. This type of index is based on observing how these patterns impact weather and represent the best efforts of meteorological agencies to figure these things out. Global Warming may change the formulas probably slightly over time but it is costly and difficult to redo this sort of work because of long weather cycles.
The Nino 3.4 Index and other information is used to forecast Sea Surface Temperatures SSTs around the World. This in turn is used to forecast climate. In the short term, the SST’s and other information such as the pattern of Highs and Lows is used to forecast weather.
Some Housekeeping Issues.
If you are reading this Update Report and wish to transfer to the Current Weather and Climate Report, Click Here for the list of Weather Posts. That link takes you to the archive of all weather articles written by Sig Silber so you can see if the new Weekly Weather Report has been published go there or back to an earlier report but please keep in mind that the graphics in earlier reports in some cases auto-update and the text may no longer apply to the graphics shown. Remember, if you leave this page to visit links provided in this article, you can return by hitting your “Back Arrow”, usually top left corner of your screen just to the left of the URL box. The next Regular Weekly Weather and Climate Report will be published on Monday February 19, 2018. It will as usual focus on the next twenty-five days.


