Written by Sig Silber
At the end of every month, NOAA updates their Early Outlook for the following month – in this case February, 2018. There have been significant changes. The Northern Tier is forecast to be colder and wetter and further east while the Southern Tier forecast is for a larger area of drought and extending further west. It is more complicated than that and it may be a case of the average of two half-months not being a good way of looking at the month. All of this and more is discussed in this special update. .

Please share this article – Go to very top of page, right hand side for social media buttons.
NOAA Update of their Outlook for February, 2018
NOAA has, as usual, issued an update for the month following the last day of the prior month. This update was issued on Wednesday January 31. In this Update Report, we present the Updated Outlook and compare it to the Early Outlook for February issued on January 18, 2018 about two weeks ago. Please note: all smaller graphics can be enlarged by clicking on them or right clicking and selecting the “view image) option.
First I present a summary showing the prior and the new. Larger graphics follow but these smaller graphics can be enlarged..
| Temperature | Precipitation | |
| Prior Issued on January 18, 2018 |  |  |
| Updated on January 31, 2018 |  |  |
And now the larger graphics and my comments
Prior Temperature Forecast Issued on January 18, 2018

New Temperature Forecast Issued on January 31, 2018

Now might be good time to mention how warm it has been in Arizona. This is from the Phoenix NWS Office.
The entire month of January has been on the warm side (top 3 warmest in Phoenix). When including the record warmest November and 4th warmest December, the Nov-Jan period in Phoenix will end up just over 2 degrees warmer for the period than the next highest which was back in 1981. For the same period, Yuma will also end up around 1 degree warmer than any other previous Nov-Jan period.
Looking ahead to this week they are reporting the following historical highs.
Record highs in jeopardy this week:
| Phoenix | Yuma | |
| January 29 | 83 in 1935 | 84 in 1986 |
| January 30 | 82 in 1935 | 84 in 1953 |
| January 31 | 86 in 2003 | 87 in 2003 |
| February 1 | 83 in 2003 | 86 in 2003 |
| February 2 | 82 in 1925 | 86 in 1954 |
| February 3 | 86 in 1925 | 91 in 1963 |
| February 4 | 85 in 1963 | 92 in 1963 and 1925 |
| February 5 | 87 in 1963 | 90 in 1963 |
I am publishing on February 1 and as far as I know the first three records in the above list have not been tied or broken. Same goes for Eastern New Mexico. We seem to be getting 2 Sigma Events not 3 Sigma Events. That is not surprising as a 100 year event for a large area like a major city does not happen very often hence the term 100 Year Event. We have discussed that before. But events in the top 5% to 10% are fairly common. But there is a big difference between the Stock Market crashing once ever 100 years versus once every 5 or 10 years. So far this appears to be more like a 2 Sigma Event than a 3 Sigma Event but it definitely is having impacts. But in Arizona it may actually get even warmer next week.
Impact on Drought

The Drought Monitor is based on many more factors than precipitation as temperature and wind etc enter in as the Drought Monitor measures impacts. But looking at recent history can be informative so I now show the 30 Day and 90 Day Temperature and Precipitation History. As you can see, the lack of precipitation has persisted for a while and has gotten more extreme as has the warm anomaly relative to the time of the year.
| 30 Day | 30DayTemperatureandPrecipitationDepartures.png) |
| 90 Day | 90DayTemperatureandPrecipitationDepartures.png) |
Turning to Precipitation
Prior Precipitation Forecasts issued on January 18, 2018

New Precipitation Forecast Issued on January 31, 2018

Here is the NOAA Discussion released on January 31 with the February Update.
30-DAY OUTLOOK DISCUSSION FOR FEBRUARY 2018
THE MONTHLY UPDATE TO THE FEBRUARY 2018 OUTLOOK IS BASED PRIMARILY ON THE LATEST DYNAMICAL MODEL GUIDANCE FOR THE MONTH FROM THE NCEP CLIMATE FORECAST SYSTEM (CFS), WEATHER FORECASTS FOR THE FIRST WEEK OF FEBRUARY, AS WELL AS TEMPERATURE AND PRECIPITATION GUIDANCE FOR THE OUTLOOKS FOR WEEK 2 AND FOR THE WEEK 3-4 PERIOD. THE MADDEN-JULIAN OSCILLATION OR MJO HAS BEEN ACTIVE RECENTLY WITH ENHANCED CONVECTION CURRENTLY MOVING FROM THE MARITIME CONTINENT INTO THE WESTERN PACIFIC. DYNAMICAL MODEL FORECASTS INDICATE THAT THE ENHANCED CONVECTIVE PHASE OF THE MJO IS LIKELY TO PROPAGATE ACROSS THE WESTERN PACIFIC IN THE FIRST COUPLE WEEKS OF FEBRUARY. LA NINA CONDITIONS CONTINUE IN LATE JANUARY, WITH NEGATIVE SEA SURFACE TEMPERATURE (SST) ANOMALIES OBSERVED ACROSS THE CENTRAL AND EASTERN PACIFIC OCEAN FROM NEAR THE DATE LINE TO THE COAST OF SOUTH AMERICA. THE COUPLED ATMOSPHERIC RESPONSE TO LA NINA WAS OBSERVED AS WELL, WITH POSITIVE OUTGOING LONGWAVE RADIATION (OLR) ANOMALIES DUE TO REDUCED CONVECTION NEAR THE DATE LINE AND NEGATIVE OLR ANOMALIES DUE TO ENHANCED CONVECTION OVER THE MARITIME CONTINENT. ENHANCED EASTERLIES WERE OBSERVED OVER THE WESTERN AND CENTRAL TROPICAL PACIFIC OCEAN.
BASED ON RECENT DYNAMICAL MODEL GUIDANCE, A STRONG RIDGE IS EXPECTED TO DEVELOP OVER WESTERN NORTH AMERICA DURING THE FIRST TWO WEEKS OF THE MONTH. A TROUGH IS PREDICTED DOWNSTREAM OF THIS RIDGE OVER CENTRAL NORTH AMERICA IN GUIDANCE FOR THE OUTLOOK FOR WEEKS 1 AND 2. THIS CIRCULATION PATTERN IS PREDICTED TO BRING BELOW NORMAL TEMPERATURES FOR THE NORTHERN CENTRAL CONUS AND MUCH OF THE EASTERN CONUS FROM THE CENTRAL MISSISSIPPI VALLEY, ACROSS THE OHIO VALLEY TO THE CHESAPEAKE BAY, AS WELL AS ACROSS THE GREAT LAKES REGION AND INTO THE NORTHEAST. FORECASTS FOR THE FIRST HALF OF FEBRUARY LEAD TO INCREASED PROBABILITIES OF BELOW NORMAL AVERAGE TEMPERATURES FOR THE MONTH, WITH THE GREATEST PROBABILITIES OVER PARTS OF THE NORTHERN PLAINS/UPPER MISSISSIPPI VALLEY, WHERE TEMPERATURES ARE PREDICTED TO BE MUCH BELOW NORMAL IN THE FIRST WEEK OF THE MONTH. ABOVE NORMAL TEMPERATURES ARE LIKELY FOR MOST OF THE WEST, WHERE A RIDGE AND ABOVE AVERAGE 500-HPA HEIGHTS ARE PREDICTED TO PERSIST THROUGH MOST OF THE MONTH, INCLUDING GUIDANCE FROM NCEP GEFS, CFS AND ECMWF MODELS. ABOVE NORMAL TEMPERATURES CONTINUE TO BE MOST LIKELY FOR THE GULF COAST REGION AND SOUTHEAST, HOWEVER PROBABILITIES HAVE BEEN REDUCED IN THE MONTHLY UPDATE DUE TO THE INCREASED PROBABILITIES OF BELOW NORMAL EARLY IN THE MONTH. DYNAMICAL MODELS INDICATE BELOW NORMAL TEMPERATURES ARE MOST LIKELY OVER SOUTHEASTERN ALASKA DURING THE FIRST WEEK OF FEBRUARY, HOWEVER BY WEEK 2 TEMPERATURES ARE PREDICTED TO BE ABOVE NORMAL IN THIS REGION. THE GREATER SKILL OF FORECASTS FOR SHORTER LEAD TIMES LEADS TO INCREASED PROBABILITIES FOR BELOW NORMAL AVERAGE TEMPERATURES FOR THE MONTH OVER SOUTHEASTERN ALASKA AND THE ALASKA PANHANDLE. ABOVE NORMAL TEMPERATURES CONTINUE TO BE MOST LIKELY FOR WESTERN AND NORTHERN ALASKA FOR THE MONTH OF FEBRUARY AS INDICATED BY MODEL GUIDANCE FROM THE CFS.
THE UPDATE TO THE FEBRUARY PRECIPITATION OUTLOOK INDICATES CHANGES RELATED TO DYNAMICAL MODEL GUIDANCE, WHERE GREATER WEIGHT IS GIVEN TO FORECASTS FOR THE FIRST TWO WEEKS, GIVEN THE DROP IN SKILL OF PRECIPITATION FORECASTS WITH GREATER LEAD TIME. ABOVE MEDIAN PRECIPITATION IS MOST LIKELY FOR MUCH OF THE EASTERN CONUS DURING THE FIRST WEEK OF THE MONTH, FROM THE CENTRAL GULF COAST TO THE NORTHEAST. BELOW MEDIAN PRECIPITATION IS MOST LIKELY FOR MUCH OF THE WESTERN CONUS AND SOUTHERN PLAINS DURING THE EARLY PART OF THE MONTH. THESE FORECASTS FOR THE FIRST HALF OF THE MONTH ARE BLENDED WITH THE HALF-MONTH LEAD PRECIPITATION OUTLOOK, WHICH INDICATES THE AVERAGE IMPACTS OF LA NINA FOR FEBRUARY. THE UPDATE TO THE FEBRUARY PRECIPITATION OUTLOOK INDICATES INCREASED PROBABILITIES OF BELOW MEDIAN PRECIPITATION FOR MUCH OF THE WEST, FROM SOUTHERN OREGON ACROSS NEVADA INTO THE SOUTHWEST, AS INDICATED BY RECENT MODEL GUIDANCE. PROBABILITIES FOR BELOW MEDIAN PRECIPITATION FOR THE SOUTHEAST HAVE DECREASED FROM THE PRIOR OUTLOOK, WITH ABOVE MEDIAN PRECIPITATION MORE LIKELY EARLY IN THE MONTH. PROBABILITIES OF ABOVE MEDIAN PRECIPITATION ARE INCREASED FOR THE NORTHERN PLAINS FROM EASTERN MONTANA TO MINNESOTA, AND REDUCED FOR AREAS OF THE NORTHERN ROCKIES, FOLLOWING MODEL FORECASTS FOR WEEKS 1 AND 2. INCREASED PROBABILITIES FOR ABOVE MEDIAN PRECIPITATION CONTINUE FOR THE NORTHEAST, EXTENDING FURTHER SOUTH ALONG THE ATLANTIC COAST. THE FEBRUARY PRECIPITATION OUTLOOK FOR ALASKA IS SIMILAR TO THE HALF-MONTH LEAD OUTLOOK, WITH AN INCREASE IN THE PROBABILITIES OF ABOVE MEDIAN PRECIPITATION FOR THE ALASKA PANHANDLE.
Sometimes it is useful to see how the Monthly forecast fits with the 6 – 10 Day , 8 – 14 Day and Week 3 and 4 forecasts. To be complete we should look at Day 1 – 5 also. I do not have maps for the Day 1 – 5 forecast in the same format as the three maps we generally work with. What I am showing is the Day 3 Maximum Temperature and the five-day precipitation: the latter being fairly similar in format to the subsequent set of the maps I present each week.
First the short-term Five Day Maps
| Temperature | Precipitation |
 |  |
Then our regular set of forecast maps.
First Temperature
 |  |  |
| The new monthly forecast is to the right. Does it appear to be reflective of the three parts of the month for which we have forecasts? → |
| ↑ ← Strangely contrary to the NOAA discussion the full month forecast seems to fit very well with the Week 3/4 forecast which will be updated on Friday. Week one is not shown here but is shown just above this table. [Note: The Week 3 – 4 Graphic updated on Friday and now the graphics fit together well]
|
And then Precipitation
 |  |  |
| The new monthly forecast is to the right. Does it appear to be reflective of the three parts of the month for which we have forecasts? → | | ↑ ← The Week 3/4 forecast is the driest of the four maps. It is fairly similar to the 8 – 14 Day Forecast. But bears no resemblance to the new full month forecast. But it will be updated on Friday and may look very differently than is does now and off course will cover a different time period since it will be one week later.[Note: The week 3-4 Graphic updated on Friday and there remain issues of how the four graphics fit together.] |
Sometimes it is useful to compare the forecast for the current month with the three-month forecast.
February 2018 Plus February – April 2018 Outlook

One can mentally subtract the First-Month Outlook from the Three-month Outlook and create the Outlook for the last two months in the three-month period.
*The concept is that the probabilities of a deviation from climatology in the First Month and the combined Month Two and Three forecast that one derives must average out to the probabilities shown in the three-month maps.
Additional Discussion of the Factors Impacting the February Forecast and which are inherently able to be forecast more precisely at the end of the month than for the Early Outlook issued on the third Thursday of the Month
A. Arctic Oscillation (AO)
P. Pacific North American Pattern (PNA)
C. Madden Julian Oscillation (MJO)

The Arctic Oscillation (AO) is a climate index of the state of the atmospheric circulation over the Arctic. It consists of a positive phase, featuring below average geopotential heights , which are also referred to as negative geopotential height anomalies , and a negative phase in which the opposite is true. In the negative phase, the polar low pressure system (also known as the polar vortex) over the Arctic is weaker, which results in weaker upper level winds (the westerlies). The result of the weaker westerlies is that cold, Arctic air is able to push farther south into the U.S., while the storm track also remains farther south. The opposite is true when the AO is positive: the polar circulation is stronger which forces cold air and storms to remain farther north. The Arctic Oscillation often shares phase with the North Atlantic Oscillation (NAO) (discussed below), and its phases directly correlate with the phases of the NAO concerning implications on weather across the U.S.
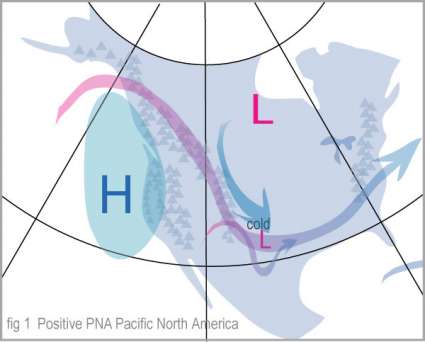
B. PNA Pacific North American Pattern: Notice the PNA has been running a bit positive. And again it is forecast to be positive for the first half of February. PNA positive 
The Pacific/ North American teleconnection pattern (PNA) is one of the most prominent modes of low-frequency variability in the Northern Hemisphere extratropics. The positive phase of the PNA pattern features above-average heights in the vicinity of Hawaii and over the intermountain region of North America, and below-average heights located south of the Aleutian Islands and over the southeastern United States. The PNA pattern is associated with strong fluctuations in the strength and location of the East Asian jet stream. The positive phase is associated with an enhanced East Asian jet stream and with an eastward shift in the jet exit region toward the western United States. The negative phase is associated with a westward retraction of that jet stream toward eastern Asia, blocking activity over the high latitudes of the North pacific, and a strong split-flow configuration over the central North Pacific.
The positive phase of the PNA pattern is associated with above-average temperatures over western Canada and the extreme western United States, and below-average temperatures across the south-central and southeastern U.S. The PNA tends to have little impact on surface temperature variability over North America during summer. The associated precipitation anomalies include above-average totals in the Gulf of Alaska extending into the Pacific Northwestern United States, and below-average totals over the upper Midwestern United States.
|
| Source North Carolina State Climate Office |
Although the PNA pattern is a natural internal mode of climate variability, it is also strongly influenced by the El Nino/Southern Oscillation (ENSO) phenomenon. The positive phase of the PNA pattern tends to be associated with Pacific warm episodes (El Nino), and the negative phase tends to be associated with Pacific cold episodes (La Nina). Thus it is a bit unusual to have a forecast of a Negative AO and a Positive PNA but in many ways they have similar impacts on the weather which may create a bit more of an extreme situation for the first part of February.
C. MJO: Madden Julian Oscillation
We have discussed this many times including two weeks ago. This article provides a very good explanation. Below is a graphic that illustrates the impacts as the MJO circles the Equator and below that is the current forecast.

You can see the approximately 20 Day Active Phase of the MJO Wave and how areas of high convection move around the Globe along the Equator. It is most intense along the Equator but the impacts extend north and south into the middle latitudes and thus after a lag impact CONUS. The exact speed and strength of the MJO are difficult to forecast and are more noticeable in certain years than others. This may be a winter where the MJO is important.

The current forecast (green line – the red line is where it has been) shows the Active Phase of the MJO entering the Pacific and it is not real clear but it will then cross Central America. At different locations the impacts on CONUS weather are different. One impact that is likely is a strengthening of the Jet Stream. Another impact that is not nearly as certain is increasing precipitation in Mexico and impacting the Southern Tier of CONUS. That seemed more likely a few days ago but is difficult to forecast so we will observe. The MJO moves fast so the impact at a particular location will be for a week or so no more than that.


