Written by Sig Silber
Both NOAA and JAMSTEC are factoring in the development of a La Nina or near La Nina. NOAA is more aggressive with this. The differences in the forecasts for Fall and Winter largely, but not totally, relate to the slight differences in the ENSO forecast for each Agency. For NOAA, it is a dramatic change from the forecast they issued last month. Their maps, through an abundance of caution, may still only go halfway towards incorporating La Nina into their forecast for the winter of 2017/2018.

Please share this article – Go to very top of page, right hand side for social media buttons.
This report is organized into two Parts:
A. A full discussion of the recent NOAA Seasonal Outlook
B. A comparison between the NOAA and JAMSTEC Forecasts.
But for those who want a quick synopsis of the two forecasts, below is a summary of the temperature and precipitation forecasts for three time-periods and from left to right the NOAA forecast for Alaska and CONUS (the contiguous mid-latitude U.S), then JAMSTEC for North America (which includes Canada and Northern Mexico), and then JAMSTEC for Europe and surrounding areas. Larger graphics are provided later in the report. It is kind of a tease to keep you reading but you can see the evolution of the weather pattern through Fall, Winter and into Spring. For some readers, these two sets of summary graphics may be all the information they wish to look at and that is fine.
Temperature
| NOAA Alaska Plus CONUS | JAMSTEC North America | JAMSTEC Europe | |
NOAA OND JAMSTEC SON Temp |  |  |  |
DJF 2017/2018 Temp |  |  |  |
MAM 2018 Temp |  |  |  |
Precipitation
| NOAA Alaska Plus CONUS | JAMSTEC North America | JAMSTEC Europe | |
NOAA OND JAMSTEC SON Precip |  |  |  |
DJF 2017/2018 Precip |  |  |  |
MAM 2018 Precip |  |  |  |
A. Focus on the NOAA Update
A note about terminology; the deviations from climatology/normal are color coded but also labeled “A” for more than normal and “B” for less than normal. The area designated EC means Equal Chances of being more or less than normal. JAMSTEC relies on their color coding. In my comments I have used EC to cover all the situations where a clear anomaly is not shown.
First we will take a look at the Early Outlook for October 2017. It is called the Early Outlook because it will be updated at the end of September. Only the October Outlook will be updated at that time.
Temperature

Precipitation

We have nothing to compare these maps with as NOAA does not in their Update provide a forecast for two months out separate from their three-month forecast. Thus I do not have October maps from the August 17, NOAA Report to compare against. And September is not over so we can not really compare the October forecast against September actual. It is probably best to just try to understand what NOAA is trying to convey about October which can be summarized as for temperature, the West and the Northern Tier of CONUS and Northern Alaska are warm and there is a small cool anomaly centered on the Tennessee Valley. South Florida is also warm. Re precipitation, the Mid and Lower Mississippi Valley states are dry as well as Southwest Alaska. The Northwest, Florida Peninsula, Northern Alaska and the Alaskan Panhandle are wet.
Now we consider the three-month Outlook.
Notice that the three-month periods are abbreviated e.g. October/November/December is shown as OND. You will see such abbreviations often in this report.
Prior Temperature Outlook for OND 2017

New Temperature Outlook for OND 2017

Prior Precipitation Outlook for OND 2017

New Precipitation Outlook for OND 2017

Now let us focus on the long-term situation and compare the new set of maps with the maps issued on July 20, 2017.
Prior 14 Month Temperature Outlook: OND 2017 – SON 2018

New 14 Month Temperature Outlook: NDJ 2017/2018 – OND 2018

To compare maps from one release to another, one needs to remember that the new release drops one three-month period and adds a later one. So to make the comparisons one has to shift the new maps to the right one position and that makes the map on the right drop down to become the left-most map in the next level. I do not have a computer software tool for doing that for you so you have to do it mentally. When I do the comparison, I print the two sets of maps and put them side by side and number the same three-month maps 1, 2, 3,…..,11 in both sets of maps to make it easier for me to easily compare the same three-month period in the new with the previous forecast. One uses the same procedure to compare the precipitation maps. Based on this procedure, I conclude that:
Now Precipitation
Prior 14 Month Precipitation Outlook: OND 2017 – SON 2018

New 14 Month Precipitation Outlook: NDJ 2017/2018 – OND 2018

If you want larger versions of each map (temperature and precipitation) you can find them here. And then each of those maps can be clicked on to further enlarge them.
Sometimes it is useful to compare the present month outlook to the three-month outlook

One can mentally subtract the First-Month Outlook from the Three-month Outlook and create the Outlook for the last two months in the three-month period.
*The concept is that the probabilities of a deviation from climatology in the First Month and the combined Month Two and Three forecast that one derives must average out to the probabilities shown in the three-month maps.
Discussion
Below are excerpts (significantly reorganized and with a lot of the redundancy and discussion of methodology removed) from the Discussion released by NOAA on September 21, 2017. Headings that are “Initial Cap” only rather than all caps were added by the Author of this Update Report for clarity. Also we have organized the sequence of the sections of NOAA Discussion to first present the Atmospheric and Oceanic Conditions and then the Current Month, the Three or Four-month period, and finally the remainder of the 15 Month Forecast. We think that sequence with the three- to four-month period broken out separately, makes the discussion more useful for more readers.
CURRENT ATMOSPHERIC AND OCEANIC CONDITIONS
OCEANIC AND ATMOSPHERIC OBSERVATIONS ACROSS THE EQUATORIAL PACIFIC INDICATE ENSO-NEUTRAL CONDITIONS. DURING THE LAST FOUR WEEKS, SEA-SURFACE TEMPERATURES (SST) HAVE GENERALLY DECREASED OVER THE CENTRAL AND EASTERN EQUATORIAL PACIFIC, INTENSIFYING THE NEGATIVE ANOMALIES IN THOSE REGIONS. ACROSS THE WESTERN PACIFIC, POSITIVE ANOMALIES HAVE SLIGHTLY DECREASED IN COVERAGE AND MAGNITUDE. SUBSURFACE TEMPERATURE MEASUREMENTS IN THE CENTRAL AND EASTERN EQUATORIAL PACIFIC REVEAL A LARGE RESERVOIR OF ANOMALOUSLY COLD WATER FROM ABOUT 50-175 METERS BELOW THE SURFACE. THE PRESENCE AND GROWTH OF THIS FEATURE CONTRIBUTE TO THE ASSESSMENT FOR INCREASING ODDS FOR LA NINA DEVELOPMENT IN THE COMING MONTHS. DECREASING UPPER-OCEAN HEAT CONTENT VALUES REFLECT THIS CONTINUED COOLING. OUTGOING LONGWAVE RADIATION (OLR) ANOMALIES DURING LATER AUGUST AND EARLY SEPTEMBER SHOW BELOW-AVERAGE CONVECTION FROM 140E TO 150W, FROM THE EQUATOR TO 10N. DURING THIS SAME PERIOD, THE TRADE WINDS HAVE BEEN ABOVE AVERAGE WEST OF THE DATE LINE WITH REDUCED TRADES OVER THE EASTERN PACIFIC. THE REDUCED TRADES OVER THE EASTERN PACIFIC HAVE BEEN DISPLACED NORTHWARD, SO ARE LIKELY TO HAVE HAD LESS OF AN INFLUENCE ON EQUATORIAL SST VALUES. OVERALL, THE OCEAN AND ATMOSPHERE SYSTEM REMAINS CONSISTENT WITH ENSO-NEUTRAL CONDITIONS.
PROGNOSTIC DISCUSSION OF SST FORECASTS
THE MOST RECENT PREDICTIONS FROM THE NCEP CLIMATE FORECAST SYSTEM (CFSV2) AND THE NORTH AMERICAN MULTI-MODEL ENSEMBLE (NMME) INDICATE THE FORMATION OF LA NINA AS SOON AS THE NORTHERN HEMISPHERE FALL 2017. THE NMME MEAN INDICATES A NINO 3.4 VALUE (-0.6 DEG C) BELOW THE LA NINA THRESHOLD BY NOVEMBER OF 2017, WITH CONSTITUENT ENSEMBLE MEMBERS VARYING FROM -0.3 TO -1.1 BY DECEMBER OF 2017. THE CONSTRUCTED ANALOG BASED ON SST PATTERNS (SST-CA), CCA, AND MARKOV MODEL INDICATE ENSO NEUTRAL CONDITIONS THROUGH THE NORTHERN HEMISPHERE WINTER. THE CPC CONSOLIDATION PREDICTS ENSO NEUTRAL CONDITIONS THROUGH THE AUTUMN, WITH INCREASING ODDS FOR LA NINA BY WINTER 2017-18. FORECASTERS FAVOR THE NMME PREDICTIONS IN PART BECAUSE OF THE RECENT COOLING OF SURFACE AND SUB-SURFACE TEMPERATURE ANOMALIES, AND ALSO BECAUSE OF THE HIGHER DEGREE OF FORECAST SKILL AT THIS TIME OF YEAR. THE OFFICIAL CPC/IRI OUTLOOK INDICATES A 62 PERCENT CHANCE OF LA NINA DEVELOPMENT DURING NOVEMBER-DECEMBER-JANUARY 2017-18, AN INCREASE OF 36 PERCENTAGE POINTS FROM LAST MONTH. THE OFFICIAL OUTLOOK INDICATES A LIKELY RETURN TO ENSO NEUTRAL CONDITIONS BY NEXT SPRING, MARCH-APRIL-MAY 2018.
30-DAY OUTLOOK DISCUSSION FOR OCTOBER 2017
Temperature
STRONG POSITIVE TEMPERATURE TRENDS FAVOR HIGH PROBABILITIES FOR ABOVE NORMAL TEMPERATURES FOR THE NORTH SLOPE OF ALASKA DUE TO NEGATIVE TRENDS IN SEA ICE COVERAGE AND SLOWER RETURN OF SEA ICE COMPARED TO THE LONGER PERIOD CLIMATOLOGY. PROSPECTS FOR ANOMALOUS TROUGHING AND NEGATIVE 500-HPA HEIGHT ANOMALIES, WET SOIL MOISTURE CONDITIONS AND CONSISTENT SIGNALS IN CALIBRATED DYNAMICAL MODEL TEMPERATURE GUIDANCE FAVOR A SMALL REGION OF BELOW NORMAL TEMPERATURES IN THE TENNESSEE VALLEY. THERE IS MARGINAL SUPPORT FOR A SLIGHT TILT IN THE ODDS OF ABOVE NORMAL TEMPERATURES FOR THE SOUTHERN HALF OF THE FLORIDA PENINSULA.
Precipitation
ABOVE NORMAL PRECIPITATION IS FAVORED FOR PARTS OF THE PACIFIC NORTHWEST, ALASKA AND EXTREME SOUTHEAST CONUS, PRIMARILY FLORIDA. FAVORED LOW LEVEL CONVERGENCE ACROSS AREAS IN THE INTERIOR OF THE CONUS TO THE GULF COAST FAVOR BELOW NORMAL PRECIPITATION IN THIS REGION WHILE MARGINAL SUPPORT EXISTS FROM CALIBRATED DYNAMICAL MODEL GUIDANCE FOR BELOW NORMAL PRECIPITATION FOR PARTS OF THE SOUTH COAST OF ALASKA.
Three-Month OND Outlook
Temperature
ABOVE-NORMAL TEMPERATURES ARE FAVORED FOR MUCH OF ALASKA AND FOR MOST OF THE CONTIGUOUS 48 STATES DURING OND 2017. THE HIGHEST PROBABILITIES FOR ABOVE-NORMAL TEMPERATURES ARE FORECAST FOR PARTS OF THE SOUTHWEST AND THE NORTH SLOPE OF ALASKA (AT OR ABOVE 60-PERCENT).
THE ODDS FOR ABOVE-NORMAL TEMPERATURES ACROSS THE NORTHWEST, NORTHERN ROCKIES, AND NORTHERN GREAT PLAINS HAVE BEEN REDUCED FROM LAST MONTH’S OUTLOOK, AS THE INCREASING ODDS FOR LA NINA WOULD FAVOR BELOW-NORMAL TEMPERATURES DURING THE LATTER PORTIONS OF OND. ACROSS SOUTHEAST ALASKA AND THE ALASKA PANHANDLE, AS WELL AS PORTIONS OF THE NORTHERN GREAT PLAINS, ODDS FOR ABOVE-NORMAL TEMPERATURES WERE REDUCED ENOUGH THAT SOME AREAS TRANSITION TO EQUAL CHANCES.
Precipitation
SIGNIFICANT CHANGES HAVE BEEN MADE TO THE OND 2017 OUTLOOK FOR PRECIPITATION, WHEN COMPARED TO LAST MONTH. THESE CHANGES REFLECT THE RELATIVELY DRAMATIC SWITCH IN MODEL OUTPUTS AS WELL AS THE DECISION TO DISCOUNT THE SST-CA [Editor’s Note: I deleted that part of the discussion but apparently the SST-CA model has not been consistent with other models recently]. DURING THIS CYCLE. IN GENERAL, PROBABILITIES ARE LOW, DUE TO THE UNCERTAINTY REGARDING THE STATE OF ENSO.
THE OND 2017 PRECIPITATION OUTLOOK INDICATES INCREASED ODDS OF ABOVE-NORMAL PRECIPITATION FOR WESTERN ALASKA, FROM THE NORTH COAST TO THE ALASKA PENINSULA AND THE ALEUTIANS, AS WELL AS FOR THE PACIFIC NORTHWEST AND NORTHERN ROCKIES. ODDS FOR BELOW-NORMAL PRECIPITATION ARE INCREASED, RELATIVE TO CLIMATOLOGY, ACROSS THE MIDDLE AND LOWER MISSISSIPPI VALLEYS AND ACROSS MUCH OF THE SOUTHEAST.
PROGNOSTIC DISCUSSION OF OUTLOOKS – OND 2017 TO OND 2018 Focus on the period after OND)
THE CURRENT NEUTRAL PHASE OF ENSO IS EXPECTED TO PERSIST THROUGH THE NORTHERN HEMISPHERE AUTUMN, WITH INCREASING CHANCES FOR A TRANSITION TO LA NINA CONDITIONS LATER IN THE AUTUMN AND WINTER 2017-2018. AS THE ENSO OUTLOOK BECOMES MORE CERTAIN DURING THE NEXT COUPLE OF MONTHS, CORRESPONDING ADJUSTMENTS WILL BE MADE TO THE SEASONAL OUTLOOKS.
TEMPERATURE
THE REDUCTION IN PROBABILITIES FOR ABOVE-NORMAL TEMPERATURES FROM THE NORTHWEST TO THE NORTHERN GREAT PLAINS AND OVER SOUTHEAST ALASKA CONTINUES THROUGH THE MAM 2018 OUTLOOKS, REFLECTING THE POSSIBILITY FOR LA NINA TO INFLUENCE THE TEMPERATURE PATTERN OVER THE FORECAST DOMAIN. THESE SAME SIGNALS, A COLDER FORECAST RELATIVE TO LAST MONTH ACROSS THE NORTHERN CONUS, ARE LARGELY REFLECTED IN THE NMME MODEL SUITE, THOUGH THE DYNAMICAL MODELS ARE SLIGHTLY COLDER FOR THE PACIFIC NORTHWEST AND THE ALASKA PANHANDLE. THE UNCERTAINTY AROUND THE ENSO OUTLOOKS PRECLUDES A COMPLETE SWITCH IN FORECAST CATEGORY DURING THE WINTER OF 2017-18 [Editor’s note: Playing from behind can result in needing to play catch-up next month].
THROUGH FMA 2018, ODDS FOR ABOVE-NORMAL TEMPERATURES REMAIN INCREASED RELATIVE TO CLIMATOLOGY ACROSS THE SOUTHERN TIER OF THE CONUS, SUPPORTED BY TRENDS AND NMME MODEL OUTPUT. MODEL OUTPUT AND TRENDS DISAGREE OVER THE PACIFIC NORTHWEST (NO TREND BUT BELOW-AVERAGE TEMPERATURES IN THE OUTLOOKS) AND NORTHERN CONUS (COLD TREND BUT EC OR WARM IN MODELS), SO EC IS INDICATED IN THOSE REGIONS, UNTIL WE GET CLOSER IN TIME AND FORECAST CONFIDENCE INCREASES. AS THE LEADS PROGRESS THROUGH 2018, TRENDS ARE LIKELY TO BE THE DOMINANT FACTOR AS ENSO IS LIKELY TO RETURN TO A NEUTRAL STATE. TRENDS FAVOR ABOVE-NORMAL TEMPERATURES FOR ALL OF ALASKA AND MUCH OF THE CONUS, WITH A WEAKNESS NEAR THE GREAT LAKES AND OHIO VALLEY DURING SUMMER, WHICH SHIFTS TOWARD THE SOUTHEAST DURING AUTUMN.
PRECIPITATION
TRENDS ESPECIALLY AS EXPRESSED DURING THE LATER AUTUMN AND WINTER SEASONS, AND A SLIGHT TILT TOWARD LA NINA, FAVOR BELOW-NORMAL PRECIPITATION FOR THE SOUTHEAST AND PORTIONS OF THE MIDDLE AND LOWER MISSISSIPPI VALLEY.
TRENDS FOR DRIER-THAN-AVERAGE CONDITIONS ALONG THE SOUTHERN TIER OF THE CONUS WITH WETTER-THAN-AVERAGE CONDITIONS ACROSS THE NORTHERN TIER, AS WELL AS A TILT TOWARD LA NINA INFLUENCE THE OUTLOOK THROUGH FMA 2018. TRENDS FOR ABOVE-NORMAL PRECIPITATION ARE WEAKEST IN JFM, BUT THAT IS ALSO WHEN ANY LA NINA FOOTPRINT WOULD BE MOST INTENSE. FOR MAM 2018 THROUGH ASO 2018, TRENDS, AS CALCULATED IN THE 15-YEAR OPTIMAL CLIMATE NORMALS (OCN) WERE USED AS THE PRIMARY INPUT [Editor’s Note: They are saying that for Spring and Summer 2018 the forecast is based on climatology which can explain the differences with the JAMSTEC forecast for Spring of 2018].
THIS SET OF OUTLOOKS WILL BE SUPERSEDED BY THE ISSUANCE OF THE NEW SET NEXT MONTH ON OCT 19 2017
Forecasting the Evolution of ENSO
El Nino Probabilities used by NOAA in Their Forecast (The forecast for the value of the Nino 3.4 Index receives the most attention).
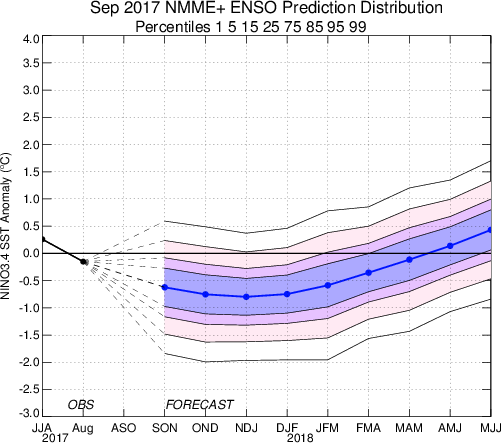
Below is the latest NOAA forecast of Nino 3.4 temperature anomalies. You can see the “blue” newer model runs and the “red” older model runs. The Oceanic Niño Index (ONI) which is the three-month rolling average of the Nino 3.4 values is NOAA’s primary indicator for monitoring El Niño and La Niña. The secondary indicator is the Southern Oscillation Index (SOI) which is based on the extent that the air pressure anomaly in Tahiti exceeds the air pressure anomaly in Darwin Australia. It is a complicated formula and is intended to assess the response of the atmosphere to the changes in the pattern of warm and cool sea surface temperatures.
Here is the NOAA forecast for the Nino 3.4 Index.

I have added a line at -0.5C which is the level that defines La Nina Sea Surface Conditions in the Nino 3.4 Measurement Area. This level needs to be maintained for five consecutive overlapping three-month periods to constitute a La Nina not just a period of La Nina Conditions. In the above it does. But it does not in other models that NOAA uses. So it is a judgment call at this point in time.

The CFS.v2 is not the only forecast tool used by NOAA. The CPC/IRI Analysis which is produced out of The International Research Institute (IRI) for Climate and Society at Columbia University is also very important to NOAA. Below is the September 19 and September 14 CPC/IRI ENSO Forecasts

As you can see there has been some recent change to limit the period where La Nina is favored to just the Fall and Winter. This shows up as uncertainty in the NOAA maps and discussion.
Here is the IRI Discussion:
IRI Technical ENSO Update
Published: September 19, 2017
Note: The SST anomalies cited below refer to the OISSTv2 SST data set, and not ERSSTv4. OISSTv2 is often used for real-time analysis and model initialization, while ERSSTv4 is used for retrospective official ENSO diagnosis because it is more homogeneous over time, allowing for more accurate comparisons among ENSO events that are years apart. During ENSO events, OISSTv2 often shows stronger anomalies than ERSSTv4, and during very strong events the two datasets may differ by as much as 0.5 C. Additionally, the ERSSTv4 may tend to be cooler than OISSTv2, because ERSSTv4 is expressed relative to a base period that is updated every 5 years, while the base period of OISSTv2 is updated every 10 years and so, half of the time, is based on a slightly older period and does not account as much for the slow warming trend in the tropical Pacific SST.
Recent and Current Conditions
In mid-September 2017, the NINO3.4 SST anomaly was near the borderline of the weak La Niña category. For August the SST anomaly was -0.15 C, in the ENSO-neutral range, and for June-August it was 0.26 C, also in the ENSO-neutral range. The IRI’s definition of El Niño, like NOAA/Climate Prediction Center’s, requires that the SST anomaly in the Nino3.4 region (5S-5N; 170W-120W) exceed 0.5 C. Similarly, for La Niña, the anomaly must be -0.5 C or less. The climatological probabilities for La Niña, neutral, and El Niño conditions vary seasonally, and are shown in a table at the bottom of this page for each 3-month season. The most recent weekly anomaly in the Nino3.4 region had cooled to -0.6, in the weak La Niña range. The pertinent atmospheric variables, including the upper and lower level zonal wind anomalies, have been showing mainly neutral patterns, although the convection pattern has become somewhat suggestive of a borderline La Niña condition. The Southern Oscillation Index (SOI) has been somewhat above average, although the equatorial SOI has been near average. Subsurface temperature anomalies across the eastern equatorial Pacific have become somewhat below average. Despite recent SST anomalies some signs of La Niña patterns in some atmospheric variables, the combination of the SST and the atmospheric conditions continues to warrant an ENSO-neutral diagnosis for the recent 1-month period.
Expected Conditions
What is the outlook for the ENSO status going forward? The most recent official diagnosis and outlook was issued approximately one week ago in the NOAA/Climate Prediction Center ENSO Diagnostic Discussion, produced jointly by CPC and IRI; it stated that La Niña has the greatest chance of prevailing through fall and into winter, with slightly lower chances for ENSO-neutral. A La Niña watch was issued with that Discussion. The latest set of model ENSO predictions, from mid-September, now available in the IRI/CPC ENSO prediction plume, is discussed below. Those predictions suggest that the SST has the greatest chance for being in the weak La Niña range for September-November through the rest of 2017, and show a slightly lower but significant probability for ENSO-neutral, and possibly a minimal La Niña condition that endures for only 2 to 4 running 3-month seasons.
As of mid-September, about 50 to 60% of the dynamical or statistical models predicts La Niña conditions from the initial Sep-Nov 2017 season through to the Dec-Feb 2017-18 season. During this period, about 40 to 50% of models predict neutral conditions, while no models predicts El Niño conditions. At lead times of 3 or more months into the future, statistical and dynamical models that incorporate information about the ocean’s observed subsurface thermal structure generally exhibit higher predictive skill than those that do not. For the Dec-Feb 2017-18 season, among models that do use subsurface temperature information, 40% of models predicts neutral conditions and 60% predicts La Niña conditions. At longer lead times reaching into the first half of 2018, predictions for ENSO-neutral conditions dominate, with probabilities from 65% to higher levels, while for the final season of May-Jul 2018 the probability for El Niño rises to 25%.
Caution is advised in interpreting the distribution of model predictions as the actual probabilities. At longer leads, the skill of the models degrades, and skill uncertainty must be convolved with the uncertainties from initial conditions and differing model physics, leading to more climatological probabilities in the long-lead ENSO Outlook than might be suggested by the suite of models. Furthermore, the expected skill of one model versus another has not been established using uniform validation procedures, which may cause a difference in the true probability distribution from that taken verbatim from the raw model predictions.
An alternative way to assess the probabilities of the three possible ENSO conditions is more quantitatively precise and less vulnerable to sampling errors than the categorical tallying method used above. This alternative method uses the mean of the predictions of all models on the plume, equally weighted, and constructs a standard error function centered on that mean. The standard error is Gaussian in shape, and has its width determined by an estimate of overall expected model skill for the season of the year and the lead time. Higher skill results in a relatively narrower error distribution, while low skill results in an error distribution with width approaching that of the historical observed distribution. This method shows probabilities for La Niña near or just above 50% from Oct-Dec to Dec-Feb, with near or just slightly lower probabilities for neutral conditions during these seasons and less than 5% probabilities for El Niño. Probabilities for ENSO-neutral rise to approximately 60% or more at longer lead forecasts for Feb-Apr to May-Jul 2018, while chances for El Niño rise to nearly 30% by the final season of May-Jul. A plot of the probabilities generated from this most recent IRI/CPC ENSO prediction plume using the multi-model mean and the Gaussian standard error method summarizes the model consensus out to about 10 months into the future. The same cautions mentioned above for the distributional count of model predictions apply to this Gaussian standard error method of inferring probabilities, due to differing model biases and skills. In particular, this approach considers only the mean of the predictions, and not the total range across the models, nor the ensemble range within individual models.
In summary, the probabilities derived from the models on the IRI/CPC plume describe, on average, a slight preference for weak La Niña conditions from Oct-Dec 2017 to Dec-Feb 2017-18, with highest probabilities for ENSO-neutral during Sep-Nov 2017 and again from Jan-Mar 2018 and later. Chances for El Niño are very small through Mar-May 2018, rising to near-climatological probabilities for the two final seasons. A caution regarding this latest set of model-based ENSO plume predictions, is that factors such as known specific model biases and recent changes that the models may have missed will be taken into account in the next official outlook to be generated and issued in early June by CPC and IRI, which will include some human judgment in combination with the model guidance.
The other way of looking at it describe in the discussion above in terms of the likelihood of various levels of the Nino 3.4 Index is shown below. The spread between the 25th and 75th percentile is about 0.7C so there is a lot of uncertainty but it does not increase further out in time.
A look at the subsurface along the Equator is very useful.
 |  |
It could well be that the every ten year adjustment adjustment mechanism NOAA uses for the base climatology of the Tropical Pacific for real time analysis (OISSTv2 data set) is not able to keep up with Ocean Warming which may slightly overstate warm anomalies. Even the five year adjustment they use to review the data for historical analysis (ERSSTv4) really does not help very much when there is a trend that is either a secular trend due to Global Warming or part of a sixty-year low-frequency cycle such as the PDO. Current values tend to be higher than the average.
Here is the current JAMSTEC forecast for the Nino 3.4 Index.

There has since last month been a significant change in the JAMSTEC forecast of the Nino 3.4 Index It is not fully consistent with the NOAA forecast but much closer. The forecasted Index is not low enough to be a La Nina (-0.5C or lower) but is close and it continues to be a negative value through the forecast period with includes Spring of 2018
Here is the discussion from JAMSTEC:
Sep. 19, 2017 Prediction from 1st Sep., 2017
ENSO forecast:
A weak La Niña-like pattern will persist until boreal spring of next year. Then, the tropical Pacific will return to a normal state by summer.
Indian Ocean forecast:
A positive Indian Ocean Dipole continues to exist as we have predicted but it will disappear by winter. In accord to the positive IOD, sea level anomalies continue to be negative (positive) in the eastern (western) tropical Indian Ocean. The tropical Indian Ocean will return to a normal state by winter.
Regional forecast:
On a seasonal scale, most part of the globe will experience a warmer-than-normal condition, while some parts of western Canada and western U.S. will experience a colder-than-normal condition in boreal fall. In winter, most parts of northern Europe, Russia, northern Canada, southern U.S., Mexico, southern Africa, Southeast Asia, China, and the Far East will experience a warmer-than-normal condition, while some parts of southern Europe, northern Africa, southern Canada, northern U.S., northern Brazil, and Australia will experience a colder-than-normal condition.
As regards to the seasonally averaged rainfall, a wetter-than-normal condition is predicted for some parts of East Africa, India, Philippine, and southern Mexico during boreal fall, whereas most parts of Indonesia, Australia, West Africa, southern Europe, eastern China, western U.S, and western Brazil will experience a drier condition during boreal fall. Those are partly due to the positive Indian Ocean Dipole. In winter, most parts of eastern U.S., Brazil, East Africa, and Australia will experience a wetter-than-normal condition, while some parts of western U.S., Peru, Indonesia, and the northeastern part of South Africa (around Limpopo Province) will experience a drier-than-normal condition.
Most parts of Japan will experience warmer- and wetter-than-normal conditions in fall. However, in late fall and winter, most parts of Japan will experience warmer- and drier-than-normal conditions.
Here is the Nino 3.4 report from the Australian BOM (it updates every two weeks but this copy is frozen)

Discussion Issued September 12, 2017
ENSO neutral, but tropical Pacific continues to cool
Sea surface temperatures (SSTs) have steadily cooled over the central and eastern tropical Pacific for the past two months, but remain well within the neutral ENSO range. Temperatures at and below the surface are now slightly cooler than average. Other indicators of ENSO, such as the Southern Oscillation Index (SOI), cloudiness near the Date Line and trade winds also remain at neutral levels.
International climate models surveyed by the Bureau indicate that ENSO-neutral conditions are likely to persist at least until late 2017. Most models indicate further cooling of the tropical Pacific sea surface temperatures during spring and summer may be likely. However, six out of eight models stay neutral for the remainder of the year, with only two models reaching La Niña thresholds near the end of 2017. Historically this is close to the time when ENSO events peak.
The Australian BOM employs a different threshold for considering a SSTA to be either La Nina or El Nino. Note their forecast is showing ENSO Neutral based on their criteria through their forecast period. But it would meet the NOAA criteria for La Nina Conditions but it is marginal for having sufficient duration.
Indian Ocean IOD (It updates every two weeks)
The IOD Forecast is indirectly related to ENSO but in a complex way.

Discussion Issued September 12
The Indian Ocean Dipole (IOD) is neutral, though index values have generally been weakly positive for the past five months. The weekly index value to 10 September was +0.3 °C, and has persisted at levels just shy of the positive IOD threshold (+0.4 °C) for the past four to six weeks. Most climate models suggest the IOD is likely to remain neutral. However, two of the six climate models surveyed suggest a positive IOD may develop during spring. If a positive IOD eventuated it would likely be short-lived as IOD events typically break down by December as the monsoon trough moves south towards Australia changing wind patterns, which prevents the IOD pattern from being able to form.
Positive IOD events are typically associated with below average spring rainfall, and increased spring–summer fire potential over central and southern Australia, while La Niña-like patterns tend to promote above-average spring rainfall in the south and east. Hence Australia faces some competing, though weak, climate drivers in the months ahead.
Does the Atmosphere as measured by the SOI Index confirm that we have La Nina Condition?

Normally La Nina Conditions are confirmed by SOI 30 day values that are greater than or equal to +7.0. El Nino Conditions are confirmed by SOI 30 day values that are less than or equal to -7.0. So right now both the Nino 3.4 Index and the SOI remain in the ENSO Neutral phase of ENSO.
The SOI Index is quite volatile. So even + or – 7.0 is not that significant. + or – 20 means something.

B. Now we begin our comparison of the NOAA and JAMSTEC Forecasts (Focus on next nine months i.e. three seasons)
In this Update, we compare the JAMSTEC temperature and precipitation forecast maps, which are for the World, with the NOAA temperature and precipitation forecast maps that cover only CONUS and Alaska. We do this primarily for educational purposes.
JAMSTEC works in three-month intervals which correspond to seasons and does not change the selection of months each time they update but does so every three months. At that time they drop one season and add another season further in the future. So for JAMSTEC we only have SON 2017, DJF 2017-2018, and MAM 2018 to work with. Two of the three three-month periods are available from NOAA but an updated SON does not really make the most sense but since that is what JAMSTEC provides we match that up against the OND from NOAA. It is not perfect but it also is not a major problem since we are comparing two three-month periods that have two months in common. I show the NOAA Maps first followed by the JAMSTEC maps. I extract North America from the Worldwide JAMSTEC map and use that to compare with the NOAA Maps. I also extract and enlarge Europe including parts of North Africa and Western Asia form the Worldwide JAMSTEC maps.
ONJ 2017 (Fall)
Temperature
NOAA OND 2017
And here is the SON temperature forecast for North America that I extracted from the JAMSTEC World Forecast
NOAA shows CONUS pretty much warm everywhere. JAMSTEC shows a large cool anomaly for Canada and Northwestern CONUS.
And now the JAMSTEC WORLD FORECAST (for this graphic my comments are mostly related to areas other than Alaska and CONUS as those comments appear with the graphics above)

For the World, JAMSTEC almost all of the world warm except for part of India and northwestern CONUS and Canada.
Precipitation
NOAA OND 2017
And here is the SON 2017 Precipitation Forecast for North America that I extracted from the JAMSTEC World Forecast.

A lot of similarity here for te Northwest but very different for the East as NOAA sees the dry area south and JAMSTEC sees it to the north.
JAMSTEC WORLD FORECAST

Of interest is the dryness west of 40E in both Hemispheres. Also the wetness in Central America which correlates with the recent tropical activity.
DJF 2017/2018 (Winter)
Temperature
NOAA DJF 2017 – 2018

And here is the DJF 2017 – 2018 Temperature Forecast for North America that I extracted from the JAMSTEC World Forecast

It is the same pattern as NOAA but where NOAA says EC, JAMSTEC says cool. What is surprising is that NOAA has a more aggressive estimate of the level of La Nina but the two maps seem to be representing the opposite re differences of opinion on how low the Nino 3.4 Index will be. This is addressed in the NOAA discussion found earlier in this article.
JAMSTEC WORLD FORECAST

For JAMSTEC we see a lot more cool areas in this season. Western Europe and Northern Africa and Australia and northern South America are projected to be cooler than climatology.
Precipitation
NOAA DJF 2017 – 2018

And here is the DJF 2017 – 2018 Precipitation Forecast for North America that I extracted from the JAMSTEC World Forecast

Again there is some similarity but NOAA sees the west differently with a wet Northwest and JAMSTEC sees a dry California. JAMSTEC sees the wet anomaly that NOAA shows over the Great Lakes and Upper Mississippi to extend further east into the Northeast.
JAMSTEC WORLD FORECAST

Europe is dry. Brazil is wet. Australia is wet.
MAM 2018 (Spring)
Temperature
NOAA MAM 2018

And here is the MAM 2018 Temperature Forecast for North America that I extracted from the JAMSTEC World Forecast

NOAA shows a large EC area along the Northern Tier. JAMSTEC sees all of CONUS warm, with Alaska cooler than for NOAA.
JAMSTEC WORLD FORECAST

The cool areas are really scattered. The cool anomaly for Eastern Canada is impressive.
Precipitation
NOAA MAM 2018

And here is the MAM 2018 Precipitation Forecast for North America that I extracted from the JAMSTEC World Forecast

NOAA shows a wet Great Lakes. JAMSTEC has all of CONUS dry except for South Texas and Washington State.
JAMSTEC WORLD FORECAST

Europe continues to be dry. Southern Africa is wet. Indochina is wet. Much of South America is wet.
Conclusion
Both forecasts are based on ENSO being primarily negative with NOAA going all the way to a weak but short La Nina and JAMSTEC still in Neutral Territory. The differences are somewhat more than expected given the similarity in the Nino 3.4 forecasts. But the NOAA forecast may not fully reflect their Nino 3.4 forecast. JAMSTEC also provides a worldview that NOAA does not.
One value of doing this sort of analysis is that as the projected value of Nino 3.4 changes, we have the basis for extrapolating between these two sets of forecast maps if the Nino 3.4 forecasts come closer together. If they become farther apart, it may still be possible to make some reasonable guesses as to how this will impact weather.
Some Housekeeping Issues.
The next Regular Weekly Weather and Climate Report will be published on September 25. If you are reading this Update Report and wish to transfer to the Current Weather and Climate Report, Click Here for the list of Weather Posts. That link takes you to the archive of all weather articles written by Sig Silber so you can if the new Weekly Weather Report has been published go there or back to an earlier report but please keep in mind that the graphics in earlier reports in some cases auto-update and the text may no longer apply to the graphics shown. Remember, if you leave this page to visit links provided in this article, you can return by hitting your “Back Arrow”, usually top left corner of your screen just to the left of the URL box.


