Written by Sig Silber
This Article has been updated. You can access the update at: “Out to Sea but is the Track Forecast Reliable? – 25Sep2017”
5:30 PM EDT Sept 24, 2017: LATEST FROM NHC: “…TROPICAL STORM AND STORM SURGE WATCHES ISSUED FOR A PORTION OF THE COAST OF NORTH CAROLINA… ” “The latest runs of the dynamical models are fairly similar to the previous ones…The NHC track…lies west of the various consensus aids out of respect for the ECMWF and its ensemble mean.”

It increasingly looks like Maria will stay on track and just graze the Cape Hatteras area and inland from there to a fairly limited extent. We will continue to update this report.
Please share this article – Go to very top of page, right hand side for social media buttons.
This remains an active period in the tropics so we are starting with the overview of the situation in both the Pacific and the Atlantic even though right now only the Pacific presents major threats. Those potentially impacted by any of these storms should consult their local sources of information. The Public Advisories and other information that is available from the NOAA National Hurricane Center can be found here. Information from the Weather Prediction Center can be found here.
First the Atlantic

And now the Pacific.

We start our Report with Hurricane Maria. The”M” Designation means a very powerful storm: Category 3 or higher. Notice that Maria no longer categorized as “M”.


And the Discussion
Hurricane Maria Discussion Number 35 NWS National Hurricane Center Miami FL 500 PM EDT Sun Sep 24 2017
Recent reports from NOAA and Air Force Reserve Hurricane Hunter aircraft indicate that Maria’s pressure has fallen a few millibars since this morning, but there has been little overall change in intensity. A blend of the flight-level and Stepped Frequency Radiometer Microwave Radiometer data yields an initial wind speed of around 90 kt. Maria will be traversing warm water and remain in a low shear environment during the next day or so, and some fluctuations in intensity are possible through Monday. After that time, Maria is forecast to move over cooler waters left over from Hurricane Jose. This is likely to result in gradual weakening, however Maria is forecast to maintain hurricane status through the entire forecast period.
Maria is moving just west of due north or 350/8 kt. The hurricane is currently being steered north-northwestward to northward between a cut-off low over the southeastern U.S. and a subtropical ridge over the southwestern Atlantic. The forward motion of the hurricane should slow down over the next couple of days as a ridge builds to the north of the system over the northeastern United States. After 72 h, Maria should turn east-northeastward and begin to recurve as the deep-layer flow turns southwestward ahead of large mid-latitude trough that is forecast to move over the Great Lakes region by the end of the week. The latest runs of the dynamical models are fairly similar to the previous ones, with the ECMWF along the western side of the guidance and the GFS near the eastern edge. The NHC track is between these solutions, and lies west of the various consensus aids out of respect for the ECMWF and its ensemble mean.
Since Maria is a large hurricane, the associated tropical-storm-force winds could reach a portion of the North Carolina in about 48 hours. As a result, a Tropical Storm Watch has been issued for a portion of the coast of North Carolina.
KEY MESSAGES:
1. Maria is forecast to continue moving northward, paralleling the U.S. east coast, and it is likely that some direct impacts will occur along portions of the coast beginning Tuesday, and a Tropical Storm Watch has been issued for a portion of the coast of North Carolina.
2. Storm surge flooding especially along the sound side of the North Carolina Outer Banks is possible beginning Tuesday, and a Storm Surge Watch has been issued for a portion of the North Carolina Outer Banks.
3. Swells from Maria are increasing along the coast of the southeastern United States and are expected to reach the Mid- Atlantic coast today. These swells will likely cause dangerous surf and rip currents at beaches in these areas through much of the week. For more information, please monitor information from your local National Weather Service office at www.weather.gov.
FORECAST POSITIONS AND MAX WINDS
INIT 24/2100Z 29.4N 73.0W 90 KT 105 MPH
12H 25/0600Z 30.3N 73.2W 90 KT 105 MPH
24H 25/1800Z 31.4N 73.4W 85 KT 100 MPH
36H 26/0600Z 32.5N 73.5W 80 KT 90 MPH
48H 26/1800Z 33.6N 73.6W 80 KT 90 MPH
72H 27/1800Z 35.0N 73.3W 75 KT 85 MPH
96H 28/1800Z 35.8N 71.0W 65 KT 75 MPH
120H 29/1800Z 37.5N 64.5W 65 KT 75 MPH
Vertical Wind Shear is one factor now starting to diminish Maria.
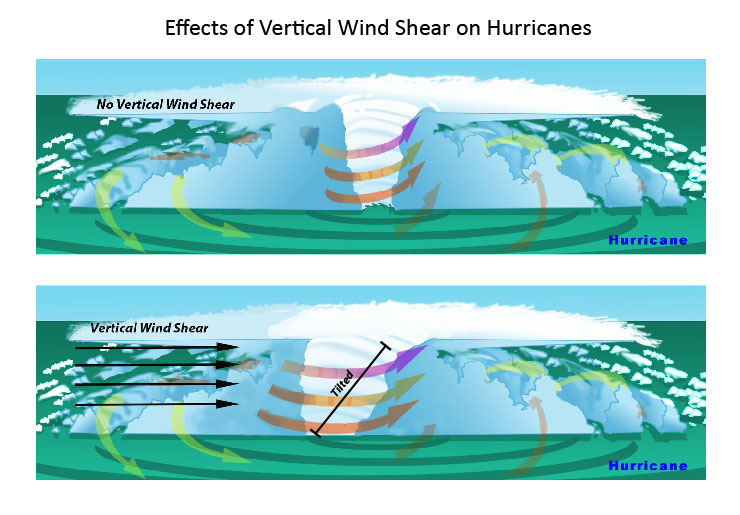
Learn more about wind shear here.
New Storm: Tropical Storm Pilar

Tropical Storm Pilar Discussion Number 5 NWS National Hurricane Center Miami FL 400 PM CDT Sun Sep 24 2017
Pilar continues this afternoon to be a problematic system. Fortunately, a 1426Z GPM 36 GHz image suggested that the system’s center was very close to Cabo Corrientes at that time. This allowed for a somewhat better estimate of the initial position and motion (350 degrees at 7 kt). Pilar is being advected around a deep-layer ridge located over central Mexico. Despite the initial continued movement at around 7 kt this afternoon, the guidance insists that Pilar should soon slow down. The official forecast track is quite similar to the previous one, with a course along or just west of the coast of southwestern Mexico. Fortunately, the model guidance came into better agreement with the track prediction, though some of the model’s trackers could not explicitly follow the weak vortex beyond a day or so into the future.
Because of Pilar having some of its circulation over the high terrain of southwestern Mexico, some weakening has likely occurred. The initial intensity is reduced to 35 kt, based upon a blend of the TAFB and SAB Dvorak classifications. While the SSTs are warm and the vertical shear is only moderate for the day or so, continued interaction with land is likely to prevent any re-intensification. After about 24 hours, the vertical shear should go way up, as Pilar is affected by strong southerlies associated with a vigorous mid- to upper-tropospheric trough over the southwestern United States. The official intensity forecast is closest to a blend of the LGEM statistical scheme and the HWRF dynamical model, and is just slightly below the previous advisory. An alternative scenario is for Pilar to dissipate substantially sooner because of the land interactions.
FORECAST POSITIONS AND MAX WINDS
INIT 24/2100Z 20.8N 105.8W 35 KT 40 MPH
12H 25/0600Z 21.8N 106.0W 35 KT 40 MPH
24H 25/1800Z 22.5N 106.2W 30 KT 35 MPH
36H 26/0600Z 23.0N 106.5W 25 KT 30 MPH
48H 26/1800Z 23.5N 107.0W 20 KT 25 MPH…POST-TROP/REMNT LOW
72H 27/1800Z…DISSIPATED
General Weather Situation
We believe that it is easier to understand what is going on with individual storms if they are put into the context of the overall weather situation.

Some of the graphics below show the two storms of most interest.


Additional Graphics

This is a national animation of weather fronts and precipitation forecasts with four 6-hour projections of the conditions that will apply covering the next 24 hours and a second day of two 12-hour projections the second of which is the forecast for 48 hours out and to the extent it applies for 12 hours, this animation is intended to provide coverage out to 60 hours. This graphic is very relevant as one can see both storms of most interest in this graphic. .


