Written by Sig Silber
This Article has been updated. You can access the updated Article by clicking on: Out to Sea but is the Track Forecast Reliable? – 23Sep2017
5:20 PM EDT Sept 22, 2017: LATEST FROM NHC: “…MARIA PASSING TO THE EAST OF THE SOUTHEASTERN BAHAMAS…”THE GOVERNMENT OF THE BAHAMAS HAS CHANGED THE HURRICANE WARNING FOR THE TURKS AND CAICOS ISLANDS AND THE SOUTHEASTERN BAHAMAS TO A TROPICAL STORM WARNING.”

But the Maria Track does not provide comfort that we will not here from Maria again re CONUS Northeast and Canada
Please share this article – Go to very top of page, right hand side for social media buttons.
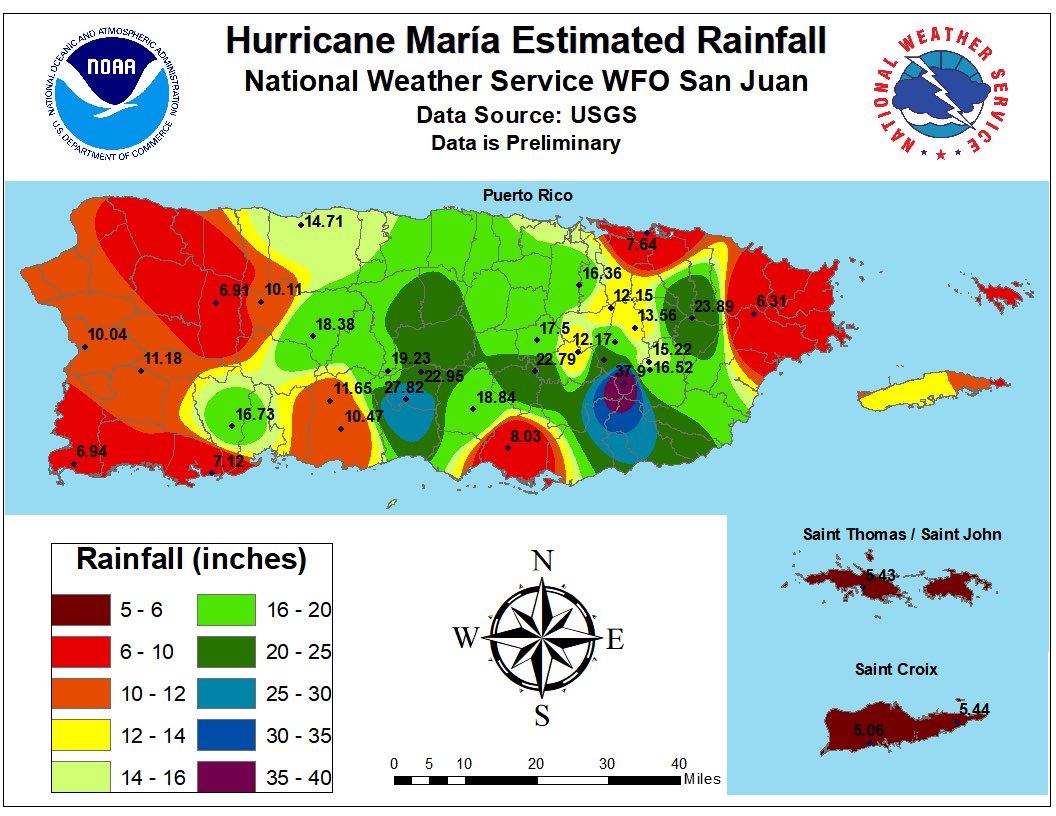
Damage Reports from the recent impacts of Hurricane Maria start to trickle in. Here is one. And here is an impact assessment and analysis and an update from the same source. This report is focused on Puerto Rico. Our coverage on impacts will expand as more information becomes available.
This report is particularly concerning.
This is an active period in the tropics so we are starting with the overview of the situation in both the Pacific and the Atlantic even though right now only the Pacific presents major threats. Those potentially impacted by any of these storms should consult their local sources of information. The Public Advisories and other information that is available from the NOAA National Hurricane Center can be found here. Information from the Weather Prediction Center can be found here.
First the Atlantic

More Detail
And now the Pacific.

We start our Report with Hurricane Maria. The”M” Designation means a very powerful storm: Category 3 or higher.


And the Discussion
Hurricane Maria Discussion Number 27 NWS National Hurricane Center Miami FL 500 PM EDT Fri Sep 22 2017
A ragged eye has re-appeared during the past several hours, but overall the satellite presentation of Maria has not changed much during the past several hours. The initial intensity is therefore held at 110 kt pending data new data from an ongoing NOAA research mission and an upcoming Air Force Reserve flight. According to various analyses, Maria is under the influence of 20 kt of shear from the southwest, which has apparently eroded the eyewall a bit on that side of the storm. This shear may abate some in about 24 hours, although Maria will also be moving over an area of gradually lowering oceanic heat content. Maria’s intensity is therefore only expected to decrease very gradually during the next 48 hours. After that time, the shear is expected to pick up again, and Maria will be moving over the cold wake left behind by Jose. As a result, a steadier weakening should ensue on days 3 through 5. The NHC intensity forecast remains closest to the ICON intensity consensus and is relatively unchanged from the previous advisory.
Maria is turning around the southwestern periphery of a mid-level high centered south of Bermuda, and the initial motion estimate is 335/8 kt. The hurricane should turn northward by 36 hours when it moves between the high and a developing cut-off low near the U.S. Gulf coast, and that northward motion, with some east-west wiggles, is likely to continue through day 5. The new track models have shifted significantly westward on this cycle, leaving the interpolated version of the previous forecast (OFCI) by itself on the eastern edge of the guidance suite. Oddly enough, the ECMWF model went from being on the west side of the guidance envelope to the east side, so the westward shift of the new NHC forecast on days 3 through 5 only goes as far as that model and the TVCN consensus.
KEY MESSAGES:
1. Flooding continues in portions of Puerto Rico and the Dominican Republic due to Maria’s heavy rains over the past few days. Continue to follow advice from local officials to avoid these life-threatening flooding conditions.
2. Swells from Maria are affecting the coast of the southeastern United States and will likely cause dangerous surf and life-threatening rip currents for the next several days.
3. Maria will move between the east coast of the United States and Bermuda by the middle of next week, but it is too soon to determine what, if any, direct impacts there might be in these areas.
4. For more information on the flooding and rip current hazards in the United States, please monitor information from your local National Weather Service forecast office at www.weather.gov.
FORECAST POSITIONS AND MAX WINDS
INIT 22/2100Z 23.3N 71.4W 110 KT 125 MPH
12H 23/0600Z 24.3N 71.8W 105 KT 120 MPH
24H 23/1800Z 25.9N 72.2W 105 KT 120 MPH
36H 24/0600Z 27.5N 72.5W 100 KT 115 MPH
48H 24/1800Z 28.8N 72.5W 95 KT 110 MPH
72H 25/1800Z 30.7N 72.0W 85 KT 100 MPH
96H 26/1800Z 32.5N 72.0W 75 KT 85 MPH
120H 27/1800Z 34.5N 71.5W 65 KT 75 MPH
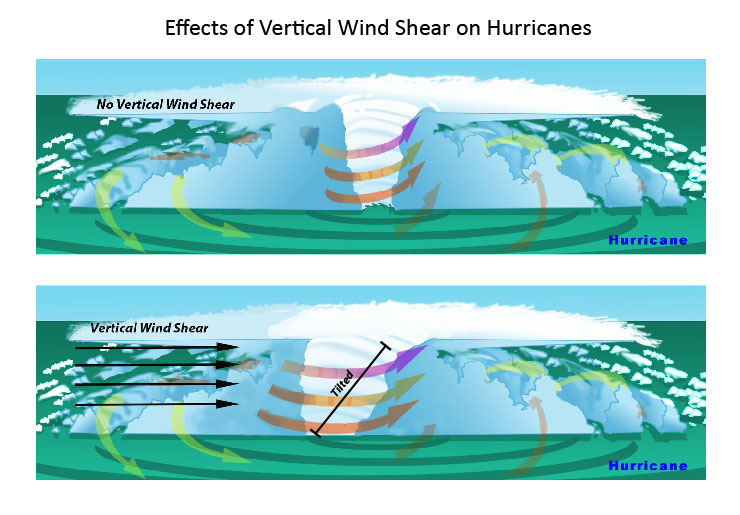
Learn more about wind shear here.
Here is the current Track Map for Jose.

Final Jose Discussion
Post-Tropical Cyclone Jose Discussion Number 70 NWS National Hurricane Center Miami FL 500 PM AST Fri Sep 22 2017
After 70 advisories, enough is enough. The tropical-storm-force winds from Jose have finally subsided and moved out of the southern New England. Thus, the wind hazard to land has decreased, and this will be the last advisory on Jose since it is already post-tropical. A slow decay over cold water is forecast while the low drifts southeastward to southward. The cyclone should degenerate into a trough within 3 days as forecast by the global models.
The swell and rip current threat will remain across large portions of the U.S. east coast for quite some time, due to the wave field from both Jose and Maria.
FORECAST POSITIONS AND MAX WINDS
INIT 22/2100Z 39.3N 69.1W 40 KT 45 MPH…POST-TROPICAL
12H 23/0600Z 39.1N 69.1W 35 KT 40 MPH…POST-TROPICAL
24H 23/1800Z 38.7N 68.7W 30 KT 35 MPH…POST-TROP/REMNT LOW
36H 24/0600Z 38.4N 67.9W 25 KT 30 MPH…POST-TROP/REMNT LOW
48H 24/1800Z 38.2N 68.0W 25 KT 30 MPH…POST-TROP/REMNT LOW
72H 25/1800Z…DISSIPATED
General Weather Situation
We believe that it is easier to understand what is going on with individual storms if they are put into the context of the overall weather situation.

Some of the graphics below show the two storms of most interest.


Additional Graphics

This is a national animation of weather fronts and precipitation forecasts with four 6-hour projections of the conditions that will apply covering the next 24 hours and a second day of two 12-hour projections the second of which is the forecast for 48 hours out and to the extent it applies for 12 hours, this animation is intended to provide coverage out to 60 hours. This graphic is very relevant as one can see both storms of most interest in this graphic. .


