Written by Sig Silber
Updated: 1100 PM EDT Saturday Sept 2, 2017 Coverage Also on Irma
Because of the significance of this storm Hurricane Harvey and which continues to impact CONUS and the new risk of Hurricane Irma, we continually update this report.
POST-TROPICAL CYCLONE HARVEY ALMOST DISSIPATED
lrma track shifted a bit south which raises the risk to the U.S.
Part A Is the current weather forecasts as they involve Harvey This is being expanded to cover Hurricane Irma.
Part B will be the physical and human impacts of Harvey.

Please share this article – Go to very top of page, right hand side for social media buttons.
Part A. The Meteorological Aspects of storms of interest with a focus on Forecasts. We attempt to keep this information up to date as of the date and time shown above. We will update this information frequently but probably shift from every 12 hours to every 24 hours unless Irma becomes a direct threat. This is the last formal update from NOAA on Harvey. Updates on IRMA can be accessed directly from NOAA here.
We have consolidated what we consider to be the most important information and thus one can get what we consider to be a complete picture without doing a lot of searching. Additional information on the overall weather pattern which may be helpful in understanding what is controlling the track of this storm can be found in our weekly Weather and Climate Report which can be accessed here. The graphics there auto-update and the discussion will be updated Monday Night. The location of the updated report will be different (but will be updated in this report when the new report is published Monday Night but you can always find the location of all of our reports by clicking here. Please be patient with us as it is not easy to get up with all the information that is available and pick and choose that which will be most useful to readers.

In lieu of the NOAA Track forecast this might be useful. This is a national animation of weather fronts and precipitation forecasts with four 6-hour projections of the conditions that will apply covering the next 24 hours and a second day of two 12-hour projections the second of which is the forecast for 48 hours out and to the extent it applies for 12 hours, this animation is intended to provide coverage out to 60 hours. One can clearly see Harvey in the forecast perhaps merged with other weather patterns but still very discernable.

The explanation for the coding used in these maps, i.e. the full legend, can be found here although it includes some symbols that are no longer shown in the graphic because they are implemented by color coding.


Latest and Final Harvey Discussion.
POST-TROPICAL CYCLONE HARVEY ADVISORY NUMBER 53 NWS WEATHER PREDICTION CENTER COLLEGE PARK MD 1100 AM EDT SAT SEP 02 2017
POST-TROPICAL CYCLONE HARVEY CONTINUES TO WEAKEN…
SUMMARY OF 1100 AM EDT…1500 UTC…INFORMATION
LOCATION…38.1N 84.9W ABOUT 20 MILES…30 KM…WNW OF LEXINGTON KENTUCKY ABOUT 60 MILES…100 KM…ENE OF FORT KNOX KENTUCKY MAXIMUM SUSTAINED WINDS…15 MPH…25 KM/H PRESENT MOVEMENT…NE OR 045 DEGREES AT 5 MPH…8 KM/H MINIMUM CENTRAL PRESSURE…1013 MB…29.92 INCHES
WATCHES AND WARNINGS
FLOOD WARNINGS AND ADVISORIES ARE ONGOING SCATTERED THROUGHOUT EASTERN TEXAS…THE LOWER MISSISSIPPI VALLEY…TENNESSEE VALLEY…AND THE LOWER OHIO VALLEY.
DISCUSSION AND 48-HOUR OUTLOOK
AT 1100 AM EDT…1500 UTC…THE CENTER OF POST-TROPICAL CYCLONE HARVEY WAS LOCATED NEAR LATITUDE 38.1 NORTH…AND LONGITUDE 84.9 WEST. HARVEY CONTINUES TO WEAKEN AND IS EXPECTED TO DISSIPATE OVER THE MID-UPPER OHIO VALLEY BY TONIGHT ALONG WITH ANY LINGERING HEAVY RAIN AND RUNOFF THREAT DIRECTLY RELATED TO THE CIRCULATION. HOWEVER, A SEPARATE AREA OF LOW PRESSURE DEVELOPING OVER THE MID-ATLANTIC REGION AHEAD OF HARVEY WILL INTERACT WITH ITS REMNANT MOISTURE PLUME TO PRODUCE AS MUCH AS 1 TO 2 INCHES OF RAIN OVER THE NORTHEAST THROUGH SUNDAY.
HAZARDS AFFECTING LAND
RAINFALL…RESIDUAL FLOODING WILL CONTINUE IN AND AROUND HOUSTON, BEAUMONT/PORT ARTHUR/ORANGE, AND EASTWARD AROUND THE LOUISIANA BORDER THROUGH THE WEEKEND. DO NOT ATTEMPT TO TRAVEL IN THE AFFECTED AREA IF YOU ARE IN A SAFE PLACE. DO NOT DRIVE INTO FLOODED ROADWAYS.
NEXT ADVISORY
THIS IS THE LAST PUBLIC ADVISORY ISSUED BY THE WEATHER PREDICTION CENTER FOR THIS SYSTEM. PLEASE REFER TO YOUR LOCAL NATIONAL WEATHER SERVICE OFFICE FOR FURTHER INFORMATION ON THIS STORM.
FORECAST POSITIONS
INITIAL 02/1500Z 38.1N 84.9W
12HR VT 03/0000Z 39.8N 82.3W…POST-TROP/EXTRATROP
24HR VT 03/1200Z…DISSIPATED
Let’s not forget about Irma

Latest Irma Discussion
Hurricane Irma Discussion Number 15 NWS National Hurricane Center Miami FL 1100 PM AST Sat Sep 02 2017
The cloud pattern of Irma has not changed significantly in structure today. The eye continues to become apparent and then hide under the convective canopy, and this has been the observed pattern for the past 24 hours or so. Dvorak estimates go up and down with the presence of the eye, but an average of these numbers supports an initial intensity of 95 kt. A NOAA Hurricane Hunter plane will help with the intensity estimate on Sunday.
I hesitate to speculate too much about the environment that Irma is embedded within. All of the standard ingredients necessary for strengthening are forecast to be at least marginally favorable, But none are expected to be hostile for intensification. The NHC forecast, which in fact is similar to the previous one, continues to be a blend of the statistical models and the explosive strengthening shown by the regional hurricane and global models.
The subtropical ridge building to the north of Irma has been steering the hurricane toward the west or 260 degrees at 12 kt. The ridge is forecast to amplify even more, and this flow pattern will force the hurricane to dive west-southwestward for a couple of days. Irma should then begin to gain latitude once it reaches the southwestern edge of the ridge in about 3 days. The confidence in the track forecast is high for the next 72 hours since all of the reliable guidance is basically on top of each other. After 3 days, when the hurricane is forecast to be approaching the northern Leeward Islands, the guidance envelope spreads out and becomes bounded by the southernmost tracks of the HWRF, HCCA and the ECMWF models, and by the northernmost GFS and UK models. The confidence beyond 3 days is then much lower. Tonight’s NHC forecast was adjusted a just little to the south of the previous one due to another small shift of the guidance envelope. The forecast is basically on top of the multi-model consensus TVCX.
While Irma is currently a small hurricane, the size guidance suggests it should grow in size during the next 72 h. This will affect how soon watches may be issued for portions of the Leeward and Virgin Islands.
KEY MESSAGES:
1. Irma is expected to be a major hurricane when it moves closer to the Lesser Antilles early next week, producing rough surf and rip currents. Irma could also cause dangerous wind, storm surge, and rainfall impacts on some islands, although it is too soon to specify where and when those hazards could occur. Residents in the Lesser Antilles should monitor the progress of Irma through the weekend and listen to any advice given by local officials.
2. It is much too early to determine what direct impacts Irma will have on the Bahamas and the continental United States. Regardless, everyone in hurricane-prone areas should ensure that they have their hurricane plan in place, as we are now near the peak of the season.
FORECAST POSITIONS AND MAX WINDS
INIT 03/0300Z 18.3N 46.2W 95 KT 110 MPH
12H 03/1200Z 17.8N 48.0W 95 KT 110 MPH
24H 04/0000Z 17.2N 50.1W 100 KT 115 MPH
36H 04/1200Z 16.7N 52.3W 105 KT 120 MPH
48H 05/0000Z 16.5N 54.5W 110 KT 125 MPH
72H 06/0000Z 17.7N 59.3W 110 KT 125 MPH
96H 07/0000Z 19.9N 64.5W 115 KT 130 MPH
120H 08/0000Z 22.5N 69.5W 115 KT 130 MPH
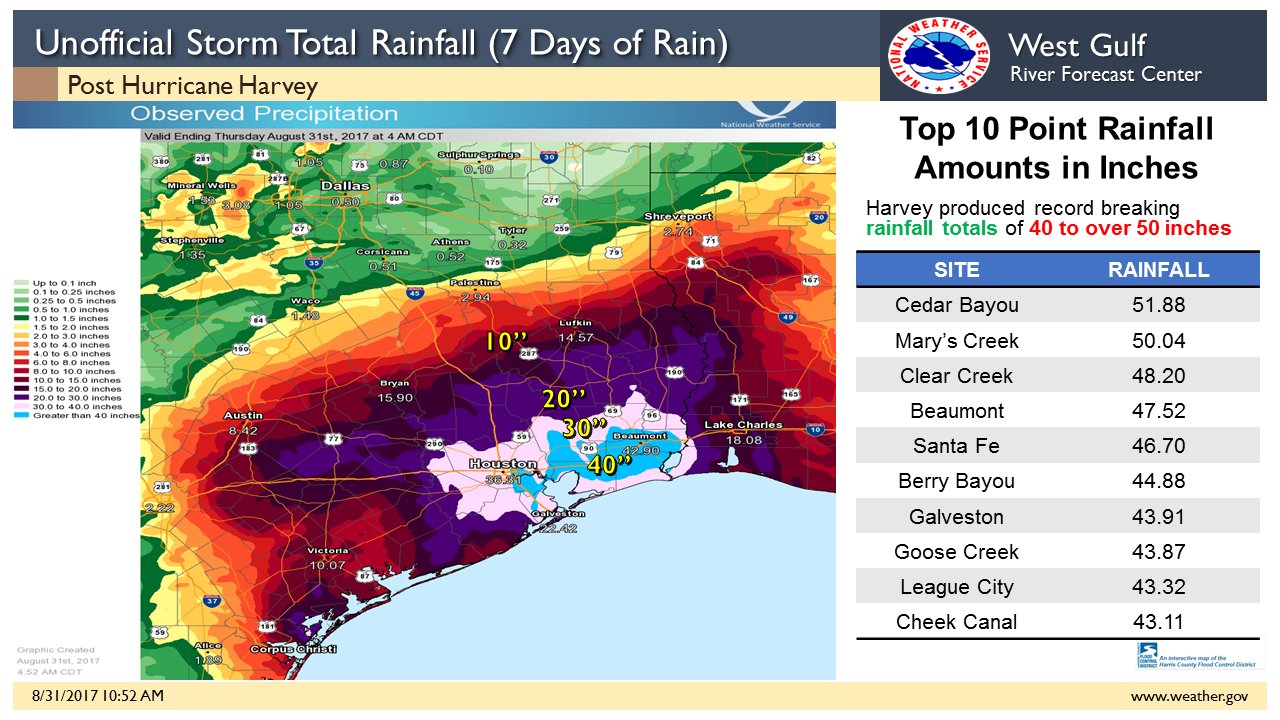
Harvey Final Precipitation Totals as of 11AM EDT September 2, 2017. There is no longer a separate site that I know of that provides update totals and they will no longer be in the WPC Updates so most likely this will be the final update of this information. We may add local updates if significant.
And then Additional States were Impacted.
 |  |
 |
New States being Impacted
 |
|  |

Second Set of States Impacted (This data is as reported on Thursday 10 PM August 31.
 |  |  |
Initial States Impacted (These totals are no longer being updated so they were correct as of 10 AM CDT Wednesday August 30).
 |  |
Interesting way to view the precipitation pattern in the Houson area.
Below is the last reported Track. There are no further updates of the track but you can tell the track by other graphics that I have included. Also the track is describe in the discussion which is up to date. We are now at the end of the reported track so this graphic is mostly of historical significance now.

Part B. The Human and Economic Impacts of this storm
Economic Impacts.
The usual impacts of a disaster are first very negative and later very positive and essentially reflect Keynesian Economics. Unfortunately the first phase comes first and it can be very heartbreaking. One clue to how this might work out is provided by this excellent article.
More Than 50 Percent Of Properties In Houston At High And Moderate Risk Of Flood Are Not In Designated Flood Zones
First Report on number of homes damaged. Source: Market Watch
About 100,000 homes were damaged by Hurricane Harvey, President Donald Trump’s Homeland Security Adviser Tom Bossert told reporters on Thursday. Speaking at the White House, Bossert said the administration would soon ask Congress for an initial round of emergency funding to aid relief efforts. He said a second request would be made after getting more information.
Total Residential Insured And Uninsured Flood Loss For Hurricane Harvey Between $25 Billion And $37 Billion Approximately 70 Percent Of Flood Damage Is Uninsured
Oil Refinery Impacts
At the Beaumont-Port Arthur Airport, 26.03” of rain fell on Tuesday, which is more than double Beaumont’s previous calendar-day record of 12.76″ on May 19, 1923, in records going back to 1901. Between 10 pm last night and 1 am this morning, 11.86” fell. So far on Wednesday, 4.71” has been reported (as of 11 am CDT), bringing their 5-day storm total rainfall to a staggering 47.98”. The intense rains caused extreme flash flooding that inundated all of Port Arthur, according to Mayor Freeman, who showed a video this morning of the inside of his flooded house on his Facebook page. Port Arthur is the site of the nation’s largest oil refinery, which was forced to shut down due to the floods. The nation’s second-largest refinery, in Baytown, TX, was also forced to shut down yesterday, due to flooding-induced roof damage. In all, at least 12 refineries are currently offline due to Harvey. Source: Weather Underground Category 6 Click to Read Full Article
From this Geopolitical Futures article

The following is from our initial assessment Saturday afternoon. We will attempt to provide an organized assessment rather than streaming news reports as they come it. There is so much reporting that streaming these reports would mostly duplicate the traditional news services. So we will attempt to consolidate the information and provide a somewhat comprehensive analysis.
Concern about Facilities that Depend on Cooling.
Arkema: No way to prevent explosion at flooded Texas chemical plant Click to read more
Well it seems the report unfortunately was timely as this chemical plant has had explosions. You may be able to read about it here (you may hit a paywall not sure).
This is what we reported Saturday afternoon. There are many pictures showing flooding and other damage that we could show now.
Some of the graphics are very disturbing. But first we want to put this storm into perspective. This graphic was sent in by the NWS in Jackson Kentucky but was probably originally prepared by PBS.
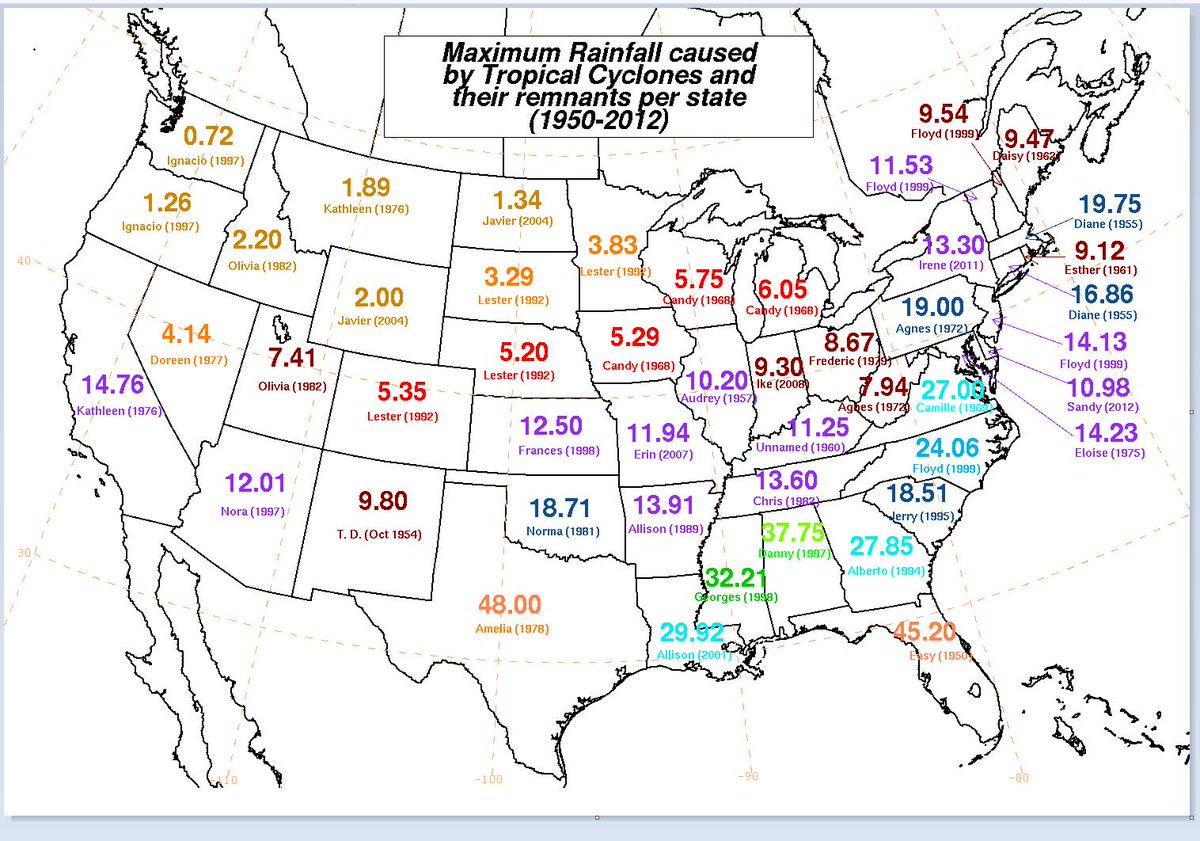
It shows that very wet events are not unknown to Texas so we hope they are prepared to deal with this one.
This is a photo shown on the Blog Category 6; Image Credit is Joe Raedle/Getty Images.
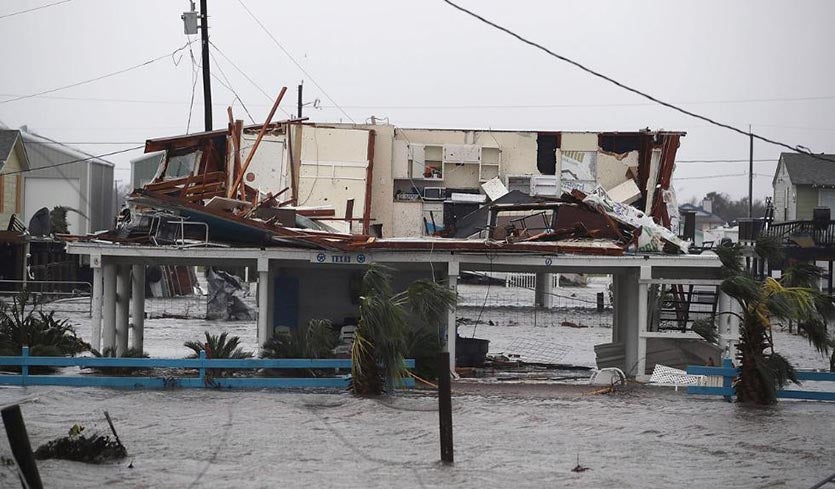
Rockport is about 40 miles Northeast of Corpus Christi and presumably exposed to the strongest winds which are often in the NE quadrant of the storm. Harvey’s winds declined rapidly so we should expect that wind damage now will be restricted to tornadoes which can be very deadly. The main story here will be the flooding.
Another Rockport photo
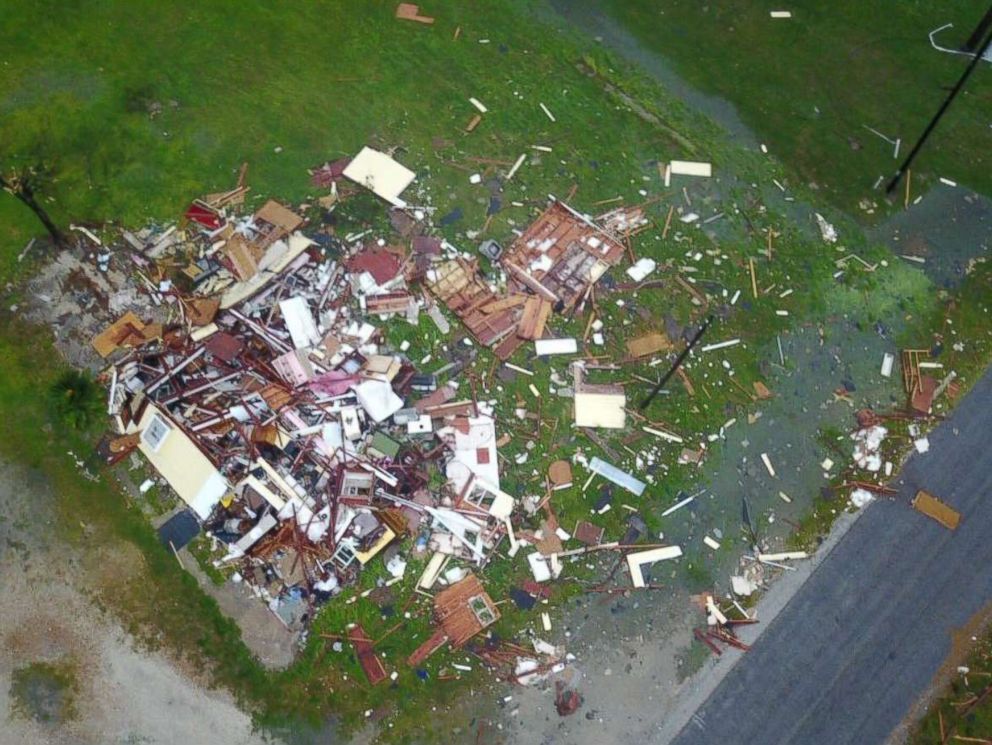
More photo coverage of Rockport can be found here. For some reason the photo credit that is on the photo in the article does not show up when I display the photo separately. It is Brian Emfinger/LSM
We should expect that damage reports may come in slowly since may areas have been evacuated and the media may not be allowed in until the areas are deemed to be save from down power lines etc.
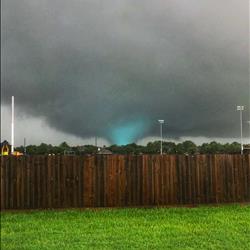
Tornadoes will cause a lot of damage. Right now they seem to be happening in the Cypress Area Northwest of Houston while in Houston flooding has been significant.
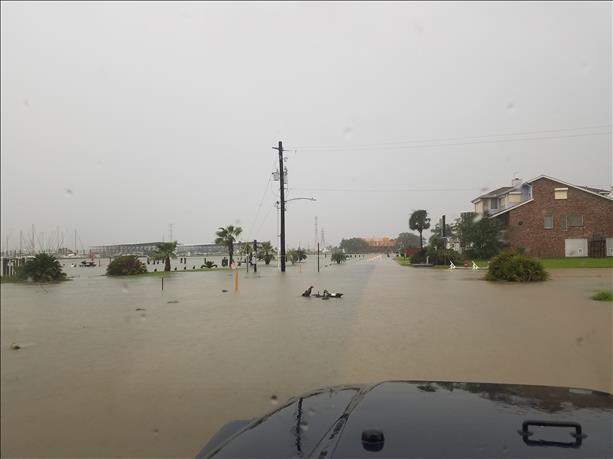
Source: Houston News KHOU
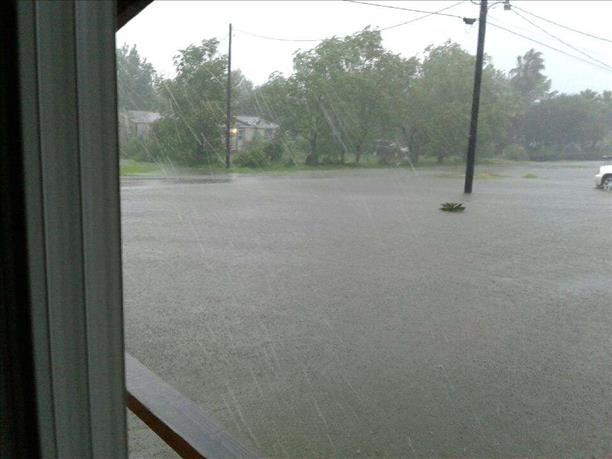
Same source for photos below: KHOU with the first photo credited to Kyra Respress.
and one more.
So far the reports of injured and deaths are amazingly low. That might change.
This is an excellent report from the Daily Mail in the UK – Lots of photos.
What Happens Next
It is important to understand that natural disasters often occur over a period of time, not instantaneously.
A good example is the rising of rivers which then overflow their banks and cause damage many hours and even days after the advent of a widespread storm. It takes time for this to happen and with Harvey we have a storm that is likely to provide the time for such subsequent events. Below, from NOAA, is a forecast for the San Bernard River. It is already at flood stage. Not sure how the river can rise to 35 feet once the level is so high that it can no longer be confined by the river banks but the graphic may be intended to show the severe level that is predicted. (If the normal level is x feet below the average river bank height, then all land within 35-x feet in elevation above normal water level will be flooded.)


