Written by Sig Silber
The ENSO Cycle is probably the primary determinant of average weather conditions around the World. So a forecast of an El Nino for this next Winter is worth paying attention to. GEI finds these predictions are implausible and this Update explains why. Basically, there is insufficient time to develop what is called the Western Pacific Warm Pool. This report will explain.

This is intended to be a fairly brief (for this author) explanation as we will be monitoring the situation each week in our regular Weather and Climate Reports and monthly with the NOAA and JAMSTEC Seasonal Outlook Updates. But this is a special report on why we think these early forecasts are unlikely to turn out to be correct.
A. Explanation of ENSO Cycle and El Nino
First we need to discuss the ENSO Cycle and the three main phases which are El Nino, La Nina and Neutral.
Basically the ENSO Cycle is the process where warm water measured as a deviation from normal (and the normal – also called climatology – is warming) tends to accumulate at certain times in the western part of the Pacific along the Equator due to the persistent Easterlies which are related to the rotation of the Earth. At some point, that process is interrupted and the warm water moves to the eastern part of the Pacific, still moving along the Equator. When the water is to the west, the condition is called La Nina. When to the east it is El Nino. When the situation is between the two extremes, it is called ENSO Neutral. Very simple.
Warm water tends to evaporate more rapidly than cooler water. Moist warm air tends to rise, in a process called convection, forming clouds. Over cooler water, the air subsides and these areas tend to be dry areas. This process involving areas with rising air and areas with subsiding air is called the Walker Circulation and occurs along the Equator. But what happens on the Equator also spreads to the poles, first via what is called the Hadley Circulation. So by a series of interactions with other weather processes, including importantly the jet streams, the conditions in the Equatorial Pacific have a big influence on Worldwide weather. We focus on the Pacific even though there is a similar process in the Atlantic because the Pacific is wider and typically warmer than the Atlantic.
So to predict the phase of the ENSO cycle meteorologists focus first on:
A. the pattern of surface water temperatures along the Equator in the Pacific.
B. the extent to which the atmospheric patterns are reacting to the changing sea surface temperature pattern.
That is all there is to it until one deals with the details. And then it gets more complicated because one needs to be able to measure current conditions and forecast future conditions.
The current conditions are measured by determining the deviation of actual sea surface temperatures from seasonal norms (adjusted for Global Warming) in certain parts of the Equatorial Pacific. The below diagram shows those areas where measurements are taken..

NOAA focuses on a combined area which is all of Region Nino 3 and part of Region Nino 4 and it is called Nino 3.4. They focus on that area as they believe it provides the best correlation with future weather for the U.S. primarily the Continental U.S. not including Alaska which is abbreviated as CONUS. Not surprisingly, Asian Meteorological Agencies pay somewhat more attention to the western regions shown in this map as those areas are closer to Asia and have a larger impact on Asian and Australian weather patterns. This leads to different periods of time being categorized slightly differently with regards to the ENSO state by different meteorological agencies. There is an index probably available daily for all five of the areas shown above and certainly readily accessible for the Nino 3.4 area. When averaged over a three-month period, the Index for the Nino 3.4 Region is called the Ocean Nino Index (ONI) and a Google Search will lead to much information on the ONI.
The historical approach of measurement of the impact of the sea surface temperature pattern on the atmosphere is called the Southern Oscillation Index (SOI) which is the difference between the atmospheric pressure at Tahiti as compared to Darwin Australia. It was convenient to do this as weather stations already existed at those two locations and it is easier to have weather stations on land than at sea. It has proven to be quite a good measure. The best information on the SOI is produced by Queensland Australia and that information can be found here. SOI is based on Atmospheric pressure as a surrogate for Convection and Subsidence. Another approach made feasible by the use of satellites is to to measure precipitation over the areas of interest and this is called the El Nino–Southern Oscillation (ENSO) Precipitation Index (ESPI). We covered that in a weekly Weather and Climate Report which can be found here. Our conclusion was that ESPI did not differentiate well between La Nina and Neutral.
And there is now a newer measure not regularly used called the Multivariate ENSO Index (MEI). More information on MEI can be found here. The jury is still out on MEI and it it is not widely used.
B. Current Forecasts
There are a variety of forecasts. Here are some.
Here is the CPC/IRI forecast issued on March 9, 2017.

This report is issued in conjunction with the ENSO Status Monthly Update and here are some excerpts from that Diagnostic Discussion.
Published: March 9, 2017
El Niño/Southern Oscillation (ENSO) Diagnostic Discussion issued jointly by the Climate Prediction Center/NCEP/NWS and the International Research Institute for Climate and Society
ENSO Alert System Status: Not Active
Synopsis: ENSO-neutral conditions are favored to continue through at least the Northern Hemisphere spring 2017, with increasing chances for El Niño development into the fall.
Most models predict the continuation of ENSO-neutral (3-month average Niño-3.4 index between -0.5°C and 0.5°C) through the early Northern Hemisphere summer (May-July; Fig. 6). However, some dynamical model forecasts, including the NCEP CFSv2, anticipate an onset of El Niño as soon as the late Northern Hemisphere spring (March-May 2017). Because of typically lower skill in forecasts made at this time of the year, and the lingering La Niña-like tropical convection patterns, the forecaster consensus favors ENSO-neutral during the spring (March-May) with a ~75% chance. Thereafter, there are increasing odds for El Niño toward the second half of 2017 (50-55% chance from approximately July-December). In summary, ENSO-neutral conditions are favored to continue through at least the Northern Hemisphere spring 2017, with increasing chances for El Niño development into the fall (click CPC/IRI consensus forecast for the chance of each outcome for each 3-month period).
Here is the daily PDF and Spread Corrected version of the NOAA CFSv2 Forecast Model.

The estimated current value of the Nino 3.4 Temperature Anomaly after the adjustments have been applied is an ENSO Neutral Value now with a warm bias and shooting higher rapidly this month. Looking ahead to next summer you see El Nino readings (0.5C or higher) being the mean of the forecast ensemble but it is before the Spring Prediction Barrier which means we need to wait a few months until May [click here to understand why] before getting too excited about that.
Forecasts from Other Meteorological Agencies.
Here is the Nino 3.4 report from the Australian BOM (it updates every two weeks)

Discussion (notice their threshold criteria are different from NOAA).
El Niño WATCH: likelihood of El Niño in 2017 increases
The El Niño-Southern Oscillation (ENSO) remains neutral. However, recent changes in both the tropical Pacific Ocean and atmosphere, and climate model outlooks surveyed by the Bureau, suggest the likelihood of El Niño forming in 2017 has risen. As a result, the Bureau’s ENSO Outlook status has been upgraded to El Niño WATCH, meaning the likelihood of El Niño forming in 2017 is approximately 50%.
All atmospheric and oceanic indicators of ENSO are currently within neutral thresholds. However, sea surface temperatures have been increasing in the eastern Pacific Ocean and are now warmer than average for the first time since June 2016, while the Southern Oscillation Index (SOI) has been trending downwards.
Seven of eight international models surveyed by the Bureau indicate steady warming in the central tropical Pacific Ocean over the next six months. Six models suggest El Niño thresholds may be reached by July 2017. However, some caution must be taken at this time of year, with lower model accuracy through the autumn months compared to other times of the year.
Here is the February 1, 2017 JAMSTEC Nino 3.4 Forecast. The March 1 forecast is due out very soon but it has not yet been issued.

The Discussion that goes with their Nino 3.4 forecast will be updated in about a week but here is what was issued on February 18. Important is the suggestion by JAMSTEC that we might be having a Pacific Climate Shift to PDO Positive if there is indeed an El Nino this Winter. That is one of many reasons that we issued this Update as we do not think there will be an El Nino this coming Winter, as we have been and will be explaining.
Feb. 18, 2017
Prediction from 1st Feb., 2017ENSO forecast:
The SINTEX-F now clearly predicts an El Niño event from this coming summer. This may suggest a decadal turnabout in the tropical Pacific climate condition to El Niño-like state after a long spell of La Niña-like state. If this happens, such natural climate variability may double the global warming impact as we observed during the period from 1976 through 1998.
C. Why the Forecast of an El Nino is Implausible.


D. How the Walker Circulation Varies with the Phases of ENSO
Now we take a look at the Walker Circulation which is where the warm water causes evaporation and convection (cloud formation) and where these clouds tend to drop their precipitation which creates downwards air movements. The colors also reveal the location of warmer than climatology and cooler than climatology Sea Surface Temperatures (SST) which are used to define the pattern.
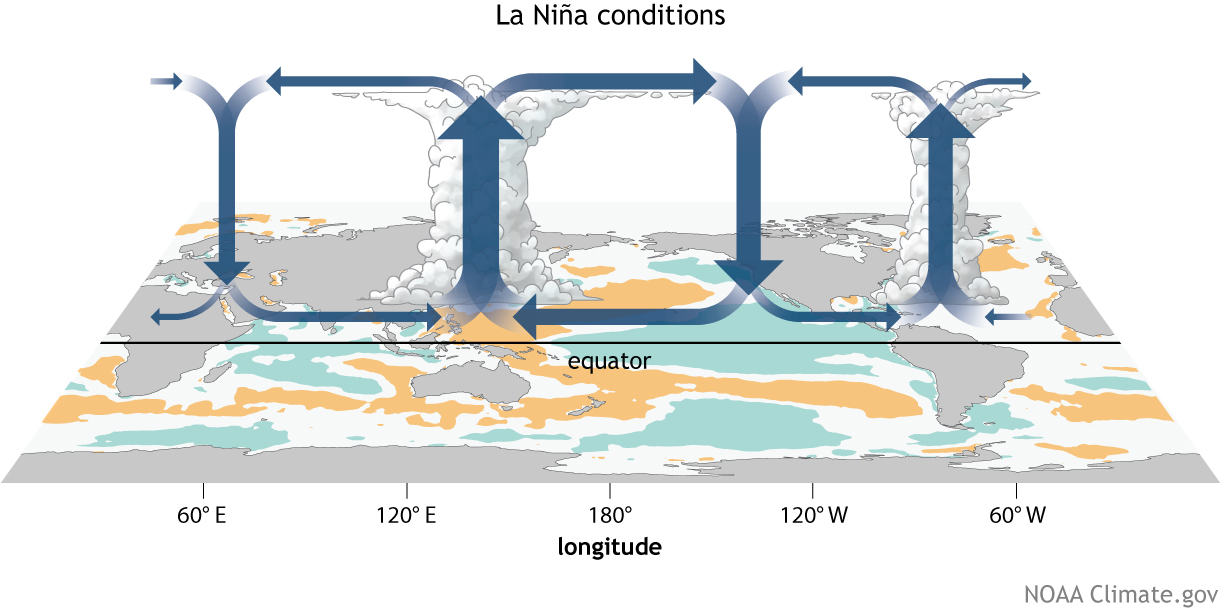
It is difficult to see the difference between the La Nina (above) and Neutral conditions (below) but you should pay attention to the more pronounced (darker – thicker arrows) convection zone in the El Nino state as compared to the Neutral state and similarly the stronger subsidence zone in the La Nina state. Subsidence tends to warm and dry air masses.
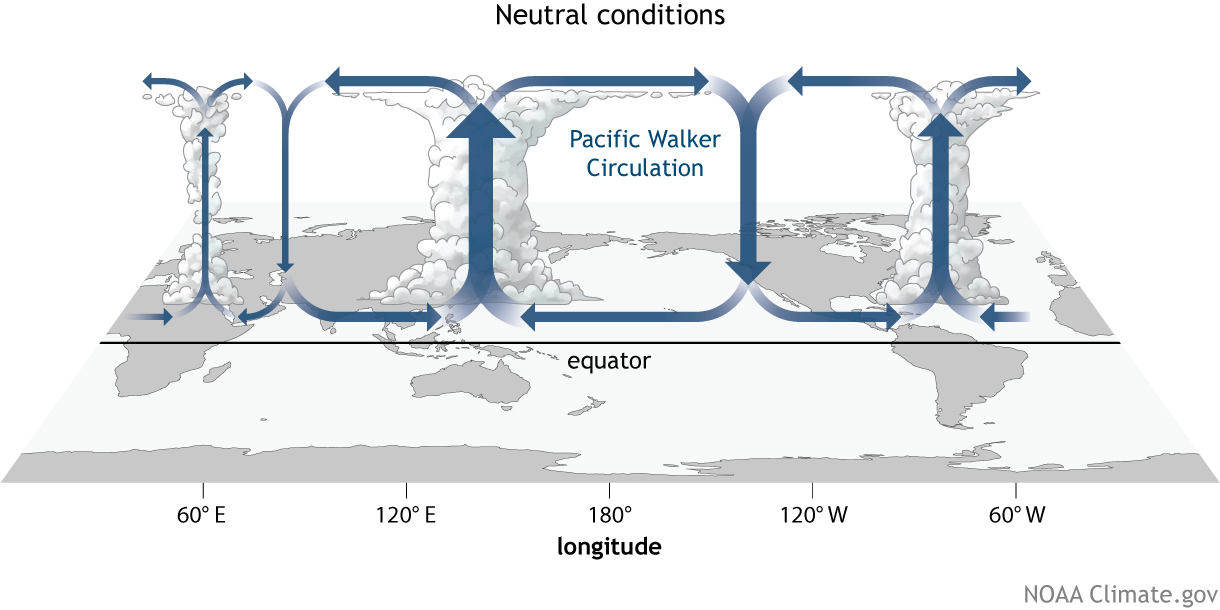
It is a lot easier to see the different between Neutral and El Nino as the pattern tends to reverse with Convection Zones converting to Subsidence (drying) Zones.

Every ENSO event is slightly different so these graphics of Walker Circulations are meant to be guides only.


