Written by Sig Silber
NOAA has issued their Seasonal Outlook Update. I also have an update from Japan which differs substantially for the U.S. from the NOAA Outlook with respect to temperature and precipitation although I think it is a month old even though just recently posted. Part of what is interesting is the situation of our three major ocean indices. They are important as they may have decadal implications not just being a predictor for weather over the next six months. And then we have our problem child the Warm Event which has clearly been a Near El Nino Modoki not an actual Traditional El Nino but which is giving signs of maturing into the real thing or perhaps somewhat of a hybrid between a Traditional El Nino and a Modoki Type II. Sorting all this out is not easy especially since the PDO and ENSO are highly but not perfectly correlated. This week I am mostly providing government forecasts. Next week I will try to add additional information to the analysis. Oh, I also graded NOAA’s performance this winter and have given them a C+.

This is the Regular Edition of my weekly Weather and Climate Update Report. Additional information can be found here on Page II of the Global Economic Intersection Weather and Climate Report.
Clean Up
Before we get into the latest release of information from NOAA, I thought I ought to provide a little more explanation on one topic. Last week I discussed how the SOI and atmospheric and land Warming are correlated. I may not have provided sufficient information on how the process works. This from Wikipedia might provide some additional useful information.
“For example, when water evaporates, energy is transferred from a water molecule to an air molecule that contains less water vapor than its surroundings. Because energy is required for the water molecule to overcome the forces of attraction between water particles, the transition from water to vapor requires an input of energy and causes a temperature drop in the water molecule’s surroundings.
If the vapor then condenses to a liquid on a surface, then the vapor’s latent energy absorbed during evaporation is released as the liquid’s sensible heat onto the surface.
Thus not only does convection transfer energy from the ocean to the atmosphere, the movement of water vapor by wind transfers the location of where this happens to where the water vapor created by evaporatlon is reconverted to latent heat as cloud droplets releasing sensible heat i.e. heat that can be felt and measured by a thermometer.
NOAA Seasonal Outlook Update
The maps speak for themselves so for purposes of brevity I am not presenting much of the NOAA discussion but it can be found with the maps in Part II of this Report. The NOAA discussion partly explains what the maps are showing so you can look at the maps and find the same information visually. The NOAA discussion this month is very good and also provides some explanation as to why the maps were drawn as they were and for those with that level of interest, the discussion can be found here on Page II of the Global Economic Intersection Weather and Climate Report. It will remain there until NOAA releases updates.
I wanted to focus here on a very important part of the discussion the overall state of our oceans rather than zero in on El Nino which remains a work in progress that may or may not occur this winter (but is increasingly predicted to occur). After the discussion on ocean cycles, I will provide the maps which are pretty much self-explanatory.
In conjunction with that, the following graphic shows the recent evolution of the conditions in our oceans. IT TAKES A FEW SECONDS TO RUN SO PLEASE BE PATIENT. It shows the Warm Event along the Equator dissipating or turning into a Modoki Type II i.e. cold Eastern Pacific, warm Central Pacific (mostly west of the Date Line) and warm water off the Northwest Coast of the U.S. Recent changes may be indicating that the Modoki is cleaning up its act and beginning to take on the characteristics of a more Traditional El Nino. Watch the last frames which represent the most recent conditions carefully! You can clearly see warm water off of Ecuador. The Gulf of Mexico has changed also. The warming in the Gulf of Mexico clearly is having significant impacts on CONUS weather. The blue areas in the Western Pacific and off of Africa are also of interest. One can learn a lot by just observing the pattern of SST anomalies.
Below is the NOAA forecast of June, July and August Sea Surface Temperatures (SST). It is fairly dramatic.
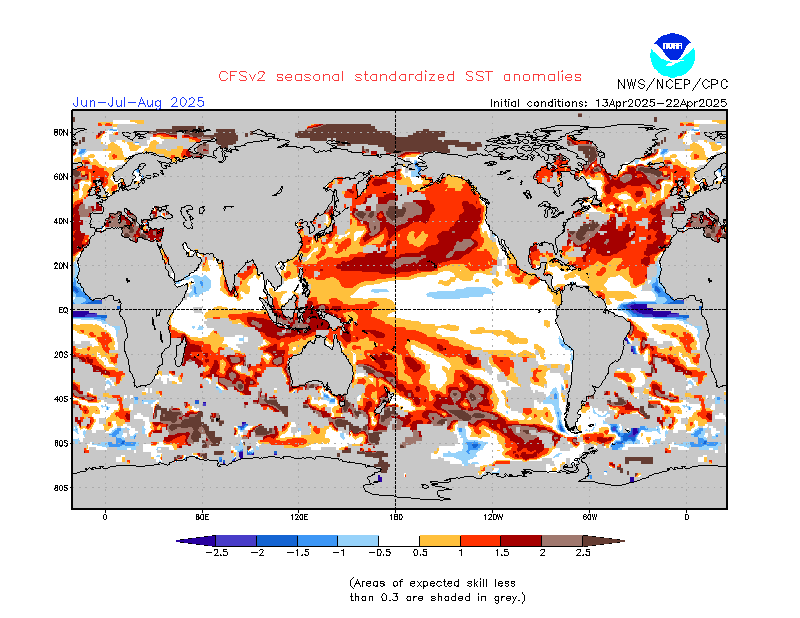
For some reason, I can’t display the further out NOAA forecast maps as a group (not sure why but the on-line editor I use will not accept them as a single page of multiple forecasts). But the other maps in that series can be found here. I have very low confidence in the model’s forecasting ability especially further out in time.
And here is the Japanese SST Forecast for June-July-August which is related to their model. It has lower resolution than the NOAA model but in some ways that makes it easier to read. Unfortunately it is a month out of date as compared to the NOAA forecast but given that both are forecasts for the same three-month period, they are able to be compared. The overall pattern is quite similar but a bit less amplified. I am hoping to have an updated JAMSTEC forecast soon.

To me this still looks like a Modoki Type II Pattern but we have to wait to see how JAMSTEC describes it. Well actually we have that discussion now and it seems that JAMSTEC is thinking that this will evolve into a Traditional El Nino. But at this point in the discussion I am focused more on the lower-frequency cycles namely the PDO, AMO and the IOBD.
Looking out a bit further, it looks very similar but even more Modoki-ish (see western extension of the warm anomaly). That is why I am very interested in seeing the April update of the SINTEX-F model runs. But you do see the warm water off the coast of South America. And that is characteristic of a Traditional El Nino. But it does not extend down to Peru which would be the case with a strong Traditional El Nino.

For all of the above graphics, it appears to be a PDO+ pattern and especially in the JAMSTEC forecast and in the NOAA animation the Atlantic looks to me to be what is called a Tripole AMO with warm water off of Newfoundland and Florida with cold anomalies off of the Northeast. So one might expect close to a neutral AMO but I am guessing. Actually I wrote this on Wednesday and then it was just my guess but by Thursday Morning at 8:30 am EST, it was also the NOAA assessment of the situation as well and the first time that I recall that NOAA is really paying attention to the Atlantic. We have three oceans that impact climate worldwide. All three impact the climate everywhere, not just where they are located. People living in the U.S. and probably Europe as well tend to not pay as much attention to the Indian Ocean. But this planet is mostly water with a small percentage of land. Precipitation comes from our oceans. Our temperature is controlled by the oceans. Everything else is recirculation. Precipitation on land can return to the atmosphere and fall again on land as precipitation but the highest percentage of precipitation comes off our oceans. The oceans are where the water is. That would be even more obvious if one was looking at a Globe rather than a Mercator Projection where the land masses away from the Equator appear larger than they really are.
So if you want to understand what our weather is going to be like, you have to pay attention to what is happening with our oceans. Even Global Warming works through our oceans as I discussed last week. Land has very limited capacity to store heat. The atmosphere has some but the main heat storage facility is the oceans. With the Atmosphere, the mixing of temperatures takes place very rapidly. Not so with oceans. So you have patterns of temperature anomalies in oceans that can last for decades and control weather for decades. That is why it is so important to pay attention to sea surface temperature (SST) anomalies.
As with most things, you can rely on the current state of oceans more than a forecast. But I think you can see that we have a pretty good idea of the current situation of our oceans and where things are headed in the near-term. These maps really tell you all you need to know to forecast our weather.
NOAA Discussion of the State of Our Oceans
“ANOTHER IMPORTANT FEATURE THAT IMPACTED THE OUTLOOK IS THE PATTERN OF SSTS ACROSS THE EXTRATROPICAL PACIFIC WHICH CONTINUES TO SHOW LARGE POSITIVE ANOMALIES (BETWEEN 2-3 DEGREES ABOVE NORMAL IN SOME AREAS) FROM JUST SOUTH OF ALASKA EASTWARD AND SOUTHWARD ALONG THE WEST COAST OF NORTH AMERICA TO HAWAII. THIS SST PATTERN CONTINUES TO PROJECT VERY STRONGLY ONTO A POSITIVE PDO PATTERN. IN FACT THE MARCH 2015 VALUE WAS +2.0, CONTINUING A TREND OF RECORD AND NEAR RECORD MONTHLY POSITIVE PDO VALUES SEEN THIS PAST WINTER AND EARLY SPRING. THE ATLANTIC MULTIDECADAL OSCILLATION (AMO) INDEX CALCULATED AT NOAA/ESRL/PSD IS -0.109, WHICH IS THE LOWEST SINCE APRIL“
So we have a forecast that is based on PDO+ and AMO Neutral plus an EL Nino where the impacts are highly correlated with the impacts of PDO+. That is why it is difficult to determine what the drivers are of the forecast since two of the drivers are very highly correlated.
Let us now take a look at the forecast maps
Three-Months
Notice the weather pattern in the Southwest appears to be more related to conditions in the Gulf of Mexico than the state of the Pacific. There is not much difference between the May and the Three-Month Outlook.
15 Month Temperature (you need to add May from above to get 15 months).
Notice that NOAA is comfortable projecting temperature out through the full forecast period. Notice the warm northern tier and cold southern tier pattern for this coming winter.
Precipitation
Notice that NOAA appears now to be comfortable projecting precipitation out to Feb-March-April 2016. Notice the wet southern tier and the dry in parts of the northern tier. It may be an El Nino and it may be PDO+ but most of California is not projected to participate.
If you want larger versions of each map (temperature and precipitation) you can find them here. And each of those maps can be clicked on to further enlarge them. Of course warm/cold/wet/dry are relative to climatology and are expressed not as magnitudes but probabilities of being greater or less than climatology.
The overall pattern of precipitation does not fit exactly with any of the McCabe conditions shown below (and again later in this report when I discuss the NOAA analogs associated with the 5 – 14 Day Outlook). And yet NOAA is projecting a neutral AMO and a positive PDO. I think that means that small deviations in the pattern in the Atlantic will have a large impact on the location of the Jet Stream and the pattern of precipitation and temperature. We may be fluctuating between McCabe A and McCabe C throughout the winter. I think you will see the match between the NOAA Maps and the McCabe Maps. To a large extent the McCabe Maps also reflect temperature with Red being warm and Blue being cold. So NOAA appears to be leaning towards McCabe A relative to precipitation and McCabe C relative to temperature.

Red is a high likelihood of drought, blue the opposite. To a large extent, red also represents warmer and blue colder than climatology. But that is my interpretation not a conclusion reached by McCabe et al.
I pay a lot of attention to the analogs issued by NOAA every day with their 6 – 14 Day Outlooks. I scan them every day and analyze them in detail on Mondays the day I publish. A while back there were Mondays where the majority of analogs were clearly associated with the same ocean condition at least in terms of the dates of the analogs. Recently the ocean phases related to the analog dates have been all over the place. I have not drawn a conclusion as to what that means. My working hypothesis is that we are in a transitional stage and our current weather is not yet highly correlated with ocean conditions. That is also my explanation as to why the Seasonal Outlooks and the 6 – 14 Day Outlooks are not very much in sync. Without knowing for sure, I assume that NOAA has noticed this. Another possible explanation is the high correlation between El Nino and PDO+. Last week we had no analogs associated with an El Nino. Readers may wonder why I present the analog analysis. Nothing I do is haphazard. I value your time as a reader and my time as a writer so there is always a reason why I present certain information. It may not be that I have figured it out yet, but it will always be that I consider it to be relevant.
Forecasts from Around the World
Japan has indicated that they are having computer problems but this week they updated their website to show their March 1 model results. They may update their website at any moment with their April results. I have not shown it before but they also issue a temperature and precipitation forecast that goes with their model and since NOAA has issued their Seasonal Forecast, I thought it would be useful to show the Japanese Forecast. But keep in mind it is based on a March 1 model run. Below is their Temperature Anomaly Forecast for June, July, and August. It is pretty dramatic. I grew up in Atlantic City New Jersey and my parents would not have been happy to see this sort of forecast. We wanted the folks in NYC and Philadelphia to be hot and desirous of going to “the shore”. Also I might add, this does not look good for beer sales.

And Japan also recently issued their temperature forecast out through September – November of 2015. It is different from the NOAA forecast. But again although it was posted recently, I believe it is based on their March 1 model run.

And below is their Precipitation Forecast for June, July and August. I can not decipher the scale for the U.S. Assuming it is about .5 mm per day, that would be 15 millimeters per month or 0.6 inch which on the East Coast might be barely noticeable but where I live this apparent forecast of a good North American Monsoon would be very welcome. Notice that Texas and Florida do not share the increased precipitation. The situation for India looks pretty dire. Again I am having trouble differentiating the color codes but that looks like dark brown to me over India. Where do you live and what if this forecast were correct would it mean to you? Why not post a comment. I presented the new outlook from Australia last Monday and this differs re the precipitation forecast but not re the IOD forecast. I wonder what the accuracy of the Japanese SINTEX-F model has been. I believe it is held in high regard.

And here is their forecast further out Sept – Nov and it is quite a bit different than the NOAA forecast but again it is presumably based on a March 1 model run. TO ME THIS IS THE MODOKI INTERPRETATION OF AN EL NINO. And for CONUS, especially the Southwest, an El Nino Modoiki is often pretty much equivalent to a La Nina. Who has this correct? Obviously I am very interested in seeing this forecast updated to reflect an April 1 date for their model runs.

The Australian Queensland Bureau of Meteorology uses the SOI to make a worldwide precipitation forecast and here it is. It is interesting because it is based on just one variable: the air pressure differential between Tahiti and Darwin Australia.

You can read about it here. I have not researched the skill level of this tool and the SOI is mostly a tropical index, but I include it because it is interesting. They have a new model under development but I am not sure that I could post it as it is under password control as it is still experimental.
Who has been the most Correct? NOAA, JAPAN, Australia, GEI?
I will let you be the judge. Below is the actual temperature and precipitation anomalies for the past 30 days ending April 18, 2015

And here is 90 days

And my quote on this matter:
“If you see an El Nino effect here please point it out to me. Perhaps it impacted Mexico and the Northeast of CONUS but I suspect that both impacts were the RRR in action as suggested when you have a Modoki Type II. CONUS did not have an El Nino winter so clearly NOAA has been off base. Japan and Australia have been on target and here at GEI I have observed that Japan and Australia have had a better understanding of the situation so many of my comments have been based on what seemed to me to be better science.”
We will now shift timeframes dramatically. Current (Now to 5 Days) Weather Situation:
For daily forecasts it is better to consult your local weather service or the weather service where you are traveling as these will be more specific. But I do have daily forecasts on Page II of the Report so you can always look at those as they auto-update. What I present here is information that normally is not made available via local weather forecasts and which can help you understand what some of the major drivers are for the local forecast.
First here is a national 12 hour to 60 hour forecast of weather fronts shown as an animation. Beyond 60 hours, the maps are available in Part II of the Global Economic Intersection Weather and Climate Report.

The explanation for the coding used in these maps i.e. the full legend can be found here.
Sometimes it is useful to take a look at the location of the Jet Stream or Jet Streams. This and the following graphic update every six hours. The split jet stream may be related to the Warm Event.

And sometimes the forecast is revealing. Below is the forecast out five days.

To see it in animation, click here.
This longer animation shows how the jet stream is crossing the Pacific and when it reaches the U.S. West Coast is going every which way. One can imagine that attempting to forecast this 6 – 14 days out is quite challenging and NOAA is having fits attempting to guess how this will play out over a 14 day period especially for the Southwest.
And below is another view which highlights the surface highs and the lows re air pressure on Day 3. The RRR remains but is further out to sea and in fact a Low Pressure system has slipped in between the RRR and the West Coast off of British Columbia. You can see how the counter-clockwise Low and the clockwise High are now potentially able to move storms into California. It is amazing to me that this far into Spring I am seeing so many cold fronts on this map. But the situation is changing rapidly.

And here is Day 6. The Low over the Midwest which was visible (as a Day 3 feature) on Saturday has shifted East as I look at this Day 6 forecast on Monday aftenoon and is projected to be moving offshore. The changes projected out 3 Days beyond the Day 3 forecast (to Day 6) are substantial and by the time the reader sees this map, which auto-updates, the situation may again look very much different.

Outlook Days 6 – 14
Let us take a look at what was issued today April 20, 2015. It will auto-update every day so it will be changing day by day (and thus be up to date whenever you elect to read this report) but my comments as well as the comments of NOAA may become out of sync with the map since these comments do not auto-update.
Generally I only show the “second week” namely the 8 -14 Day Outlook. The first week (6 – 10 Day Outlook) together with much additional information on current weather patterns and near-term forecasts can be found in Part II of my report, but 8 – 14 days covers most of the 6 – 14 day period.
Here is the Early Outlook May Temperature Outlook

And here is the April 8 – 14 Day Temperature Outlook issued today April 20, 2015. It covers most of the first week of May.

Remember that the 8 – 14 day outlook only covers 9 days not the full month and the map shown only covers seven days. But May already appears to be developing differently than indicated in the May Outlook issued just four days ago. Of course the first four or five days of a month does not define the month.
And here is the Early May Precipitation Outlook Issued on April 16, 2015.

Here is the 8 – 14 Day Precipitation Outlook issued today April 20, 2015.

And again remember that this map shows only seven days and the full 6 – 14 Day Outlook only covers nine days. There are 30 days in May. But the month of May looks to start out differently than the full-month Outlook. It is important to note that for the last several days, the NOAA 6 – 14 Day Outlooks have been fluctuating quite a bit indicating the difficulty of making forecasts beyond 72 hours right now.
And here are excerpts from the NOAA release today April 20, 2015.
“6-10 DAY OUTLOOK FOR APR 26 – 30 2015
TODAY’S ENSEMBLE MODEL SOLUTIONS ARE IN FAIRLY GOOD AGREEMENT ON THE 500-HPA FLOW PATTERN EXPECTED OVER MUCH OF NORTH AMERICA AND VICINITY. ALL MODELS ARE FORECASTING A TROUGH OVER THE GULF OF ALASKA, AND A RIDGE OVER THE WESTERN AND CENTRAL CONUS. FARTHER TO THE EAST, A CLOSED 500-HPA LOW IS PREDICTED BY ALL OF TODAY’S MODEL SOLUTIONS OVER NORTHEASTERN NORTH AMERICA WITH NEGATIVE 500-HPA HEIGHT ANOMALIES FORECAST OVER THE EASTERN CONUS.
BELOW NORMAL TEMPERATURES ARE FAVORED FOR MUCH OF THE GREAT LAKES AND EASTERN CONUS IN ASSOCIATION WITH BELOW NORMAL 500-HPA HEIGHTS. ABOVE NORMAL TEMPERATURES ARE FAVORED FOR THE FLORIDA PENINSULA AND ALONG THE GULF COAST CONSISTENT WITH BIAS CORRECTED TEMPERATURES FROM THE ECMWF, GFS, AND CANADIAN ENSEMBLES, AND WITH GEFS REFORECAST GUIDANCE. RIDGING OVER NORTHWESTERN NORTH AMERICA INCREASES THE CHANCES FOR ABOVE NORMAL TEMPERATURES FOR THE CENTRAL CONUS. ANOMALOUS SOUTHEASTERLY FLOW FROM A LOW PRESSURE PREDICTED OVER THE GULF OF ALASKA LEADS TO ENHANCED PROBABILITIES FOR ABOVE NORMAL TEMPERATURES FOR EASTERN AND CENTRAL ALASKA, THE ALEUTIANS AND THE ALASKA PANHANDLE.
BELOW MEDIAN PRECIPITATION IS FAVORED FOR THE GREAT LAKES WEST OF A CLOSED 500-HPA LOW PREDICTED OVER EASTERN NORTH AMERICA. PROBABILITIES OF BELOW MEDIAN PRECIPITATION ARE ENHANCED NEAR THE RIDGE POSITION OVER THE SOUTHERN CONUS. ENHANCED PROBABILITIES OF ABOVE MEDIAN PRECIPITATION ARE INDICATED FOR MUCH OF THE NORTHWESTERN CONUS IN ASSOCIATION WITH A MEAN TROUGH PREDICTED OFF THE WEST COAST. ABOVE MEDIAN PRECIPITATION IS ALSO FAVORED FOR THE SOUTHEASTERN COUNS CONSISTENT WITH PRECIPITATION ESTIMATES FROM THE GFS AND ECMWF CALIBRATED REFORECAST TOOLS. EXCEPT FOR THE ALASKA PANHANDLE, THERE ARE ENHANCED CHANCE OF BELOW MEDIAN PRECIPITATION FOR ALASKA AND THE ALEUTIANS WEST OF A TROUGH PREDICTED OVER THE GULF OF ALASKA.
FORECAST CONFIDENCE FOR THE 6-10 DAY PERIOD: AVERAGE, 3 OUT OF 5, DUE TO FAIRLY GOOD ENSEMBLE MEAN AGREEMENT OFFSET BY LARGE SPREAD AMONG ENSEMBLE MEMBERS OVER THE NORTHERN CONUS
8-14 DAY OUTLOOK FOR APR 28 – MAY 04, 2015
TODAY’S WEEK TWO ENSEMBLE MEAN SOLUTIONS DEPICT MEAN 500-HPA TROUGHS OVER THE GULF OF ALASKA AND OVER SOUTHEASTERN CANADA, WITH A RIDGE OVER WESTERN CANADA AND MUCH OF CENTRAL CONUS. A TROUGH IS FORECAST OFF THE WEST COAST OF THE NORTH AMERICA WITH AN ENERGETIC SHORT WAVE NEAR THE SOUTHWESTERN CONUS. MODEL SPREAD IS FAIRLY HIGH OVER MUCH OF NORTH AMERICA DURING THE OUTLOOK PERIOD, ESPECIALLY IN THE NORTHERN STREAM. AS A RESULT OF THIS UNCERTAINTY, TODAY’S WEEK TWO 500-HPA MANUAL HEIGHT BLEND IS BASED PRIMARILY ON THE ENSEMBLE MEAN SOLUTIONS.
ABOVE-NORMAL TEMPERATURE PROBABILITIES ARE ENHANCED FOR ALASKA, THE ALEUTIANS AND THE ALASKA PANHANDLE IN ASSOCIATION WITH THE POSITIVE 500-HPA HEIGHT ANOMALIES. BELOW-NORMAL TEMPERATURES ARE FAVORED FOR MUCH OF EASTERN CONUS AND THE GULF COAST NEAR THE FORECAST TROUGH EXCEPT THE FLORIDA PENINSULA.
ABOVE-NORMAL TEMPERATURES ARE FAVORED FOR MUCH OF THE SOUTHERN PLATEAU, THE CENTRAL AND SOUTHERN HIGH PLAINS RELATED TO THE POSITIVE 500-HPA ANOMALIES PREDICTED. PROBABILITIES OF BELOW MEDIAN PRECIPITATION ARE ENHANCED WEST OF THE PREDICTED TROUGH FOR PARTS OF THE CENTRAL PLAINS, UPPER MISSISSIPPI VALLEY, AND THE GREAT LAKES. ENHANCED PROBABILITIES OF BELOW MEDIAN PRECIPITATION ARE INDICATED FOR MUCH OF THE WESTERN CONUS IN ASSOCIATION WITH A MEAN RIDGE PREDICTED. ABOVE MEDIAN PRECIPITATION IS FAVORED FOR THE WESTERN TEXAS, NORTHWESTERN AND SOUTHEAST COAST CONSISTENT WITH PRECIPITATION ESTIMATES FROM THE GFS AND ECMWF CALIBRATED REFORECAST TOOLS. THERE ARE ENHANCED PROBABILITIES OF BELOW MEDIAN PRECIPITATION FOR ALASKA AND THE ALEUTIANS WEST OF THE TROUGH FORECAST OVER THE GULF OF ALASKA.
FORECAST CONFIDENCE FOR THE 8-14 DAY PERIOD IS: AVERAGE, 3 OUT OF 5, DUE TO RELATIVELY GOOD AGREEMENT AMONG THE ENSEMBLE MEAN SOLUTIONS OFFSET BY LARGE SPREAD AMONG THE COMPONENT ENSEMBLE MEMBERS OVER MUCH OF NORTH AMERICA.“
Analogs to Current Conditions
Now let us take a detailed look at the “Analogs” which NOAA provides related to the 5 day period centered on 3 days ago and the 7 day period centered on 4 days ago. “Analog” means that the weather pattern then resembles the recent weather pattern and was used in some way to predict the 6 – 14 day Outlook.
Here are today’s analogs in chronological order although this information is also available with the analog dates listed by the level of correlation. I find the chronological order easier for me to work with. There is a second set of analogs associated with the outlook but I have not been analyzing this second set of information. This first set applies to the 5 and 7 day observed pattern prior to today. The second set which I am not using relates to the forecast outlook 6 – 10 days out to similar patterns that have occurred in the past during the dates covered by the 6 – 10 Day Outlook. That may also be useful information but they put this set of analogs in the discussion with the other set available by a link so I am assuming that this set of analogs is the most meaningful.
Analog Centered Day | ENSO Phase | PDO | AMO | Other Comments |
| 1962 April 1 | Neutral | – | + | |
| 1962 April 6 | Neutral | – | + | |
| 1964 April 7 | La Nina | – | Neutral | Right after an El Nino Modoki Type I |
| 1969 April 12 | El Nino | – | – | Modoki Type II |
| 1969 April 14 | El Nino | – | – | Modoki Type II |
| 1974 April 12 | La Nina | – | – | Middle of three years of La Nina conditions |
| 1980 March 31 | Neutral | + | – | |
| 1994 May 3 | Neutral | + | – | An El Nino* developed later that year |
| 2007 April 24 | Neutral | – | + | After an El Nino* followed by a La Nina |
* means simply an event not recorded by all weather services generally because the criteria in Asia are slighly different.
This week there are five ENSO Neutral and two La Nina and two El Nino Modoki Type II analogs. NOAA provides me with two groups of five and I discard the duplicates and this week there was one duplicate. The 1974 analog is interesting as it is in a three-year period with two La Ninas that ran back to back. The Ocean Phases of the analogs this week are inconclusive but seem to favor McCabe Condition B and one can see some similarity between McCabe B and the NOAA 6 – 14 Day Outlook which suggests to me that the Atlantic is more influential right now than the Pacific which is contrary to the general perception but I am just trying to interpret the analogs.
Red is a high likelihood of drought, blue the opposite.
Progress of the Warm Event
From the NOAA release on Thursday
CURRENT ATMOSPHERIC AND OCEANIC CONDITIONS
DURING MID-APRIL, SST ANOMALIES ACROSS THE ENTIRE EQUATORIAL CENTRAL AND EASTERN PACIFIC BASIN ARE AT LEAST +0.5C WITH SOME AREAS NEAR THE DATE LINE AND JUST OFF THE SOUTH AMERICAN COAST GREATER THAN 2.0 DEGREES ABOVE AVERAGE. THE LATEST NINO3.4 VALUE IS +0.7C. AT DEPTH, THERE IS CURRENTLY A LARGE RESERVOIR OF ABOVE-AVERAGE OCEAN TEMPERATURES FROM 160E TO THE SOUTH AMERICA COAST TO NEARLY A DEPTH OF 200 M IN SOME LOCATIONS (NEAR 160W). A STRONG, SLOW MOVING DOWNWELLING OCEANIC KELVIN WAVE CONTINUES TO BE EVIDENT ACROSS THE EASTERN PACIFIC PORTION OF THE BASIN. THE OVERALL ANOMALOUS OCEANIC HEAT CONTENT FROM THE SURFACE TO A DEPTH OF 300 METERS FROM THE DATE LINE TO 100W IS STRONGLY POSITIVE RUNNING AT +1.8C. THE POSITIVE SUBSURFACE HEAT ANOMALY PROVIDES A SOURCE OF WARMER-THAN-AVERAGE OCEAN WATER FOR CONTINUATION OF POSITIVE SURFACE TEMPERATURE ANOMALIES FOR THE NEXT SEVERAL SEASONS [Editor’s Note: One Kelvin Wave does not cover several seasons. That is what is meant by the Spring Prediction Barrier].
I thought I would recalculate the ONI again as I have been doing recently. The little tick marks on the chart can be used instead of a ruler. When I print out this graphic one tick is about one centimeter. So you can use a ruler or just estimate the number (including fractions) of tick marks.

So as of Monday April 20 in the afternoon working from the April 19 TAO/TRITON report, this is what I calculated.
| Anomaly Segment | Midpoint | Length on Equator in number of five degrees of latitude (ticks) | Midpoint X Length (tempxticks) |
| -0.5C to 0C | -0.25 | 0 | 0 |
| 0C to +0.5C | +0.25 | 0 | 0 |
| +0.5C to 1.0C | +0.75 | 0 | 0 |
| 1.0C to 1.5C | +1.25 | 5? | 6.25 |
| 1.5C to 2.0C | +1.75 | 0? | 0 |
| Total | 5 Ticks (or 5 centimeters) | 6.25 | |
| Estimated ONI the NINO 3.4 Anomaly | 6.25/5 = 1.25 C |
My estimate of the Nino 3.4 ONI is now 1.25 which is a very respectable value and possibly close to the peak that will be recorded for this event within this Kelvin Wave episode. Notice it is now warm both north of the Equator and south of the Equator. The asymmetry around the Equator has however increased a bit. I think the NOAA reading is a bit too low and will be reported as higher next week. Remember that NOAA is providing a weekly average and I am estimating a daily value. So if the ONI is rising, the average will lag a daily reading and that is the case right now as this Kelvin Wave moves through the area where Nino 3.4 is measured. The NOAA estimate is impacted to some extent by some cooler water near 5S Latitude but I do not think that is a major factor.
The real story here however still remains Nino 4.0 where the ONI there is now reported by NOAA to be 1.3 which is consistent with an El Nino Modoki Type II. Nino 3.4 ONI is officially reported by NOAA as 0.9 which curiously is very similar to my estimate of Nino 3.4 last week from looking at the TRITON/TAO graphic. My estimate this week is 1.25 . Nino 1 and 2 are clearly in play and reported as 1.3 Something is clearly happening in the Equatorial Pacific. It started as a Traditional El Nino, changed to a Modoki-ish event that did not begin in the way that a Modoki usually begins, and now appears to be morphing into more of a Traditional El Nino. But in my opinion the pattern still most closely resembles a Modoki Type II. That pattern and my assessment of it might change but it does not appear that any of the SST forecasts show anything other than a Modoki Type II combined with PDO+.
Now this week’s weekly SST Departures and the trend graphs on the right.

The view of El Nino as a 2014/2015 event appears to be morphing into a view that it is a 2015/2016 event. But all predictions about El Nino for next winter must be tempered by what is called the Spring Prediction Barrier (SPB). Nevertheless, an El Nino this coming winter is a real possibility. It is due and many factors are in place that suggest it will happen. But it needs another Kelvin Wave to make it happen.
It is useful to understand where ENSO is measured.

Of most interest to NOAA is 120 W to 170 W labeled Nino 3.4 as that is where the ONI Index most often used in the U.S. for defining ENSO Events is measured. More information can be found here. In Asia they tend to pay more attention to Nino 3
And now the low-level wind anomalies.

This is not much change since last week but with one more week of data it is easier to see the pattern so I have included it. I believe the above graphic is current as of April 17,
The Southern Oscillation Index (SOI) this week has not been reported by Queensland, Australia since Wednesday. So I will update the information on Page II when it becomes available.
The Kelvin Wave graphic is very interesting this week. It is really the Upper Ocean Heat Anomaly.

We need to pay attention to the western side of the wave and there it does appear that we see a potential upwelling phase beginning in the far Western Pacific that intense blue patch. So far NOAA is turning a blind eye to this but eventually they will be forced to recognize it. You can measure with a ruler (or by looking at the latitude designations) the length of the Equator impacted by this Kelvin Wave and it is again less this week than last week. The future value of the Nino 3.4 Index which is measured between 120W and 170W will soon start to decline.
Here is a different view. It is not the Hovmoeller approach which is good at showing changes over time but this shows the situation from the surface down which is very important. To show changes in time, you need multiple snapshots and they are shown on the right but are kind of small and hard to read. I needed to zoom in to read them. Your eyes might be better than mine.
You can clearly see the beginnings of a potential upwelling wave here off to the left. You can clearly seee this Kelvin Wave playing out. BTW some of the color coding is illusionary. The Pacific is colder in the East than in the West so as a bolus of water of constant temperature moves to the East it records as a larger i.e. redder anomaly. The water that is moving is not getting warmer it is just more anomalous.
One can attempt in this graphic and in the above Hovmoeller to estimate the speed of transit of this Kelvin Wave. My rough estimate is that it is moving at about 20 degrees of longitude a month or perhaps slightly slower. So it may impact the Equator for another four months but show up in the Nino 3.4 calculation only for about two more months. This is mid April so this wave will play out by August. So this Kelvin Wave alone will not create an El Nino this winter. There needs to be yet another Kelvin Wave. When I look at the SST analysis of the Pacific, I am not sure that the Warm Pool has the necessary warm water to sustain this Warm Event. So I am still somewhat skeptical but recognize that essentially all the models are predicting an El Nino for this winter. It is important to remember that ENSO is a cycle which can be likened to a battery. It stores solar heat during the La Nina phase and it releases that heat to the atmosphere during the El Nino phase. So a Modoki which may not impact land masses in the same way as a Traditional El Nino, still releases heat to the atmosphere. So an El Nino Modoki is discharging the stored heat energy. Whether an El Nino Modoki can be followed by a Traditional El Nino of any strength thus becomes an open question. But since this Modoki was minimal at best, perhaps the Pacific Warm Pool still has enough stored heat to generate a true El Nino. I am skeptical of that.

And finally the latest model results. I decided the NOAA model provided no additional useful information this week so I am going with the Japanese Model even though the latest results are a month old.
Japanese Model Results their March 1, 2015 SINTEX-F model runs.

Like everyone else, their model is now showing that Nino 3.4 will exceed the level associated with El Nino this summer and going through this coming winter. The actual level is lower than many other models. And notice the wide spread of model run results.
April 17, 2015: Comments related to the model run from 1st March, 2015.
ENSO forecast: The SINTEX-F model prediction and present observations show that a weak El Niño condition is developing in the eastern Pacific from the prevailing El Niño Modoki condition.
Indian Ocean forecast: A basin-wide warming will continue to develop in the Indian Ocean in response to the tropical Pacific warm condition at least until the boreal [Editor’s Note: Northern Hemisphere sometimes abbreviated NH] spring . The model predicts the development of a positive Indian Ocean Dipole event in boreal summer and fall. However, uncertainty of its evolution remains high because of the large spread seen in the prediction plumes.
Regional forecast: In this boreal spring, as a seasonally averaged view, most parts of Africa, Northern Russia, India, Southeast Asia, Australia, South America, and Canada will experience a warmer-than-normal condition.
On the other hand, Europe, central/eastern U.S., and the Far East (including Japan) will experience a colder-than-normal condition.
The seasonally averaged rainfall forecast in this boreal spring shows that most parts of Southeast Asia, Australia, and Northern Brazil will experience a drier-than-normal condition. Based on monthly pictures (not shown), we predict less rain in Korea and Japan particularly in May and June. All those may be partly related to a persistence of the tropical Pacific warm condition.
A wetter-than-normal condition is predicted for the western U.S., through the boreal spring, perhaps partly due to a warmer-than-normal SST associated with the “California Niño”and associated ocean-atmosphere interactions and dynamics along the western coasts of North America.
Pulling it All Together.
We may or may not have an El Nino this Winter. We may or may not have a Pacific Climate Shift as the PDO+ may be simply related to the Warm Event. But for now we do have PDO+. The AMO being an overturning may be more predictable so the Neutral status moving towards AMO- is probably fairly reliable. So none of this is very difficult to figure out actually. The research on Ocean Cycles is fairly conclusive and widely available to those who seek it out. For various reasons, more people know about Global Warming than about Ocean Cycles which the IPCC refers to as “Internal Variability”. It is quite likely that more attention will be paid to Ocean Cycles given the likelihood that the changes in the phase of three ocean cycles will be having a significant impact on weather patterns in many parts of the World.
Click Here for the Econointersect Weather and Climate Page II where you will find:
- A more complete set of NOAA and other agency graphics (including international agencies) that auto update. So this includes both short term- and seasonal “updates”. Most of the graphics will ALWAYS be up to date even if my commentary on the graphics is not. I update my commentary when it seems necessary and certainly every Monday, but some of these graphics auto update every six hours.
- Economic and other Impacts of major weather events. Not sure there is any other place to obtain this information consistently other than very specialized subscription services.
- Information on Climate Cycles both those which are fairly short term i.e. less than a decade in duration and multi-decadal cycles.
- Economic and other Impacts of those Climate Cycles which are referred to by the IPCC as Internal Variability as opposed to secular Climate Change which is always in the same direction. Again I am not sure if there is another source for this information where it is pulled together in one place as I have.
Click Here for Page III which deals with Global Warming.
- Information on Anthropogenic Global Warming science i.e. the secular change in our climate that overlays both short-term weather and historical climate cycles as well as black swan events like volcanic eruptions. I prefer to call this Global Warming as it is the warming that triggers the other changes.
- Economic and other Impacts of Global Warming. The IPCC AR5 WG2 attempts to describe and quantify these and I have some excerpts from their report. Over time I will go beyond their report as it is very deficient.


