


Written by Steven Hansen
The non-seasonally adjusted S and P CoreLogic Case-Shiller home price index (20 cities) year-over-year rate of home price growth continues. The index authors stated, “The market’s strength continues to be broadly-based: 18 of the 19 cities for which we have December data rose, and 18 cities gained more in the 12 months ended in December than they had gained in the 12 months ended in November”.

Analyst Opinion of Case-Shiller HPI
Please note from the authors:
Please note that transaction records for October 2020 and November 2020 for Wayne County, MI, are now available. Due to delays at the local recording office caused by the COVID-19 pandemic, S&P DJI and CoreLogic were previously unable to generate valid October 2020 and November 2020 updates for the Detroit S&P CoreLogic Case-Shiller Indices. However, there are still an insufficient number of records from Wayne County for December 2020. Since Wayne County is the most populous county in the Detroit metro area, S&P DJI and CoreLogic are unable to generate a valid Detroit index value for December 2020. When the sale transactions data fully resumes, and sufficient data is collected, the Detroit index values for the month(s) with missing updates will be calculated.
All home price indices are now showing home price growth is continuing year-over-year. At this point, it looks like the pandemic has little affected home prices (or sales for that matter).
- 20 city unadjusted home price rate of growth accelerated by 0.9 % month-over-month. [Econintersect uses the change in year-over-year growth from month-to-month to calculate the change in the rate of growth]
- Note that the Case-Shiller index is an average of the last three months of data.
- The market expected from Econoday:
| Consensus Range | Consensus | Actual | |
| 20-city, SA – M/M | 0.7 % to 1.2 % | +0.9 % | +1.3 % |
| 20-city, NSA – M/M | 0.5 % to 0.8 % | +0.7 % | +0.8 % |
| 20-city, NSA – Yr/Yr | 8.6 % to 9.9 % | +9.0 % | +10.1 % |
S&P/Case-Shiller Home Price Indices Year-over-Year Change
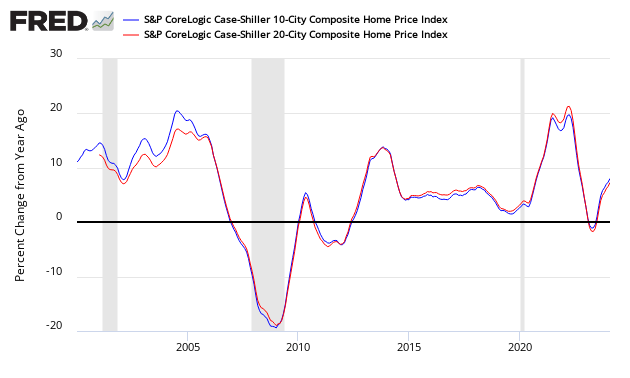
Comparing the NAR and Case-Shiller home price indices, it needs to be understood each of the indices uses a unique methodology in compiling their index – and no index is perfect.

The way to understand the dynamics of home prices is to watch the direction of the rate of change. Here home price growth is now accelerating.

There are some differences between the indices on the rate of “recovery” of home prices.
A synopsis of Authors of the Leading Indices:
Case Shiller’s Craig J. Lazzara, Managing Director and Global Head of Index Investment Strategy at S&P Dow Jones Indices stated:
“Home prices finished 2020 with double-digit gains, as the National Composite Index rose by 10.4% compared to year-ago levels,” says Craig J. Lazzara, Managing Director and Global Head of Index Investment Strategy at S&P DJI. “The trend of accelerating prices that began in June 2020 has now reached its seventh month and is also reflected in the 10- and 20-City Composites (up 9.8% and 10.1%, respectively). The market’s strength continues to be broadly-based: 18 of the 19 cities for which we have December data rose, and 18 cities gained more in the 12 months ended in December than they had gained in the 12 months ended in November.
“As COVID-related restrictions began to grip the economy in early 2020, their effect on housing prices was unclear. Price growth decelerated in May and June, and then began a steady climb upward, and December’s report continues that acceleration in an emphatic manner. 2020’s 10.4% gain marks the best performance of housing prices in a calendar year since 2013. From the perspective of more than 30 years of S&P CoreLogic Case-Shiller data, December’s year-over-year change ranks within the top decile of all reports.
“These data are consistent with the view that COVID has encouraged potential buyers to move from urban apartments to suburban homes. This may indicate a secular shift in housing demand, or may simply represent an acceleration of moves that would have taken place over the next several years anyway. Future data will be required to address that question.
“Phoenix’s 14.4% increase led all cities for the 19 th consecutive month, with Seattle (+13.6%) and San Diego (+13.0%) close behind. Prices were strongest in the West (+10.8%) and Southwest (+10.5%), but gains were impressive in every region.
CoreLogic believes home demand will remain firm moving forward (December 2020 Data). Per Dr. Frank Nothaft, chief economist at CoreLogic stated:
Two record lows are fueling home price gains: for-sale inventory and mortgage rates. Prospective sellers with flexible timetables have opted to delay listing their home until the pandemic fades or they are vaccinated. We can expect more inventory to come available in the second half of the year, leading to slowing in price growth toward year-end.reLogic. “Lower-priced home values increased about one and a half times faster than higher-priced home values in November, as first-time buyers tend to seek out homes within the lower price ranges.
At the start of the pandemic, many braced for a Great Recession-era collapse of the housing market. However, market conditions leading into the crisis — namely low home supply, desire for more space and millennial demand — amplified the rapid acceleration of home prices
From the National Association of Realtors (January 2021 data):
Home sales continue to ascend in the first month of the year, as buyers quickly snatched up virtually every new listing coming on the market. Sales easily could have been even 20% higher if there had been more inventory and more choices.
Home sales are continuing to play a part in propping up the economy. With additional stimulus likely to pass and several vaccines now available, the housing outlook looks solid for this year.
I expect more jobs to return, which will spur homebuying in the coming months. He predicts existing-home sales will reach at least 6.5 million in 2021, even as he says mortgage rates are likely to inch higher due to the rising budget deficit and higher inflation.
The U.S. Federal Housing Finance Agency produces an All-Transactions House Price Index for the United States:

Econintersect publishes knowledgeable views of the housing market.
Caveats on the Use of Home Price Indices
The housing price decline seen since 2005 varies by zip code – and seems to have ended somewhere around the beginning of the 2Q2012. Every area of the country has differing characteristics. Since January 2006, the housing declines in Charlotte and Denver are well less than 10%, while Las Vegas home prices had declined by almost 60%.
Each home price index uses a different methodology – and this creates slightly different answers.
The most broadly based index is the US Federal Housing Finance Agency’s House Price Index (HPI) – a quarterly broad measure of the movement of single-family house prices. This index is a weighted, repeat-sales index on the same properties in 363 metro centers, compared to the 20 cities Case-Shiller.
The US Federal Housing Finance Agency also has an index (HPIPONM226S) based on 6,000,000 same home sales – a much broader index than Case-Shiller. Also, there is a big difference between home prices and owner’s equity (OEHRENWBSHNO) which has been included in the graph below.
Comparing Various Home Price Indices to Owner’s Equity (blue line)


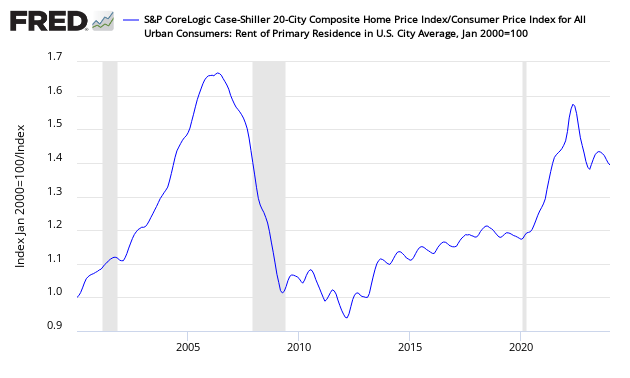
The affordability factor favors rental vs owning.
Price to Rent Ratio – Indexed on January 2000 – Based on Case-Shiller 20 cities index ratio to CPI Rent Index
include(“/home/aleta/public_html/files/ad_openx.htm”); ?>


