Written by Steven Hansen
The U.S. daily confirmed coronavirus cases decreased by half compared to yesterday. Deaths declined by 30% from yesterday. Following is a set of interactive graphs and tables for the world and individual states – as well as today’s headlines on coronavirus.

Today, the charts show clearly a declining trend line for both deaths and new cases. We have added a new graphic below showing a 3 day rolling average for new cases reported.
Coronavirus News You May Have Missed
Japanese economy sinks deeper in April as virus measures hit – IHS Markit
Pessimism among Japanese firms meanwhile intensified in April as the COVID-19 situation remained challenging. Business expectations for the year ahead fell sharply to the lowest since data for this survey variable were first available in 2012. Business confidence for both the manufacturing and the service sectors sank to the lowest in their respective survey histories. The virus crisis was the dominant concern cited by respondents.
The government has announced a massive stimulus package worth JPY117 trillion (about 20% of GDP), including cash handouts and loan support programmes, to combat the effects of the virus pandemic. While the emergency stimulus package is welcome by many – and the size of the plan unprecedented – it is unlikely to fully offset the damage caused by the COVID-19 outbreak, especially if the pandemic is prolonged. IHS Markit expects Japan’s economy to shrink by 3.3% in 2020.

The proximal origin of SARS-CoV-2 – naturemedicine
In the midst of the global COVID-19 public-health emergency, it is reasonable to wonder why the origins of the pandemic matter. Detailed understanding of how an animal virus jumped species boundaries to infect humans so productively will help in the prevention of future zoonotic events. For example, if SARS-CoV-2 pre-adapted in another animal species, then there is the risk of future re-emergence events. In contrast, if the adaptive process occurred in humans, then even if repeated zoonotic transfers occur, they are unlikely to take off without the same series of mutations. In addition, identifying the closest viral relatives of SARS-CoV-2 circulating in animals will greatly assist studies of viral function. Indeed, the availability of the RaTG13 bat sequence helped reveal key RBD mutations and the polybasic cleavage site.
The genomic features described here may explain in part the infectiousness and transmissibility of SARS-CoV-2 in humans. Although the evidence shows that SARS-CoV-2 is not a purposefully manipulated virus, it is currently impossible to prove or disprove the other theories of its origin described here. However, since we observed all notable SARS-CoV-2 features, including the optimized RBD and polybasic cleavage site, in related coronaviruses in nature, we do not believe that any type of laboratory-based scenario is plausible.
WHO warns that few have developed antibodies to Covid-19 – the guardian
Only a tiny proportion of the global population – maybe as few as 2% or 3% – appear to have antibodies in the blood showing they have been infected with Covid-19, according to the World Health Organization, a finding that bodes ill for hopes that herd immunity will ease the exit from lockdown.
“Easing restrictions is not the end of the epidemic in any country,” said WHO director-general Dr Tedros Adhanom Ghebreyesus at a media briefing in Geneva on Monday. “So-called lockdowns can help to take the heat out of a country’s epidemic.”
But serological testing to find out how large a proportion of the population have had the infection and developed antibodies to it – which it is hoped will mean they have some level of immunity – suggests that the numbers are low.
China to give millions more to the W.H.O. after the U.S. halts funding – New York Times
China said on Thursday that it would donate an additional $30 million to the World Health Organization after President Trump’s order this month to suspend American funding to the agency as he accused it of promoting “China’s misinformation” and “severely mismanaging” the spread of the coronavirus.
The new Chinese donation was announced on Twitter by Hua Chunying, a spokeswoman for the country’s Ministry of Foreign Affairs. “At this crucial moment, supporting W.H.O. is supporting Multilateralism and Global Solidarity,” she wrote.
That funding follows another donation of $20 million in March, Ms. Hua said. U.S. donations to the organization have historically outstripped China’s: Of the $5.6 billion that the agency received in 2018 and 2019, the United States contributed about $893 million and China gave $86 million.
Coronavirus: Why are international comparisons difficult? – BBC
“What you want to know is why one country might be doing better than another, and what you can learn from that,” says Prof Jason Oke from the University of Oxford.
“And testing seems to be the most obvious example so far.”
But until this outbreak is over it won’t be possible to know for sure which countries have dealt with the virus better.
“That’s when we can really learn the lessons for next time,” says Prof Oke.
Will empty middle seats help social distancing on planes? – BBC
Responsible social distancing in the age of Covid-19 means staying at least 2m (6ft) from other people. But that’s impossible on a modern plane, where seats are around 45cm (17-18 inches) wide, so leaving the middle seat free only keeps you 45cm from your neighbour, side to side. You’d need to be more than four seats apart to keep 2m away. In other words, about as far away as the two window seats in any row of six seats separated by a single aisle. (We’re ignoring, for simplicity’s sake, any travel by passengers or crew up and down the aisle.)
… Blocking out middle seats on a Boeing 737 or Airbus A320, which are usually in a 3-3 layout – and even some larger planes like a Boeing 787 or Airbus A350, which tend toward a 3-3-3 configuration – would mean a maximum load factor of 66.7%. That’s simply not enough to allow airlines to operate without making losses.
| U.S. Only | Global | U.S Percentage of Total | ||||
| Today | Cumulative | Today | Cumulative | Today | Cumulative | |
| New Cases | 17,588 | 842,629 | 67,629 | 2,590,000 | 26.0% | 32.5% |
| Deaths | 1,721 | 46,764 | 6,022 | 182,808 | 28.6% | 25.6% |
| Mortality Rate | 9.8% | 5.6% | 8.9% | 7.1% | ||
| total COVID-19 Tests per 1,000 people | 0.94 | 12.48 | ||||
Analyst Opinion of Coronavirus Data
There are several takeaways that need to be understood when viewing coronavirus statistical data:
- The global counts are suspect for a variety of reasons including political. Even the U.S. count has issues as it is possible that as much as half the population has had coronavirus and was asymptomatic. It would be a far better metric using a random sampling of the population weekly. In short, we do not understand the size of the error in the tracking numbers.
- Just because some of the methodology used in aggregating the data in the U.S. is flawed – as long as the flaw is uniformly applied – you establish a baseline. This is why it is dangerous to compare two countries as they likely use different methodologies to determine who has (and who died) from coronavirus.
- COVID-19 and the flu are different but can have similar symptoms. For sure, COVID-19 so far is much more deadly than the flu. [click here to compare symptoms]
- From an industrial engineering point of view, one can argue that it is best to flatten the curve only to the point that the health care system is barely able to cope. This solution only works if-and-only-if one can catch this coronavirus once and develops immunity. In the case of COVID-19, herd immunity may need to be in the 80% to 85% range. WHO warns that few have developed antibodies to COVID-19. At this point, herd immunity does not look like an option.
- Older population countries will have a higher death rate.
- Each publication uses different cutoff times for its coronavirus statistics. Our data uses 11:00 am London time. Also, there is an unexplained variation in the total numbers both globally and in the U.S.
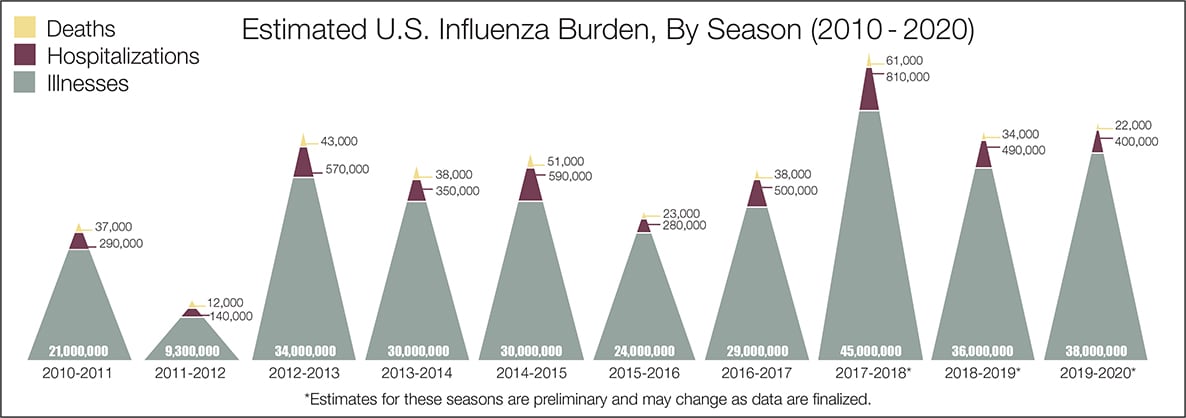
- The real question remains if the U.S. is over-reacting to this virus. The following graphic from the CDC puts the annual flu burden in perspective [click on image to enlarge].
What we do not know about the coronavirus [actually there is little scientifically proven information]. Most of our knowledge is anecdotal – not backed by scientific studies:
- Is social distancing at 6 feet correct? Some are saying 4 meters (13 feet). And what is the correct social distance if one rides a bike?
- Will warm weather and higher humidity slow the coronavirus spread? Will September see another spike in cases? Next Winter may see more cases than seen previously.
- Should we decontaminate products (such as food) that are brought into the house?
- Does one develop immunity after recovering from coronavirus?
- Is COVID-19 mutating? How will this impact the ability to create immunization or even immunity?
- Are ventilators damaging patients – should oxygen be used instead?
The bottom line is that COVID-19 so far has been shown to be much more deadly than the data on the flu. Using CDC data, the flu has a mortality rate between 0.06 % and 0.11 % Vs. the coronavirus which to date has a mortality rate of over 5 % – which makes it between 45 and 80 times more deadly. The reason for ranges:
Because influenza surveillance does not capture all cases of flu that occur in the U.S., CDC provides these estimated ranges to better reflect the larger burden of influenza.
Today’s Posts On Econintersect Concerning The Pandemic With Hyperlinks
April 2019 Kansas City Fed Manufacturing At Lowest Level In Series History
March 2020 Headline New Home Sales Hit By Coronavirus
What Face Masks Actually Do Against Coronavirus
18 April 2020 Initial Unemployment Claims 4,427,000 This Week
Infographic Of The Day: How COVID-19 Consumer Spending Is Impacting Industries
Documentary Of The Week: Investigation Into U.S. Response To COVID-19
Time For China And The WHO To Fess Up
What Future Do Airlines Have? Three Experts Discuss
ASEAN: The Coming Impact Of Coronavirus Contraction
U.S. Travel Industry Set To Lose Over $500 Billion In 2020
Coronavirus INTERACTIVE Charts
include($_SERVER[‘DOCUMENT_ROOT’].’/pages/coronavirus.htm’); ?>
include(“/home/aleta/public_html/files/ad_openx.htm”); ?>


