
Written by Steven Hansen
Like the rest of you, I am trying to get my arms around the impact of the coronavirus (COVID-19) on the U.S. The problem in trying to do any analysis is that there is a serious shortage of information and data necessary to do anything meaningful. This is why the media is full of opinion and conjecture – including reams of conflicting information.

Please share this article – Go to the very top of the page, right-hand side, for social media icons
Based on the transport data I receive, it seems that the Chinese are ramping industrial production back up. It begs the question of whether the coronavirus pandemic has been brought under control. If the pandemic is not under control, I would assume China will be forced to return to quarantine measures with industry shut down again. However, even that is uncertain because of the possibility of “community spread” with the virus.
The coronavirus has caused massive disruption in shipping as most goods and components to the U.S. are transported in sea containers. These reusable containers are in the wrong places to support a quick and vigorous recovery. My best guess is that it will take at least two weeks just to sort out logistics equipment to begin to support the shipping of Chinese goods. And the backlog will require more containers to catch up – it will exasperate the container shortage.
There are actually two parts to the coronavirus question – 1) what percentage of U.S. products contain Chinese made components that can only be sourced from China, and 2) will the coronavirus become a pandemic in the U.S.
Based on my research, I cannot find any trustable data to quantify what percentage of U.S. products contain Chinese made components. And in this past week, Dr. Nancy Messonnier, director of the National Center for Immunization and Respiratory Diseases, said in a news briefing this week:
It’s not so much of a question of if this will happen [coronavirus (COVID-19)] anymore but rather more of a question of exactly when this will happen.
… cities and towns should plan for “social distancing measures,” like dividing school classes into smaller groups of students or closing schools altogether. Meetings and conferences may have to be canceled, she said. Businesses should arrange for employees to work from home.
We are asking the American public to work with us to prepare, in the expectation that this could be bad.
So at this point, the great minds are saying the coronavirus outbreak is likely to be a factor affecting the U.S. directly. Already there are issues internally in the U.S. with logistics – with a shortage of ships and containers for exports in some places.
Transport related impacts due to coronavirus this week:
- The vulnerability of the container shipping supply chain has been repeatedly — and painfully — exposed, but as 2020 gets underway, the industry is facing disruption on a scale not seen in its more than 60-year history as a result of the coronavirus (COVID-19) outbreak in China.
- Attention is shifting from mitigating the effects of China’s dramatic measures to limit the spread of the coronavirus to how to recover from its impact on the supply chain. The response to virus-tackling measures has been heavily reflected in carrier capacity planning for the next two months, with Sea-Intelligence Maritime Consulting estimating in its Sunday Spotlight newsletter that 296,500 TEU in capacity cuts have been made on the Asia-North America West Coast trade, 82,000 TEU on Asia-North America East Coast, 322,000 TEU on Asia-North Europe, and 127,000 TEU on Asia-Mediterranean from early February through the first week of April.
- The Chinese government says it will take “strong measures” to ensure supply chain fluidity for refrigerated (reefer) food products, but US exporters must wait for factories to reopen and ships to begin leaving China again.
- Ports in the southeast US anticipate a double-digit decline in cargo volumes in March and April due to the coronavirus.
- As travel restrictions within China get lifted, workers are returning to the country’s container ports. That means the ports can start tackling backlogs caused by the shutdown.
Economic Forecast
The Econintersect Economic Index (March 2020) forecast improved this month and returned (just barely) to expansion. The current reading is predicting little economic growth. The ongoing weakness of manufacturing, transport, and imports continues to weigh on our economic forecast – and a further uncalculable headwind on the economy looms with the coronavirus (COVID-19) which is disrupting the international supply chain.
Although our index is now in negative territory similar to 2016, this penetration into negative territory is not yet severe or persistent – and our opinion is that our index is not suggesting an economic contraction at this point. But any continuing decline might be enough to suggest it is possible a recession is coming.
Our employment forecast is continuing to forecast POORER employment growth than in the first half of 2019 but is showing improvement 6 months from today.

Economic Releases This Past Week
The following table summarizes the more significant economic releases this past week. For more detailed analysis – please visit our landing page which provides links to our complete analyses.
Overall this week:
New Home sales remains strong
Manufacturing surveys significantly improved – will this translate to better industrial production numbers?
Durable goods continues to weaken
Transport continues weak and remains in contraction but there was evidence this month of improvement
Consumer spending relatively weak but consumer sentiment relatively high
| Release | Potential Economic Impact | Comment |
|---|---|---|
| January Chicago Fed National Activity Index | improvement trend in play | The economy’s rate of growth improved based on the Chicago Fed National Activity Index (CFNAI) 3 month moving (3MA) average – but the economy continues below the historical trend rate of growth. The three-month moving average of the Chicago Fed National Activity Index (CFNAI) changed from -0.23 (originally reported as -0.23 last month) to -0.09.
|
| December Case-Shiller Home Prices | home prices continue to increase | The non-seasonally adjusted S & P CoreLogic Case-Shiller home price index (20 cities) year-over-year rate of home price growth improved from 2.6 % to 2.9 %. The index authors stated, “At the national level, home prices are 59% above the trough reached in February 2012, and 15% above their pre-financial crisis peak”.
|
| February Chemical Activity Barometer | this index returned to expansion | The Chemical Activity Barometer (CAB) rose 0.4 percent in February on a three-month moving average (3MMA) basis following a 0.7 percent gain in January. On a year-over-year (Y/Y) basis, the barometer increased 2.0 percent. The unadjusted February data showed a 0.4 percent decline following a 1.5 percent increase in January and a 0.3 percent gain in December. The diffusion index rose to 68 percent in February. The diffusion index marks the number of positive contributors relative to the total number of indicators monitored. The CAB reading for January was revised upward by 0.44 points and that for December was revised downward by 0.26 points.
|
| January New Home Sales | sales seemed a little softer this month but still better than any year since 2007 | The headlines say new home sales grew month-over-month – but the three-month rolling average growth declined. This month the backward revisions were slight. Because of weather and other factors, the rolling averages are the way to view this series. The rolling averages declined.
|
| January Durable Goods | the trend continues to be downward | The headlines say the durable goods new orders decreased. Our analysis shows the rolling averages significantly declined and this sector remains in contraction. In the adjusted data, the weakness was communications equipment, motor vehicles, defense goods & aircraft – but civilian aircraft (and most non-transport sectors) were strong. This series has wide swings monthly so our primary metric is the unadjusted three-month rolling average – which insignificantly declined and remains in contraction. The rate of growth of the rolling averages is below the values seen over the last year.
|
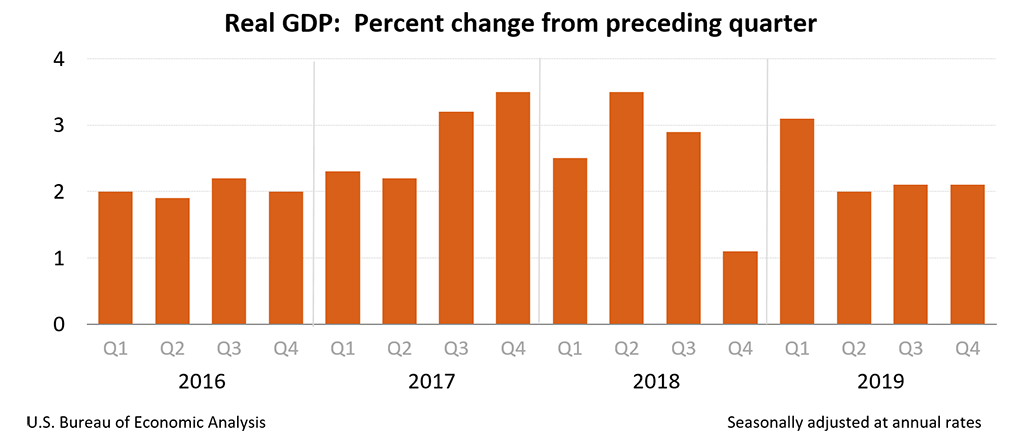
| 4Q2019 GDP | no significant change from the advanced estimate | The second estimate of fourth-quarter 2019 Real Gross Domestic Product (GDP) was unchanged from the advance estimate’s +2.1 %. There was little change from the advance estimate. Relative to the previous quarter, consumer spending rate of growth almost dropped by half – but this was counterbalanced by a significant improvement in the trade balance. Fixed investment remains weak, and inventories declined. However, it was the decline in the price index which was a major factor in not have GDP decline this quarter. I am not a fan of quarter-over-quarter exaggerated method of measuring GDP – but my year-over-year preferred method showed a moderate acceleration from last quarter.
|
| January Pending Home Sales | improvement trend remains in play | The National Association of Realtors (NAR) seasonally adjusted pending home sales index rebounded after a decline last month. Our analysis shows the year-over-year rate of growth was unchanged. The quote of the day from this NAR release:
|
| January Pending Home Sales | trucking continues to contract | Headline data for the American Trucking Association (ATA) and the CASS Freight Index continue to provide opposing statistics. The CASS index is inclusive of rail, truck, and air shipments. The ATA truck index is inclusive of only trucking industry member movements (ATA’s tonnage data is dominated by contract freight). Even so, CASS breaks out trucking and claims it is down 6.3 % year-over-year and down 3.6 % month-over-month. I put a heavier weight on the CASS index which is consistent with rail and ocean freight. It is not logical that truck freight goes up when industrial production and ocean freight decline – not to mention the continuing effects of the trade war and the coronavirus. The graph below is provided by CASS.
|
| January Personal Income and Outlays | consumption remains weak | This month there was a significant increase in the year-over-year growth rate for income, but expenditures’ growth was little changed. The savings growth rate was little changed and has remained in a narrow band for the last year. Real Disposable Personal Income is up 2.2 % year-over-year, and real consumption expenditures are up 2.7 % year-over-year.
|
| Surveys | manufacturing surveys significantly improved | Dallas Fed Manufacturing – This index significantly improved. Important subindices new orders significantly declined (and is in expansion) and unfilled orders improved and now is in contraction. This should be considered a better report relative to last month.
Richmond Fed Manufacturing – This index is now in contraction. The important Richmond Fed subcategories (new orders and unfilled orders) significantly declined and are now in contraction. This survey was significantly worse than last month.
Kansas City Fed Manufacturing – Kansas City Fed manufacturing has been one of the more stable districts and their index even though below the range seen in the last 12 months. Note that the key internals were mixed. This should be considered better than last month.
Chicago PMI Manufacturing – The Chicago Business Barometer edged up 6.1 points in February to 49.0, the highest level since August 2019. This survey remains in contraction.
Conference Board Consumer Confidence – The latest Conference Board Consumer Confidence Index’s headline number improved slightly in February, following an increase in January. The Index now stands at 130.7 (1985=100), up from 130.4 in January. The bottom line is that consumer confidence is relatively strong.
Michigan Consumer Sentiment – The final University of Michigan Consumer Sentiment for February came in at 101.0 – up from the preliminary of 100.9, up from January’s 99.8 and up from December’s 99.3.
|
| Weekly Rail Transport | positive news? | Rail, beginning early in 2019, has changed from a reflection of a strong economic engine to contraction. In the second week of 2020, after one year in contraction – total rail traffic moved into positive territory. However, since then total rail traffic moved back into contraction year-over-year. The rolling averages of the intuitive carload sectors this week remained in contraction but just barely.
|


Links To All Of Our Analysis This Past Week
include(“/home/aleta/public_html/files/ad_openx.htm”); ?>


