
Written by Steven Hansen
The 737 MAX was grounded in March 2019, and it continues to affect durable good sales. But even before the grounding of the 737 MAX, durable goods growth has been normally below the rate of inflation growth since the Great Recession.

Please share this article – Go to the very top of the page, right-hand side, for social media icons
Durable Goods sector is the portion of the economy that provides products that have a utility over long periods of time before needing repurchases – like cars, refrigerators, and planes.
In the graph below:
- the blue line is total durable goods new orders
- the red line is total durable goods new orders less defense new orders
- the green line is total durable goods less transport industries new orders (and adding back the defense aircraft which is included in the defense totals shown as the red line)
One can see on the graph below that defense new orders (which is the area between the blue and red lines) does not have a major impact on the bottom line of durable goods growth. Transport (the area between the blue and green lines), on the other hand, is more volatile.

The above graph is saying:
- if one ignores transport, durable goods new orders have grown little since 2007
- total durable goods new orders have grown little since the beginning of the Great Recession
Consider the graph above has not been adjusted for inflation. The red line on the graph below is the indexed rate of inflation whilst the blue line is the indexed rate of growth for durable goods new orders.

In the above graph, whenever the blue line is below the red line, it means that in REAL inflation-adjusted terms durable goods new orders are contracting.
Durable goods currently are a drag on economic growth.
Economic Forecast
The Econintersect Economic Index (February 2020) forecast marginally improved this month but still shows the lowest level of growth since the economic slowdown in 2016. The current reading still remains marginally below the 2016 minimum. The ongoing weakness of manufacturing, transport, and imports continues to weigh on our economic forecast – but what is changing is the trend direction which is showing a leveling off or possible improvement.
Although our index is now in negative territory similar to 2016, this penetration into negative territory is not yet severe or persistent – and our opinion is that our index is not suggesting an economic contraction at this point. But any continuing decline might be enough to suggest it is possible a recession is coming.
Our employment forecast is continuing to forecast POORER employment growth than in the first half of 2019.

Economic Releases This Past Week
The following table summarizes the more significant economic releases this past week. For more detailed analysis – please visit our landing page which provides links to our complete analyses.
Overall this week:
Coincident indicators are showing a soft but improving economy
Manufacturing surveys continue to show weak growth but are improving
December home sales continue to show improving trend even though sales slowed this month
Home prices continue to improve but a shortage of homes for sale is slowing existing home sales rate of growth
Transport continues weak and in contraction
Consumer sentiment near historic peak
| Release | Potential Economic Impact | Comment |
|---|---|---|
| December New Home Sales | strong new home sales continue | The headlines say new home sales slowed month-over-month – but the three-month rolling average growth improved. This month the backward revisions were downward. Because of weather and other factors, the rolling averages are the way to view this series. The rolling averages grew. Growth in 2019 still exceeds every year since 2007.
|
| December Durable Goods | n/a | The headlines say the durable goods new orders improved. Our analysis shows the rolling averages insignificantly improved but this sector remains in contraction. In the adjusted data, the strength was defense – but generally, everything else was weak especially civilian aircraft due to Boeing and the 737-Max fiasco. This series has wide swings monthly so our primary metric is the unadjusted three-month rolling average – which insignificantly improved but remains in contraction. The rate of growth of the rolling averages is below the values seen over the last year. Note that inflation-adjusted new orders year-over-year are deep in contraction.
|
| November Case-Shiller | n/a | The non-seasonally adjusted S & P CoreLogic Case-Shiller home price index (20 cities) year-over-year rate of home price growth improved from 2.2 % to 2.6 %. The index authors stated, “As was the case last month, after a long period of decelerating price increases, the National, 10-city, and 20-city Composites all rose at a modestly faster rate in November than they had done in October”. All home price indices are now showing home price growth is accelerating year-over-year. S&P/Case-Shiller Home Price Indices Year-over-Year Change
|
| December Pending Home Sales | n/a | The National Association of Realtors (NAR) seasonally adjusted pending home sales index fell. Our analysis shows the year-over-year rate of growth was unchanged. The quote of the day from this NAR release:
The year-over-year growth is in positive territory. The data is very noisy and must be averaged to make sense of the situation. Shorter-term trends are now improving.
|
| FOMC Meeting Statement | indicates consumer spending weakened | The Federal Open Market Committee (FOMC) – the board of directors of the Federal Reserve maintained the federal funds rate at 1‑1/2 to 1-3/4 as expected, and stated:
Overall the Fed appears to believe the economy is little changed since the last meeting, although they are saying consumer spending weakened. |
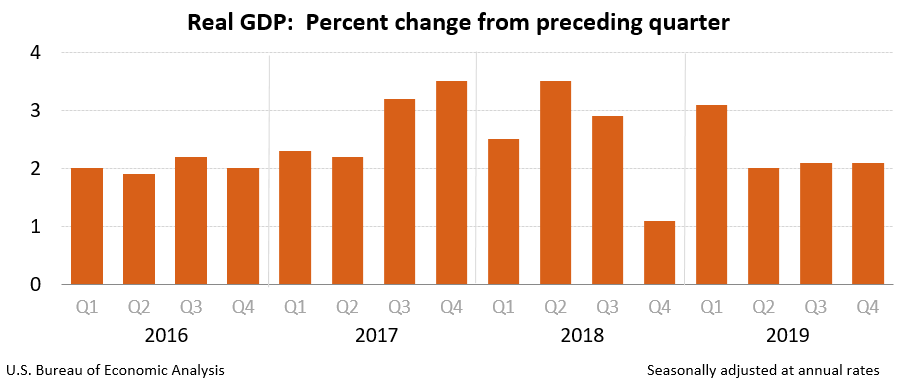
| 4Q2019 GDP | same rate of economic growth from last quarter? | The advance estimate for fourth-quarter 2019 Real Gross Domestic Product (GDP) is a positive 2.1 %. This growth is the same as the previous quarter’s 2.1 % if one looks at quarter-over-quarter headline growth. The year-over-year rate of growth improved. Consumer spending rate of growth almost dropped by half – but this was counterbalanced by a significant improvement in the trade balance. Fixed investment remains weak, and inventories declined. However, it was the decline in the price index which was a major factor in not have GDP decline this quarter. Headline GDP is calculated by annualizing one quarter’s data against the previous quarter’s data. A better method would be to look at growth compared to the same quarter one year ago. For 4Q2019, the year-over-year growth is now 2.3 % – up from 3Q2019’s 2.1 % year-over-year. So one might say that the rate of GDP growth accelerated by 0.2 % from the previous quarter.
|
| December Coincident Indicators | generally shows improving growth | The year-over-year rate of growth of various coincident indices was generally better relative to last month – but in most cases, the rate of growth is below average. Generally, the coincident indices are showing modest growth. Econintersect‘s analysis of the coincident indices is that:
|
| December Personal Income and Outlays | spending and income growth slowed | This month there was a significant decline in the year-over-year growth rate for income, but expenditures’ growth was little changed. This month consumer income growth year-over-year is growing slower than the spending growth year-over-year. This marks a significant deceleration of income trends. The savings growth rate was little changed and has remained in a narrow band in 2019.
|
| Surveys | manufacturing surveys remain weak but generally improved – consumer sentiment near historic peak | Dallas Fed Manufacturing – Important subindices new orders significantly improved (and is in expansion) and unfilled orders improving and but remaining in contraction. This should be considered a better report relative to last month. The expectations from Econoday were -9.9 to -1.0 (consensus -3.1) for the general activity index and the reported value was 10.5.
Conference Board Consumer Confidence – The latest Conference Board Consumer Confidence Index’s headline number increased in January, following a slight decrease in November. The Index now stands at 131.6 (1985=100), up from 128.2 (an upward revision) in December. Consumer confidence had been on a multi-year upswing, the upswing paused in 2019 – but currently is again in an upswing. Bottom line is that consumer confidence is relatively strong.
Richmond Fed Manufacturing – The important Richmond Fed subcategories (new orders and unfilled orders) significantly improved and are now in expansion. This survey was significantly better than last month.
Chicago PMI – The Chicago Business Barometer slipped to 42.9 in January, the lowest level since December 2015. After two straight months of gains, the index fell further into contraction, with the three-month average falling to 45.9. The Fed manufacturing surveys generally improve this month but still showing little growth – and the Chicago Fed went the other direction.
Michigan Consumer Sentiment – The final University of Michigan Consumer Sentiment for January came in at 99.8 – up from the preliminary of 99.1 and slightly down from December’s of 99.3.
|
| Weekly Rail Transport | Definitely not positive news | Rail, beginning early in 2019, has changed from a reflection of a strong economic engine to contraction. Currently, not only are the economic intuitive components of rail in contraction, but the 52 week rolling average is in contraction.
|


Links To All Of Our Analysis This Past Week
include(“/home/aleta/public_html/files/ad_openx.htm”); ?>


