Written by Steven Hansen
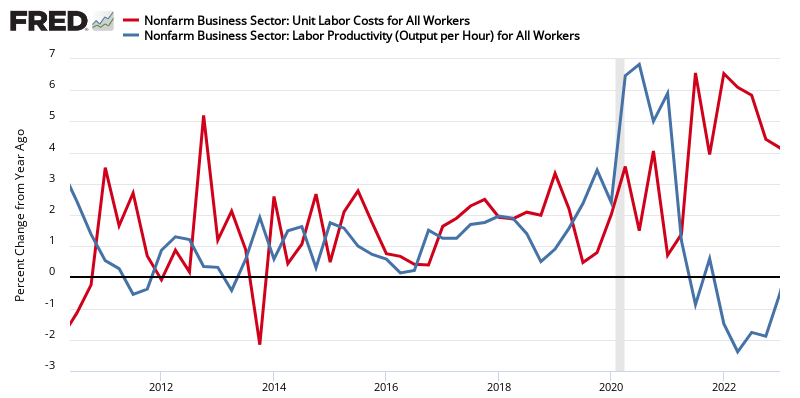
 A simple summary of the headlines for this release is that labor costs are growing significantly faster than productivity.
Analyst Opinion of Productivity and Costs
The overall view this quarter is that productivity is up 1.5 % from the same quarter one year ago (last quarter productivity was up 2.5 %), while unit costs are up 2.2 % (last quarter labor costs were up a revised 0.1%).
Note the following from the BLS:
Manufacturing sector labor productivity increased 0.1 percent in the third quarter of 2019, as output increased 1.3 percent and hours worked increased 1.2 percent. Total manufacturing sector productivity declined 0.1 percent over the last four quarters, as output decreased 0.5 percent and hours worked decreased 0.4 percent. (See tables A1 and 3.) Productivity increased 0.7 percent in the durable manufacturing sector in the third quarter of 2019, reflecting a 1.8-percent increase in output and a 1.0- percent increase in hours worked. Productivity decreased 0.8 percent in the nondurable manufacturing sector as output increased 0.8 percent and hours worked increased 1.6 percent. Unit labor costs in the total manufacturing sector increased 3.0 percent in the third quarter of 2019, and increased 4.4 percent from the same quarter a year ago.
The market was expecting from Econoday:
| seasonally adjusted quarter-over-quarter at an annual rate | Consensus Range | Consensus | Preliminary Actual | Final Actual |
| Nonfarm productivity | -0.3 % to +0.3 % | -0.2 % | -0.3 % | +0.2 % |
| Unit labor costs | +2.9 % to +3.6 % | +3.5 % | +3.6 % | +2.5 % |
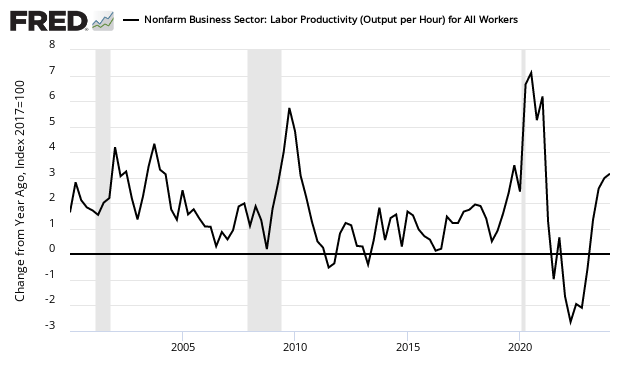
Annualized snippets of monthly or quarterly data distort what is going on. In reality, productivity growth is near post-Great Recession highs using a year-over-year analysis.

Please note that the following graphs are for a sub-group of the report nonfarm > business.
Seasonally Adjusted Year-over-Year Change in Output of Business Sector

Seasonally Adjusted Year-over-Year Change of Output per Hour for the Business Sector
All this is happening while business sector unit labor costs are growing.
Seasonally Adjusted Year-over-Year Rate of Change of Unit Labor Costs
The headlines from the press release:
Nonfarm business sector labor productivity decreased 0.2 percent in the third quarter of 2019, the U.S. Bureau of Labor Statistics reported today, as output increased 2.3 percent and hours worked increased 2.5 percent. (All quarterly percent changes in this release are seasonally adjusted annual rates.) From the third quarter of 2018 to the third quarter of 2019, productivity increased 1.5 percent, reflecting a 2.3-percent increase in output and a 0.9-percent increase in hours worked.
Preliminary Chart for 3Q2019

Final Chart for 3Q2019

My view of Productivity
My view of productivity is very different from the headline view. Productivity calculations are complicated – far too complicated for economists to come to a conclusion satisfactory to this simple Industrial Engineer:
Generally speaking, productivity is, in industrial engineering, defined as the relation of output (i.e. produced goods) to input (i.e. consumed resources) in the manufacturing transformation process.
Productivity assessments, even within a single company, are very complicated. When one goes beyond the individual company, they are impossible to accurately forecast when discussing an entire sector or economy. Industrial engineers do not use costs as a component to determine productivity. Industrial Engineers count processes and manhours – and are able to isolate improvements as elements change. So to generalize about sectors, economists have to make too many assumptions which not only make the calculations inaccurate – but their productivity conclusions jump around like a Mexican Jumping Bean.
Productivity, according to the BLS methodology, is calculated by dividing an index of real output by an index of hours worked by all persons. The hours worked come from the BLS Current Employment Statistics (CES) but the basis for “real output” comes from GDP. Per the BLS:
Business sector output is a chain-type, current-weighted index constructed after excluding from gross domestic product (GDP) the following outputs: general government, nonprofit institutions, and private households (including owner-occupied housing).
Those that follow my work know my disdain for how productivity is calculated by economists. The problem is that there is no way to do a realistic productivity analysis for the entire economy which would be accurate enough to be acceptable to an industrial engineer. The current methodology uses a monetary approach:
- profit/loss and overhead has no place in a productivity analysis yet it approaches impossible to remove
- adjusts for inflation but it would only take a small error in determining the inflation rate to significantly skew the calculation
- it is impossible to measure productivity change for a startup or a new business
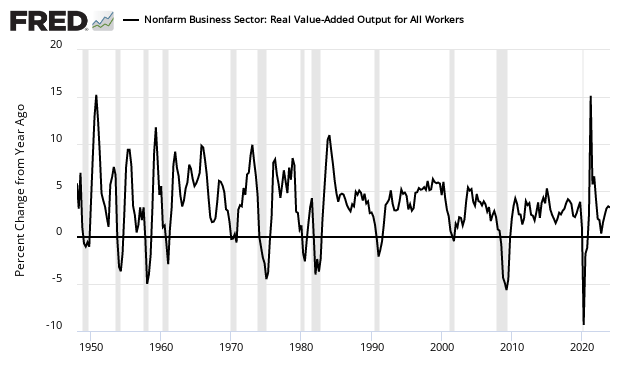
A rough and dirty calculation using monetary data available – the “decline” of productivity can be confirmed if one looked at GDP growth per employee after removing government transfer payments from GDP. (see red line in the graph below):

The red line in the above graph suggests there is an overall productivity growth decline. For this to be true suggests:
- too many employees have been employed for the tasks at hand; and/or
- companies and employees have decided not to use some of their existing labor-saving tools; and/or
- a natural disaster occurred; and/or
- companies have decided not to embrace any new labor-saving technologies and/or
- more people are employed in activities not producing output measured by GDP.
Slowing growth for productivity seems to defy logic in times of economic expansion.
A Better View Of Productivity
There are some rough tools that will get one into the ballpark of productivity improvement. These are monetary-based views, and likely are correct only in trends (but not in calculating an exact productivity change).
The following graphs on manufacturing, investment, retail trade, and health care are comparing inflation-adjusted growth of that sector to employment growth in that sector – as well as for the economy overall.
Economy Overall
In the case of the economy overall, for the last two years – it appears output (blue line) is now growing faster than employment.

The problem with this analysis is that it is a gross generalization – but it does estimate that we are looking for a positive productivity increase in the last year.
Manufacturing
In the case of manufacturing, output (blue line) is now growing slower than employment.
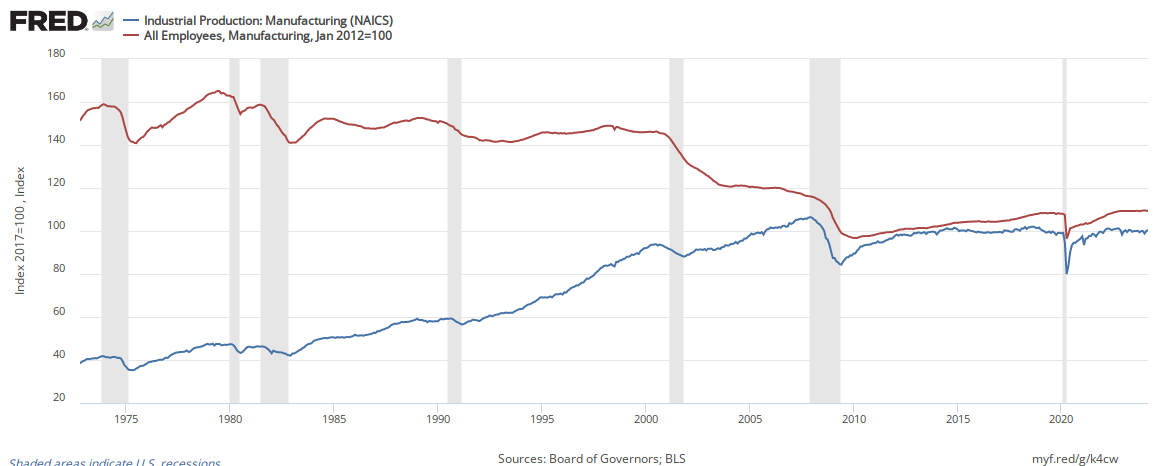
It should come as no surprise that manufacturing’s productivity is contracting.
Construction
Since 2012, construction output and employment are also growing at nearly the same rate implying there is little productivity growth.

Services
The only significant productivity growth I can find is in the services sector.
Beginning with the retail sector, the obvious gain in productivity is seen throughout the graph below and continues today.

There also is an improvement in the health care sector.

Overall Conclusion On Productivity
If you want to be entertained with a diatribe on productivity – Yves Smith carved up this subject well looking at it from an entirely different angle. In economics and life, a little knowledge [on a subject] is a dangerous thing.
This proverb ‘A Little Knowledge Is A Dangerous Thing’ means a person is sharing his views with others and doesn’t have enough knowledge of a particular subject, especially medical, religion, or education field, it can lead to dangerous situations. People with limited experience can often mislead people. Innocent people or people with a lack of information may easily believe the person pretending to know everything because most of the time, they are very convincing. A person with a little information and knowledge can also become a cause of suffering and even death due to their overconfidence.
The problem really is that economists seem to only understand money flows – and they use money to measure productivity. Productivity is an extremely nuanced calculation which is never totally accurate as there are shifting technology and/or methods. The core of industrial engineering productivity is a measure of labor hours for a specific task Vs. the output of those labor hours – and that detailed data is not available to anyone outside of a company.
The economist’s methodology of measuring productivity overstates productivity when outsourcing is increasing and understates productivity when outsourced production is returned.
Caveats Relating to Productivity
Productivity is determined using monetary criteria and does not recognize outsourced man-hours – in other words, if a business cuts half of its workforce by outsourcing a sub-component or sub-service, this would be a 50% productivity improvement.
These productivity measures describe the relationship between real output and the labor time involved in its production. They show the changes from period to period in the amount of goods and services produced per hour. Although these measures relate output to hours at work of all persons engaged in a sector, they do not measure the specific contribution of labor, capital, or any other factor of production. Rather, they reflect the joint effects of many influences, including changes in technology; capital investment; level of output; utilization of capacity, energy, and materials; the organization of production; managerial skill; and the characteristics and effort of the work force.
Econintersect believes a better measure (if you must use monetary tools to track productivity) would be competitiveness.
Looking at productivity/output long term – output fall below 0% year-over-year change is a good sign that a recession is underway. Another way to look at it – if productivity rate of gain is falling, this could be an indicator a recession is coming.
include(“/home/aleta/public_html/files/ad_openx.htm”); ?>


