Written by Steven Hansen
This week the Bureau of Labor Statistics (BLS) said that productivity in the third quarter in the U.S. declined 0.3% (percent change from the previous quarter at an annual rate and from the same quarter a year ago).

Please share this article – Go to the very top of the page, right-hand side, for social media icons
Annualized snippets of monthly or quarterly data distort what is going on. In reality, productivity growth is near post-Great Recession highs using a year-over-year analysis.

Productivity, according to the BLS methodology, is calculated by dividing an index of real output by an index of hours worked by all persons. The hours worked come from the BLS Current Employment Statistics (CES) but the basis for “real output” comes from GDP. Per the BLS:
Business sector output is a chain-type, current-weighted index constructed after excluding from gross domestic product (GDP) the following outputs: general government, nonprofit institutions, and private households (including owner-occupied housing).
Those that follow my work know my disdain for how productivity is calculated by economists. The problem is that there is no way to do a realistic productivity analysis for the entire economy which would be accurate enough to be acceptable to an industrial engineer. The current methodology uses a monetary approach:
- profit/loss and overhead has no place in a productivity analysis yet it approaches impossible to remove
- adjusts for inflation but it would only take a small error in determining the inflation rate to significantly skew the calculation
- it is impossible to measure productivity change for a startup or a new business
A rough and dirty calculation using monetary data available – the “decline” of productivity can be confirmed if one looked at GDP growth per employee after removing government transfer payments from GDP. (see red line in the graph below):

The red line in the above graph suggests there is an overall productivity growth decline. For this to be true suggests:
- too many employees have been employed for the tasks at hand; and/or
- companies and employees have decided not to use some of their existing labor-saving tools; and/or
- a natural disaster occurred; and/or
- companies have decided not to embrace any new labor-saving technologies and/or
- more people are employed in activities not producing output measured by GDP.
A slowing growth of productivity seems to defy logic in times of economic expansion.
Economic Forecast
The Econintersect Economic Index (November 2019) forecast fell marginally again this month and continues to show the lowest level of growth since the economic slowdown in 2016. The continuing weakness of manufacturing, transport, and exports/imports continues to weigh on our economic forecast.
The fundamentals which lead job growth are now showing a significant slowing growth trend in the employment growth dynamics. We are currently predicting the jobs growth to be below the growth needed to maintain participation rates and the employment-population ratios at the current levels.

Economic Releases This Past Week
The following table summarizes the more significant economic releases this past week. For more detailed analysis – please visit our landing page which provides links to our complete analyses.
Overall this week:
manufacturing remains in contraction
trade growth remains weak
transport weak and in contraction
leading indicators continue to forecast weak growth
inflation-adjusted wholesale trade remains in contraction
| Release | Potential Economic Impact | Comment |
|---|---|---|
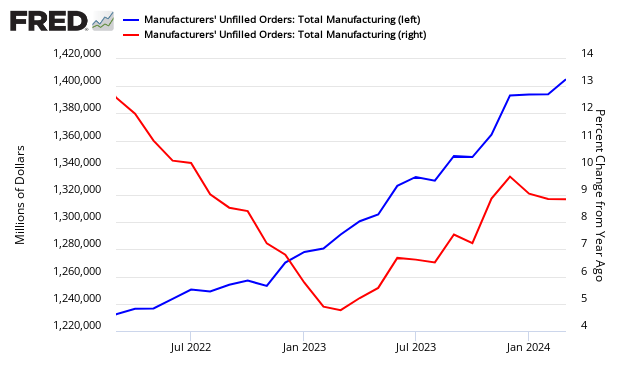
| September Factory Orders | in contraction and backlog declining | US Census says manufacturing new orders declined month-over-month. Our analysis shows the rolling averages declined, and the rolling average growth is in contraction year-over-year. According to the seasonally adjusted data, it was ships & boats and civilian aircraft that caused the decline in the headline data. The data in this series is noisy so I would rely on the unadjusted 3 month rolling averages which declined and remains in contraction. What should be concerning is the continual reduction of backlog/unfilled orders this year. Unadjusted Unfilled Orders – Total Current Value (blue line, left axis) and Year-over-Year Change (red line, right axis)
|
| October Conference Board Employment | weak growth forecast | The Conference Board’s Employment Trends Index – which forecasts employment for the next 6 months declined with the author’s saying “Leading indicators of employment are sending a slightly gloomier message than Friday’s stronger-than-expected jobs report“. Econintersect evaluates the year-over-year change of this index (which is different than the headline view) – as we do with our own employment index. The year-over-year index growth rate decelerated by 1.0 % month-over-month and down by 0.4 % year-over-year. The Econintersect employment index increased. Both of these indices are predicting soft job growth 6 months from now with the Conference Board’s index rate of growth relatively unchanged with the Econintersect index showing improving growth.
|
September Trade | Trade is not growing year-over-year | Trade data headlines show the trade balance improved – and imports declined whilst exports grew. The data in this series wobbles and the 3-month rolling averages are the best way to look at this series. The 3-month average rate of growth grew for exports and imports. Note that the headline numbers are not inflation-adjusted. Taking a step back and looking at inflation-adjusted data, there is very little change in growth year-over-year.
|
| September CoreLogic Home Price Index | predicts home price growth to increase | CoreLogic’s Home Price Index (HPI) shows home prices rose both year-over-year and month-over-month. Home prices increased nationally by 3.5% from September 2018. On a month-over-month basis, prices increased by 0.4% in September 2019.
|
| September JOLTS | predicts continued slow job growth | The BLS Job Openings and Labor Turnover Survey (JOLTS) can be used as a predictor of future job growth, and the predictive elements show that the year-over-year growth rate of unadjusted private non-farm job openings declined further and are in contraction year-over-year. The unadjusted data this month remained well below average for the rate of growth seen in the last year. With this low average rate of growth, JOLTS is predicting lower employment growth than we have seen over the past year. Jolts predicted the slowing of employment growth.
|
| 3Q2019 Preliminary Productivity and Costs | productivity declined | A simple summary of the headlines for this release is that labor costs are growing significantly faster than productivity. The overall view this quarter is that productivity is up 1.4 % from the same quarter one year ago (last quarter productivity was up a revised 2.3 %), while unit costs are up 3.1 % (last quarter labor costs were up a revised 2.6 %).
|
| Leading Indicator Review | slow growth forecast | At this point, Econintersect continues to see NO particular dynamic at this time which will deliver noticeably better growth in the foreseeable future – and no indicator is forecasting a recession over the next six months.
|
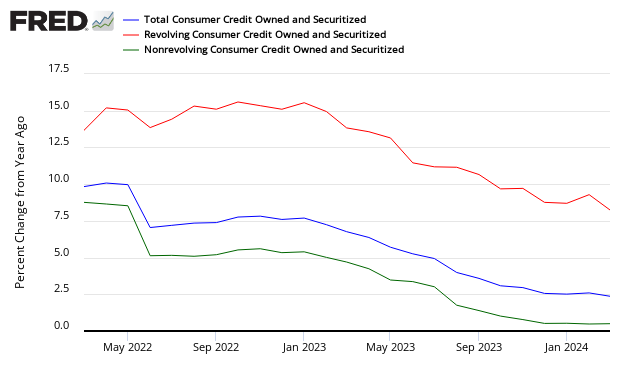
| September Consumer Credit | consumer credit growth rate has been slowing this year | The headlines say consumer credit rate of annual growth SIGNIFICANTLY slowed relative to last month. Our analysis of the unadjusted data shows annual growth decelerated. Student loan year-over-year growth rate continues to marginally slow whilst the non-student loan debt growth rate has changed very little. Year-over-Year Growth of Consumer Credit – Total (blue line), Revolving Credit (red line), and Non-Revolving (the green line which includes student loans)
|
| September Wholesale Trade | improved but inflation-adjusted data is in contraction | The headlines say wholesale sales unchanged month-over-month with inventory levels very elevated. Our analysis shows improvement in the rate of growth for the rolling averages. Overall, the rolling averages tell the real story – and they improved this month. This sector’s growth remains in a long term downtrend. The rolling averages are in expansion this month – but if one adjusts for inflation, this series is in contraction. Inventory levels this month remain at recessionary levels.
|
| Surveys | manufacturing surveys soft | October ISM and Markit Services Indices –The ISM non-manufacturing (aka ISM Services) index and the Markit PMI Services Index continued their growth cycle but show little growth.
Michigan Consumer Sentiment – The preliminary University of Michigan Consumer Sentiment for November came in at 95.7 – up from October’s 95.5, and up from September’s 93.2.
|
| Rail Movements | Definitely not positive news | Rail so far in 2019 has changed from a reflection of a strong economic engine to contraction. Currently, not only are the economic intuitive components of rail in contraction, but the year-to-date has slipped into contraction.
|


Links To All Of Our Analysis This Past Week
include(“/home/aleta/public_html/files/ad_openx.htm”); ?>


