Written by Steven Hansen
The biggest release this week were the employment numbers for October.

Please share this article – Go to the very top of the page, right-hand side, for social media icons
Highlights of our analysis:
- The year-over-year rate of growth for employment slowed this month (red line on the graph below). The year-over-year growth rate is below the rate of growth one year ago. This is a year-over-year analysis which has no seasonality issues.

- Economic intuitive sectors of employment mixed.
- This month’s report internals (comparing household to establishment data sets) weakly correlated with the household survey showing seasonally adjusted employment growing 241,000 vs the headline establishment number expanding 128,000. The point here is that part of the headlines are from the household survey (such as the unemployment rate) and part is from the establishment survey (job growth). From a survey control point of view – the common element is job growth – and if they do not match, your confidence in either survey is diminished. [note that the household survey includes ALL job growth, not just non-farm).
- The household survey added 325,000 people to the labor force – this means only 2/3rds of the increased workforce found a job.
- The National Federation of Independent Business (NFIB)’s monthly Jobs Report is at the end of this post.
Concentrating on the labor force growth Vs. employment growth – it should be noted that the trend lines have reversed. The labor force growth is now outpacing employment growth.

Still, employment growth will fluctuate but the USA economy is in a soft period where this trend should continue.
Economic Forecast
The Econintersect Economic Index (November 2019) forecast fell marginally again this month and continues to show the lowest level of growth since the economic slowdown in 2016. The continuing weakness of manufacturing, transport, and exports/imports continues to weigh on our economic forecast.
The fundamentals which lead job growth are now showing a significant slowing growth trend in the employment growth dynamics. We are currently predicting the jobs growth to be below the growth needed to maintain participation rates and the employment-population ratios at the current levels.

Economic Releases This Past Week
The following table summarizes the more significant economic releases this past week. For more detailed analysis – please visit our landing page which provides links to our complete analyses.
Overall this week:
employment growth soft this month due to General Motors strike
housing sector continues weak but remains on an improving trend line
transport weak and in contraction
manufacturing growth remains weak
construction spending remains in contraction
| Release | Potential Economic Impact | Comment |
|---|---|---|
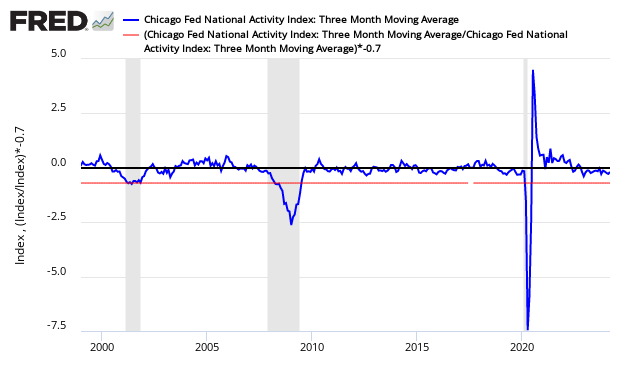
| September Chicago Fed National Activity Index | showing weak economic growth | The economy’s rate of growth declined based on the Chicago Fed National Activity Index (CFNAI) 3 month moving (3MA) average – and the economy is well below the historical trend rate of growth. The economy has slowed from its rate of growth in 2018. All components of the index are in negative territory this month.
|
| September Case Shiller Home Price Index | price growth slow | The non-seasonally adjusted S And P CoreLogic Case-Shiller home price index (20 cities) year-over-year rate of home price growth was unchanged at 2.0 %. The index authors stated, “Phoenix saw an increase in its YOY price change to 6.3% and retained its leading position.”.
|
September Pending Home Sales | home sales are trending up | The National Association of Realtors (NAR) seasonally adjusted pending home sales index improved. Our analysis shows the year-over-year rate of growth improved. The quote of the day from this NAR release:
|
| October ADP Employment | shows weak growth | ADP reported non-farm private jobs growth at 125,000 which was within expectations. A quote from the ADP authors:
This month the rate of ADPs private employment year-over-year growth is below the tight range seen over this year. The rolling average of the year-over-year rate of growth was the same as last month. Last month’s employment numbers were revised down.
|
| 3Q2019 GDP | weakness was consumer spending | The advance estimate for third-quarter 2019 Real Gross Domestic Product (GDP) is a positive 1.9 %. This growth is worse than the previous quarter’s 2.0 % if one looks at quarter-over-quarter headline growth. Year-over-year growth also declined. The main weakness this quarter was consumer spending which slowed over the previous quarter.
|
| FOMC Meeting Announcement | lowered federal funds rate | The Federal Open Market Committee (FOMC) – the board of directors of the Federal Reserve lowered the range of the federal funds rate by a quarter-point as expected, and stated:
|
| September Personal Income and Expenditures | spending not keeping up with income growth | The trend continues where income growth is outpacing consumption growth. Consumer income growth year-over-year is growing faster than the spending growth year-over-year. The savings growth rate improved and has remained in a narrow band in 2019. Real Disposable Personal Income is up 3.5 % year-over-year, and real consumption expenditures are up 2.6 % year-over-year.
|
| October BLS Employment | 325,000 people to the labor force and employment growth was only 128,000 | The headline seasonally adjusted BLS job growth was above expectations but soft reported due to the strike at General Motors. The establishment and household surveys correlated weakly. The labor force grew faster than job growth. Jobs growth in 2019 continues to be worse than any year since 2010. The trends clearly continue to show a slower growing employment picture. A summary from the report:
The economically intuitive sectors were mixed.
|
| September Construction Spending | remains deep in contraction | The headlines say construction improved month-over-month. Our analysis shows the rolling averages improved. The rolling averages improved. Also note that inflation is grabbing hold, and the inflation-adjusted numbers are deep in contraction.
|
| Surveys | manufacturing surveys soft | Dallas Fed National Activity Index – This survey declined but remains in positive territory year-over-year with subindices new orders declining (and now in contraction) and unfilled orders declining and remaining in contraction. The survey is at the lowest level seen in over 3 years. This should be considered a worse report than last month.
Conference Board Consumer Confidence – The latest Conference Board Consumer Confidence Index’s headline number now stands at 125.9 (1985=100), down from 126.3 in September.
Chicago Purchasing Managers Index – The Chicago Business Barometer fell 3.9 points to 43.2 in October, the lowest level since December 2015.
ISM and Markit Manufacturing Survey –The ISM Manufacturing survey improved but remains in contraction for the first time in three years. The key internals were in contraction. The Markit PMI manufacturing Index remained barely in positive territory and insignificantly improved.
|
| Rail Movements | Definitely not positive news | Rail so far in 2019 has changed from a reflection of a strong economic engine to contraction. Currently, not only are the economic intuitive components of rail in contraction, but the year-to-date has slipped into contraction.
|


Links To All Of Our Analysis This Past Week
include(“/home/aleta/public_html/files/ad_openx.htm”); ?>


