Written by Steven Hansen,
This August new home sales were well above expectations and continue at a pace which is better than any year since 2007.

Please share this article – Go to the very top of the page, right-hand side, for social media icons
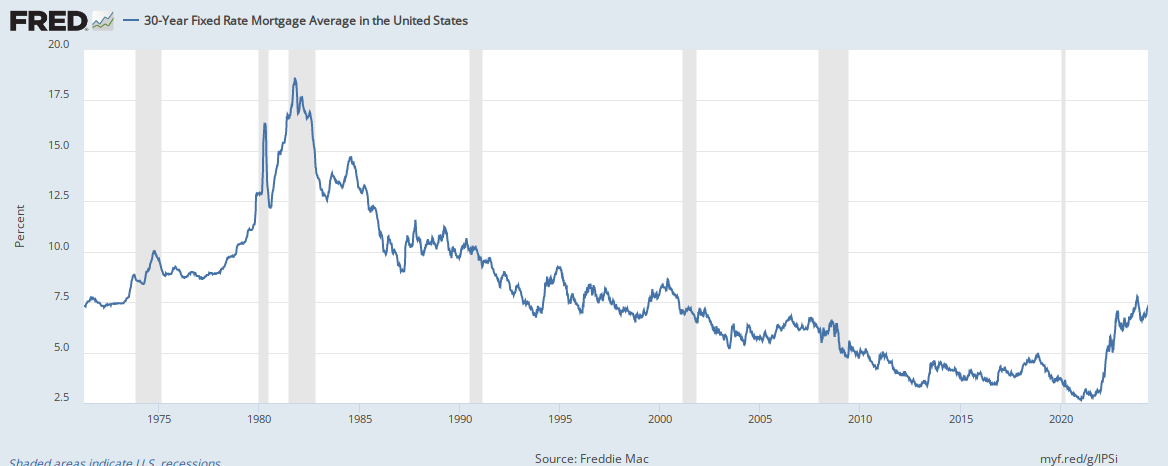
This is good news for the economy and is demonstrating that mortgages rates (which have been rolled back over the past year) are making homeownership more affordable even though home prices have been gently rising.
New home sales can be a recession flag. With the exception of the 2001 non-recession recession, new home sales declines for a year or more before a recession arrives.

There is NO single litmus test for a recession. The National Bureau of Economic Research (NBER) uses four – but in the 2007 recession, it took them one year after the recession started to make the determination. It is not prudent to look at a single indicator (say the inverted yield curve) and start screaming that the sky is falling. At this point in time, most trend lines are flat or improving (but still not good) – and I do not see any indication a recession is just over the horizon.
Economic Forecast
The Econintersect Economic Index has a long term decline which began in July 2018 – this month (September 2019) our forecast again marginally improved for the second month but continues to predict very little growth.
The fundamentals which lead jobs growth are now showing a significant slowing growth trend in the employment growth dynamics. We are currently predicting the jobs growth to be below the growth needed to maintain participation rates and the employment-population ratios at the current levels.

Economic Releases This Past Week
The following table summarizes the more significant economic releases this past week. For more detailed analysis – please visit our landing page which provides links to our complete analyses.
Overall this week:
manufacturing surveys in contraction
home price rate of growth continues to slow
new home sales improve with best year-to-date growth since 2007
transport sector weak
spending growing much slower than income growth
| Release | Potential Economic Impact | Comment |
|---|---|---|
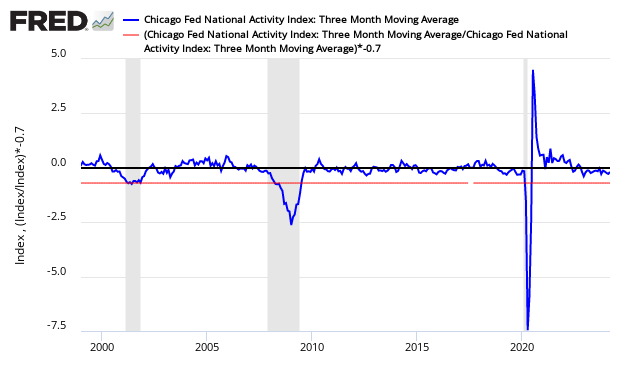
| August Chicago Fed National Activity Index | strengthening but soft | The economy’s rate of growth marginally accelerated based on the Chicago Fed National Activity Index (CFNAI) 3 month moving (3MA) average – but the economy remained below the historical trend rate of growth. Even with this improvement, the economy has slowed from its rate of growth in 2018. CFNAI Three Month Moving Average (blue line) with Historical Recession Line (red line)
|
July Case-Shiller Home Price Index | n/a | The non-seasonally adjusted S And P CoreLogic Case-Shiller home price index (20 cities) year-over-year rate of home price growth slowed from 2.1 % to 2.0 %. The index authors stated, “Home price gains remained positive in low single digits in most cities, and other fundamentals indicate renewed housing demand”. Dr. Ralph B. McLaughlin, deputy chief economist, and executive of research and insights for CoreLogic said:
|
| August Chemical Activity Barometer | no year-over-year growth | The Chemical Activity Barometer (CAB) was up 0.1 percent in September on a three-month moving average (3MMA) basis following a 0.1 percent decline in August and gains averaging 0.2 percent per month during the second quarter.
|
| August New Home Sales | n/a | The headlines say new home sales improved month-over-month. Median and average sales prices were significantly up. This month the backward revisions were upward. Because of weather and other factors, the rolling averages are the way to view this series. The rolling averages improved. New home sales growth in 2019 still exceeds every year since 2007.
|
| 2Q2019 GDP | n/a | The third estimate of first-quarter 2019 Real Gross Domestic Product (GDP) was 2.0 % (unchanged from the second estimate). The star of this quarter was consumer spending which dramatically increased over the previous quarter. I am not a fan of quarter-over-quarter exaggerated method of measuring GDP – but my year-over-year preferred method showed a moderate deceleration from last quarter. Real GDP Expressed As Year-over-Year Change
|
| August Trucking | mixed | Headline data for the American Trucking Association (ATA) tonnage declined but remains in expansion whilst the CASS Freight Index reported the year-over-year growth rate continues in contraction. The CASS index is inclusive of rail, truck, and air shipments. The ATA truck index is inclusive of only member movements. I tend to put a heavier weight on the CASS index which continued in contraction year-over-year. On the other hand, the ATA index is in an uptrend. The ATA index remains an outlier on the positive side – and is contrary to almost every economic data point. Econintersect tries to validate truck data across data sources. It appears this month that truck employment rate of growth continues to slow.
|
| 2Q2019 Joe Sixpack Index | mixed | The Federal Reserve data release (Z.1 Flow of Funds) – which provides insight into the finances of the average household – showed improvement in average household net worth. Our modeled “Joe Sixpack” – who owns a house and has a job, and essentially no other asset – appears slightly worse off than he was last quarter. But Middle Man (an upper-middle-class person) should feel better off.
|
| August Pending Home Sales | n/a | The National Association of Realtors (NAR) seasonally adjusted pending home sales index improved. Our analysis shows the year-over-year rate of growth improved. The quote of the day from this NAR release:
For the unadjusted data, the 3-month rolling averages remain in negative territory and the year-over-year growth for August remained in positive territory. The data is very noisy and must be averaged to make sense of the situation. Shorter-term trends are now improving. Note that the long-term downward trend of home sales began in mid-2015.
|
| August Durable Goods | in contraction | The headlines say the durable goods new orders improved. Our analysis shows the rolling averages declined with this sector in contraction. The rate of growth of the rolling averages is below the values seen over the last year. Note that inflation-adjusted new orders year-over-year returned to contraction. Year-over-Year Change of 3 Month Rolling Average – Unadjusted (blue line) and Inflation Adjusted (red line)
|
| August Personal Income and Outlays | spending soft | The trend continues where income growth is outpacing consumption growth. Consumer income growth year-over-year is now higher than the spending growth year-over-year. Real Disposable Personal Income is up 3.0 % year-over-year, and real consumption expenditures are up 2.3 % year-over-year. The savings growth rate improved and has remained in a narrow band in 2019. The real issue with personal income and expenditures is that it jumps around because of backward revisions – and one cannot take any single month as fixed or gospel. Indexed to Jan 2000, Growth of Real Disposable Income (blue line) to Real Expenditures (red line)
|
| Surveys | manufacturing surveys in contraction / consumer confidence remains in the range seen in the last 2 years | Conference Board Consumer Confidence – The latest Conference Board Consumer Confidence Index’s headline number now stands at 125.1 (1985=100), down from 134.2 in August.
Richmond Fed Manufacturing Index – The actual survey value was -9 [note that values above zero represent expansion]. The important Richmond Fed subcategories (new orders and unfilled orders) declined with both now in contraction. This survey was much worse than last month.
Kansas City Manufacturing Index – Kansas City Fed manufacturing has been one of the more stable districts and their index even though below the range seen in the last 12 months. Note that the key internals were in contraction. This should be considered the same as last month.
Michigan Consumer Confidence – The final University of Michigan Consumer Sentiment for September came in at 93.2 – up from the preliminary of 92.0, and up from August’s 89.8.
|
| Rail Movements | Definitely not positive news | Rail so far in 2019 has changed from a reflection of a strong economic engine to contraction. Currently, not only are the economic intuitive components of rail in contraction, but the year-to-date has slipped into contraction.
|


Links To All Of Our Analysis This Past Week
include(“/home/aleta/public_html/files/ad_openx.htm”); ?>


