Written by Steven Hansen,
This past week, the Bureau of Labor Statistics (BLS) released productivity and costs for 2Q2019. The bottom line was that the year-over-year productivity growth slowed.

Please share this article – Go to the very top of the page, right-hand side, for social media icons
My view of productivity is very different from the headline view. Productivity calculations are complicated – far too complicated for economists to come to a conclusion satisfactory to this simple Industrial Engineer:
Generally speaking, productivity is, in industrial engineering, defined as the relation of output (i.e. produced goods) to input (i.e. consumed resources) in the manufacturing transformation process.
Productivity assessments, even within a single company, are very complicated. When one goes beyond the individual company, they are impossible to accurately forecast when discussing an entire sector or economy. Industrial engineers do not use costs as a component to determine productivity. Industrial Engineers count processes and manhours – and are able to isolate improvements as elements change. So to generalize about sectors, economists have to make too many assumptions which not only make the calculations inaccurate – but their productivity conclusions jump around like a Mexican Jumping Bean.
A Better View Of Productivity
There are some rough tools which will get one into the ballpark of productivity improvement. These are monetary-based views, and likely are correct only in trends (but not in calculating an exact productivity change).
The following graphs on manufacturing, investment, retail trade, and health care are comparing inflation-adjusted growth of that sector to employment growth in that sector – as well as for the economy overall.
Economy Overall
In the case of the economy overall, for the last two years – it appears output (blue line) is now growing faster than employment.

The problem with this analysis is that it is a gross generalization – but it does estimate that we are looking for a positive productivity increase in the last year.
Manufacturing
In the case of manufacturing, output (blue line) is now growing slower than employment.
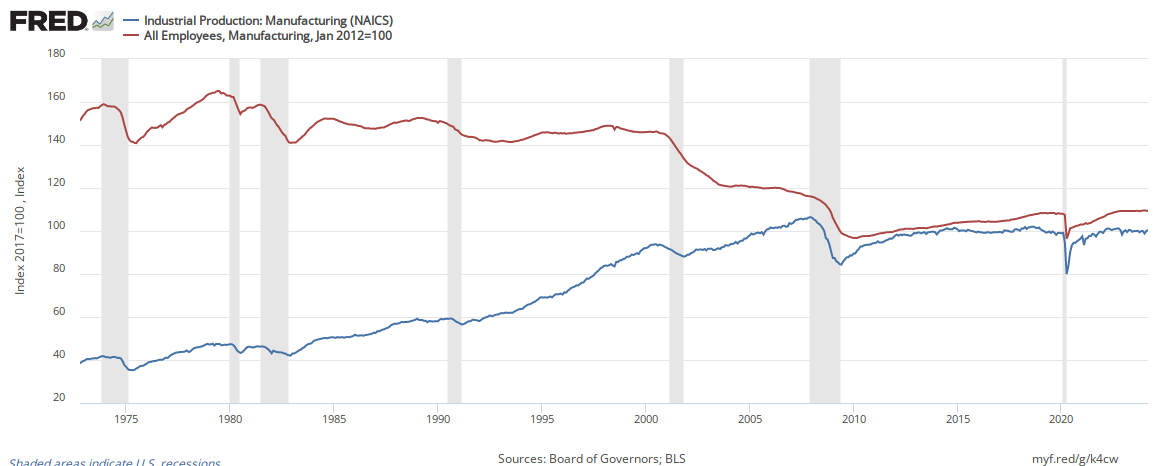
It should come as no surprise that manufacturing’s productivity is contracting.
Construction
Since 2012, construction output and employment are also growing at nearly the same rate implying there is little productivity growth.

Services
The only significant productivity growth I can find is in the services sector.
Beginning with the retail sector, the obvious gain in productivity is seen throughout the graph below and continues today.

There also is an improvement in the health care sector.

Another Alternate View Of Productivity Removing Transfer Payments
Another way of looking at productivity is the year-over-year rate of growth of GDP normalized to employed population – red line) vs. GDP per capita (blue line). This metric is partially showing how well businesses are utilizing the labor force – and in a rough way looks at productivity growth if one eliminated government transfer payments from GDP. (see red line in the graph below):

The red line in the above graph suggests there is little overall productivity growth.
Overall Conclusion On Productivity
If you want to be entertained with a diatribe on productivity – Yves Smith carved up this subject well looking at it from an entirely different angle. In economics and life, a little knowledge [on a subject] is a dangerous thing.
This proverb ‘A Little Knowledge Is A Dangerous Thing’ means a person is sharing his views with others and doesn’t have enough knowledge of a particular subject, especially medical, religion, or education field, it can lead to dangerous situations. People with limited experience can often mislead people. Innocent people or people with a lack of information may easily believe the person pretending to know everything because most of the time, they are very convincing. A person with a little information and knowledge can also become a cause of suffering and even death due to their overconfidence.
The problem really is that economists seem to only understand money flows – and they use money to measure productivity. Productivity is an extremely nuanced calculation which is never totally accurate as there are shifting technology and/or methods. The core of industrial engineering productivity is a measure of labor hours for a specific task Vs. the output of those labor hours – and that detailed data is not available to anyone outside of a company.
The economist’s methodology of measuring productivity overstates productivity when outsourcing is increasing and understates productivity when outsourced production is returned.
Economic Forecast
[Note: The year-over-year real GDP was revised in the 2Q2019 advance estimate GDP trend lines are now more in align with our forecasts]The Econintersect Economic Index has a long term decline which began in July 2018 – this month (August 2019) our forecast marginally improved but continues to predict very little growth.
The fundamentals which lead jobs growth are now showing a slowing growth trend in the employment growth dynamics. However, we expect jobs growth over the next six months to exceed the growth needed to maintain participation rates and the employment-population ratios at the current levels.

Economic Releases This Past Week
The following table summarizes the more significant economic releases this past week. For more detailed analysis – please visit our landing page which provides links to our complete analyses.
Overall this week:
consumer confidence declined
manufacturing remained soft
but the outlier this week was retail sales which significantly improved. some pundits attribute this to Amazon Prime
| Release | Potential Economic Impact | Comment |
|---|---|---|
July Consumer Price Index | historically there is no correlation between inflation and economic growth | According to the BLS, the Consumer Price Index (CPI-U) year-over-year inflation rate was 1.8 % year-over-year (higher than the reported 1.6 % last month). The year-over-year core inflation (excludes energy and food) rate grew from 2.1 % to 2.2 % and is above the target set by the Federal Reserve. Energy was the main reason for inflation growth. Medical care services cost inflation rose from 2.8 % to 3.3 % year-over-year.
|
| July Sea Container Counts | growth remains in contraction | The July year-to-date import/export container count growth rate remains in contraction. Simply looking at this month versus last month – there were only marginal changes to weak numbers. The year-over-year rate of growth improved for imports and slowed for exports. The three-month rolling averages for exports and imports are also in contraction. Imports container counts give an indication of the U.S. economy’s state and the soft data continues to indicate a weak U.S. economy. Exports are saying the global economy is weak as well. Container data is consistent with other transport data indicating a weak economy.
|
| July Import and Export Price Index | n/a | Import prices worsened from -2.0 % to -1.8 % whilst export pricing worsened from -1.6 % to -0.9 % – and both imports and exports remain in contraction. Import Oil prices were up 1.8 % month-over-month, and export agricultural prices were up 0.4 %.​
|
| July Retail Sales | strong data | Retail sales improved according to US Census headline data. The three-month rolling average declined. There was a downward adjustment of last month’s data. Although the unadjusted data declined this month, the real test of strength is the rolling averages which declined. This should be considered a strong report for July. Please consider that this data is not adjusted for inflation. There is a contraction of employment in this sector.
|
| 2Q2019 Preliminary Productivity and Costs | rate of productivity growth slowed | A simple summary of the headlines for this release is that productivity growth slowed and labor cost growth was completely revised UPWARD and is now growing faster than productivity. The overall view this quarter is that productivity is up 1.8 % from the same quarter one year ago (last quarter productivity was up a revised 2.3 %), while unit costs are up 2.5 % (last quarter labor costs were up a revised 2.4 %). Consider that GDP per capita is NOT growing year-over-year if one eliminates transfer payments. This down and dirty view suggest there is little productivity growth.
|
| July Industrial Production | continues to show weak growth | The headlines say seasonally adjusted Industrial Production (IP) was declined month-over-month. Our analysis shows the three-month rolling average declined. There was generally downward revision to the last 6 months of data. The best way to view this is the 3-month rolling averages which declined. Industrial production remains in a downtrend. Note that manufacturing is barely in expansion year-over-year – and capacity utilization is contracting year-over-year. IP headline index has three parts – manufacturing, mining and utilities – manufacturing was down 0.4 % this month (contracting 0.5 % year-over-year), mining down 1.8 % (up 5.5 % year-over-year), and utilities were up 3.1 % (up 0.3 % year-over-year). Note that utilities are 10.4 % of the industrial production index, whilst mining is 14.6 %.
|
| June Business Sales and Inventories | the entire business sector is in contraction | Headlines say final business sales data (retail plus wholesale plus manufacturing) improved month-over-month. However, the rolling averages declined. Inventories remain very elevated. Inventories remain at recessionary levels. Our primary monitoring tool – the 3-month rolling averages for sales – declined. As the monthly data has significant variation, the 3-month averages are the way to view this series. Overall business sales are better than the low point in 2015 – but is well below average for the values seen in the last 2 years. Note that inflation-adjusted sales are in contraction.
|
| July Residential Building | improved growth but little year-over-year growth | The headline residential building permits and construction completions improved relative to last month. The three-month rolling average shows little year-over-year growth. The backward revisions this month were slight. It is always difficult to understand the trends as the backward revisions sometimes reverse trends month-to-month. The nature of this industry normally has large variations from month-to-month (mostly due to weather) so the rolling averages are the best way to view this series. In summary, the rolling averages say this sector improved this month. We consider this report much better than last month.
|
| Surveys | most surveys show weak growth | NFIB Small Business Optimism – Optimism among small business owners bounced back in July as expectations for business conditions, real sales, and expansion made solid gains. The NFIB Small Business Optimism Index rose 1.4 points to 104.7, with seven of 10 components advancing, two falling, and one remaining unchanged. Said NFIB Chief Economist Bill Dunkelberg:
Philly Fed Manufacturing Survey – The Philly Fed Business Outlook Survey declined but remains in expansion. Key elements improved. Although the survey index declined, the key elements improved. Overall, this is a stronger report than last month.
New York Fed Manufacturing Survey – The Empire State Manufacturing Survey index marginally improved is in expansion. Overall this survey remains below values seen in the last 2+ years. The report is similar to last month but key elements are mixed.
Michigan Consumer Sentiment – The preliminary University of Michigan Consumer Sentiment for August came in at 92.1 – down from July final of 98.4, and down from the June final of 98.2.
|
| Rail Movements | Definitely not positive news | Rail so far in 2019 has changed from a reflection of a strong economic engine to contraction. Currently, not only are the economic intuitive components of rail in contraction, but the year-to-date has slipped into contraction.
|


Links To All Of Our Analysis This Past Week
include(“/home/aleta/public_html/files/ad_openx.htm”); ?>


