
Written by Steven Hansen,
What motivated me to analyze and provide commentary on economic releases were the constant and continuous misrepresentation of data by the market pumpers. I tend to be perceived as more negative than others in my analysis as I am not looking only for bright spots in the data. Generally what I continue to see is soft data across the board. The residential home sales sector has soft data also, but I am witnessing a possible trend shift toward improvement.

Please share this article – Go to the very top of the page, right-hand side, for social media icons
Existing-Home Sales
Existing home sales this week headlined “Existing-Home Sales Falter 1.7% in June“. Yes, the numbers this month sucked if one wants to analyze the data for only one month. Our analysis was much more brutal than the National Association of Realtors in looking at the same data.
- Sales down 1,7 % month-over-month, down 2.2 % year-over-year
- Prices up 4.3 % year-over-year
- The market (from Econoday) expected annualized sales volumes of 5.150 M to 5.450 M (consensus 5.340 million) vs the 5.27 million reported.
Our analysis:
- The unadjusted sales rate of growth decelerated 8,8 % month-over-month, down 7.5 % year-over-year – sales growth rate trend improved using the 3-month moving average.
- The unadjusted price rate of growth decelerated 0.5 % month-over-month, up 3.1 % year-over-year
- The homes for sale unadjusted inventory grew this month compared to last month, but remains historically low for Junes, and is unchanged from inventory levels one year ago).
Note the bold text in our analysis. Growth is never constant, so one must average data to understand trends – and existing home sales, even though in contraction, has been “less bad” for the last five months. The red line in the graph below shows the three-month rolling average of unadjusted existing home sales.

New Home Sales
New home sales declined this month – and the three-month rolling average also declined. Normally, I would say this sector is slowing but there are extenuating circumstances in this case:
- Even with the decline this month, growth in 2019 still exceeds every year since 2007.

- median prices have been declining since January 2018. My interpretation is that builders are adjusting home sizes and costs for the New Normal generational differences.

Summary of Residential Sales
It is possible that the data next month shows a different conclusion. There are forces which can tip the scales in any direction. The U.S. Census Bureau issued its Residential Vacancies & Homeownership report this past week which shows that the homeownership rates are remaining flat. Dr. Ralph B. McLaughlin, deputy chief economist, and executive of research and insights for CoreLogic said:
The growth in the homeownership rate has flattened because renters are growing at similar rates as owners. This dual-sided growth in household formation is a surely welcomed trend by industry players in both the owner- and renter-occupied segments of the U.S. housing market. It’s a core sign of a healthy market, and one that doesn’t show any signs of relenting in the near future.

Economic Forecast
[Note: The year-over-year real GDP was revised in the 2Q2019 advance estimate released this week. GDP trend lines are now more in align with our forecasts]The Econintersect Economic Index has a long term decline which began in July 2018 – and continued this month (July 2019). Our forecast is approaching closer to the zero growth line. There currently is a disconnect between GDP and the Econintersect Economic Index. Because inventories rise and trade falls going into economic slowdowns [which increases GDP] – one can suggest that GDP is a lagging indicator to the underlying economy.
The fundamentals which lead jobs growth are now showing a slowing growth trend in the employment growth dynamics. However, we expect jobs growth over the next six months to exceed the growth needed to maintain participation rates and the employment-population ratios at the current levels.

Economic Releases This Past Week
The following table summarizes the more significant economic releases this past week. For more detailed analysis – please visit our landing page which provides links to our complete analyses.
| Release | Potential Economic Impact | Comment |
|---|---|---|
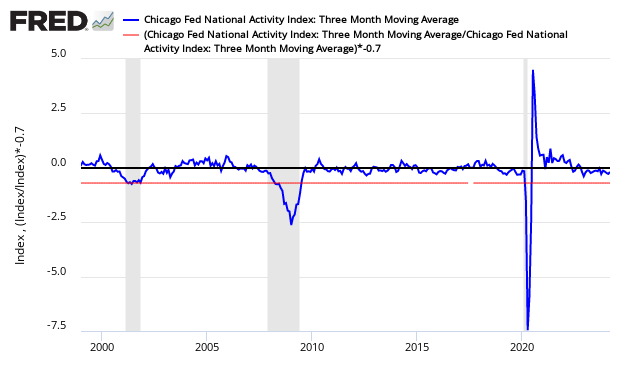
June Chicago Fed National Activity Index | rate of growth slow but unchanged | The economy’s rate of growth marginally accelerated based on the Chicago Fed National Activity Index (CFNAI) 3 month moving (3MA) average – but the economy remained below the historical trend rate of growth. Even with this improvement, the economy has slowed from its rate of growth in 2018.
|
| June Existing Home Sales | n/a | The headline existing home sales declined relative to last month with the authors saying “the nation is in the midst of a housing shortage and much more inventory is needed. Imbalance persists for mid-to-lower priced homes with solid demand and insufficient supply, which is consequently pushing up home prices”. The rolling averages for existing home sales have been improving for the last 5 months – and also improved this month. This month the rolling averages remained in contraction. Housing inventory is historically low for Mays.
|
| June Chemical Activity Barometer | now in contraction | The Chemical Activity Barometer (CAB) eased 0.2 percent in July on a three-month moving average (3MMA) basis following three months of gains in March-May and weak months in the winter. On a year-over-year (Y/Y) basis, the barometer fell 0.2 percent (3MMA). The unadjusted measure of the CAB rose 0.2 percent in July and fell 0.4 percent in June. The diffusion index rose to 65 percent in July. The diffusion index marks the number of positive contributors relative to the total number of indicators monitored. The CAB reading for June was revised downward by 0.39 points and that for May by 0.09 points.
|
| June New Home Sales | slow growth | The headlines say new home sales improved month-over-month. Median and average sales prices were little changed. This month the backward revisions were downward. Because of weather and other factors, the rolling averages are the way to view this series. The rolling averages declined. Even with the decline this month, growth in 2019 still exceeds every year since 2007.
|
| June Durable Goods | is the glass half-full or half-empty? | The headlines say the durable goods new orders improved. Our analysis shows the rolling averages continued its decline. In the adjusted data, the major strength was civilian aircraft. This series has wide swings monthly so our primary metric is the unadjusted three-month rolling average – which declined. The rate of growth of the rolling averages is below the values seen over the last year. Note that year-to-date new order growth is now 0.0 % over 2018. Unfilled order year-to-date growth is -0.5 %.
|
| 2Q2019 GDP | indicates a slowing economy | The advance estimate for second-quarter 2019 Real Gross Domestic Product (GDP) is a positive 2.1 %. This growth is worse than the previous quarter’s 3.1 % if one looks at quarter-over-quarter headline growth. Year-over-year growth also declined. The star of this quarter was consumer spending which dramatically increased over the previous quarter. Headline GDP is calculated by annualizing one quarter’s data against the previous quarter’s data. A better method would be to look at growth compared to the same quarter one year ago. For 2Q2019, the year-over-year growth is now 2.3 % – down from 1Q2019’s 2.7 % year-over-year. So one might say that the rate of GDP growth decelerated by 0.4 % from the previous quarter. Real GDP Expressed As Year-over-Year Change
|
| Surveys | worsening manufacturing surveys | Richmond Fed Manufacturing – This survey is now in contraction. The important Richmond Fed subcategories (new orders and unfilled orders) declined and are in contraction. This survey was much weaker than last month.
Kansas City Manufacturing – Of the four regional manufacturing surveys released for July, two were in expansion and two were in contraction. Kansas City Fed manufacturing has been one of the more stable districts and their index even though below the range seen in the last 12 months. Note that the key internals were in contraction. This should be considered a marginally worse report than last month.
|
| Rail Counts | Definitely not positive news | Rail so far in 2019 has changed from a reflection of a strong economic engine to contraction. Currently, not only are the economic intuitive components of rail in contraction, but the year-to-date has slipped into contraction.
|


Links To All Of Our Analysis This Past Week
include(“/home/aleta/public_html/files/ad_openx.htm”); ?>


