Written by Steven Hansen,
Durable goods slipped into contraction year-over-year. Should this be considered a recession flag?

Please share this article – Go to the very top of the page, right-hand side, for social media icons
We all know Boeing’s issues with the 737 MAX. This has helped to depress durable goods sales, as Boeing’s commercial aircraft contribute around 5% to durable goods sales. Few are lining up to buy 737 MAX’s until its issues are resolved – and it is likely there is some contagion to other Boeing products. But the contraction of durable goods sales cannot be laid solely at the feet of Boeing.
To visualize the drivers of durable goods – the chart below shows transport (mostly aircraft is the volatile element in durable goods).
Unadjusted Durable Goods New Orders Year-over-Year Growth – Consumer Goods less transport (blue line), All Durable Goods (green line), and Transport (red line)

The blue line in the graph shows durable goods sales to consumers (ignores the transport sector). And for the last year, the rate of growth for consumer durable goods have been slowing.
However, a rapid decline in the rate of growth for durable goods sales is not a recession flag – as it happens often without a recession occurring.
The biggest tail on this dog is that the rate of growth of inventories for durable goods has remained constant.
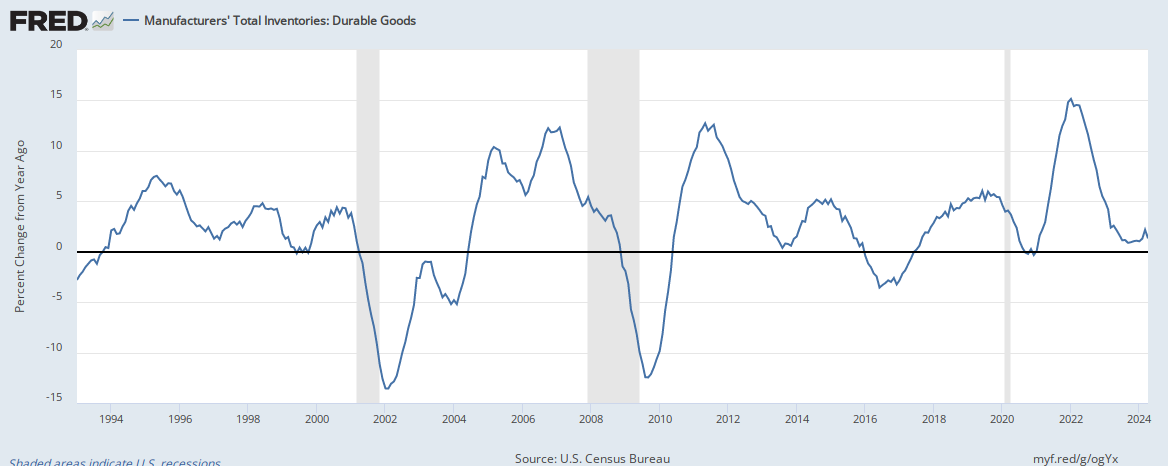
Recessions historically do not happen unless the rate of growth for durable goods inventories is falling. This may be counterintuitive but it is what it is.
Economic Forecast
The Econintersect Economic Index for June 2019 long term decline began in July 2018 – and continued this month. This forecast flies in the face of the continuing improvement trend of Real GDP. There currently is a disconnect between GDP and the Econintersect Economic Index. Part of the reason is that GDP adjusts for trade, and we believe imports are an essential element of economic activity on Main Street. Further, GDP believes economic activity includes inventory, whilst Econintersect ignores inventory. If imports and inventory were ignored – GDP growth would have been less than half of the headline number.

Economic Releases This Past Week
The following table summarizes the more significant economic releases this past week. For more detailed analysis – please visit our landing page which provides links to our complete analyses.
| Release | Potential Economic Impact | Comment |
|---|---|---|
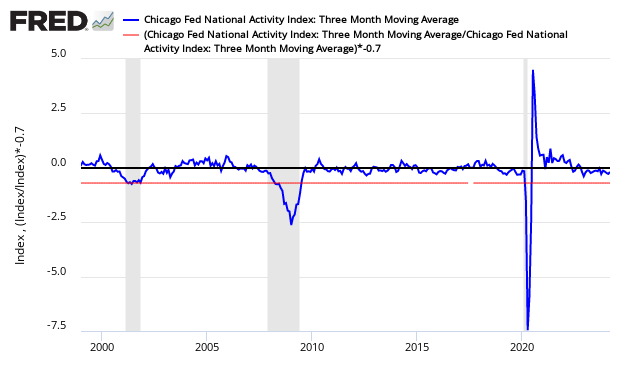
| May Chicago Fed National Activity Index | weak but improving growth | The economy’s rate of growth accelerated based on the Chicago Fed National Activity Index (CFNAI) 3 month moving (3MA) average – but the economy remained below the historical trend rate of growth. Even with this improvement, the economy has slowed from its rate of growth in 2018. The previous months’ data were revised down. CFNAI Three Month Moving Average (blue line) with Historical Recession Line (red line)
|
| April Case-Shiller Home Price Index | n/a | The non-seasonally adjusted S and P CoreLogic Case-Shiller home price index (20 cities) year-over-year rate of home price growth slowed from 2.7 % to 2.5 %. The index authors stated, “ the national supply of housing is trending upward and suggesting weaker demand”. The continued slowing of the year-over-year growth rate is good news for the economy. Note that the NAR’s existing home prices are trending up – the exact opposite of Case-Shiller.
|
| May New Home Sales | unexpected decline as growth had been improving | The headlines say new home sales declined month-over-month. Median and average sales prices significantly declined. This month the backward revisions were mixed. Because of weather and other factors, the rolling averages are the way to view this series. The rolling averages declined. Even with the decline this month, growth in 2019 still exceeds every year since 2007. Unadjusted New Home Sales Monthly Volumes In Thousands
|
| May Durable Goods | slowing economy | The headlines say the durable goods new orders declined. Our analysis shows the rolling averages continued its decline. In the adjusted data, the major weakness was civilian aircraft. This series has wide swings monthly so our primary metric is the unadjusted three-month rolling average – which declined. The rate of growth of the rolling averages is below the values seen over the last year. Note that inflation-adjusted new orders are deep in contraction.
|
| 1Q2019 GDP 3rd Estimate | on surface strong growth | The third estimate of first-quarter 2019 Real Gross Domestic Product (GDP) was 3.1 % (unchanged from the second estimate). The surprise this release was the lowering of consumer credit and the increase in fixed investment. We have been saying all along that consumer spending is declining (the opposite of what the Federal Reserve is saying). 3.1% is broken down as follows:
Real GDP Expressed As Year-over-Year Change
|
| June Chemical Activity Barometer | slow growth | The Chemical Activity Barometer (CAB) was flat (0.0 percent change) in June on a three-month moving average (3MMA) basis, following three monthly gains. On a year-over-year (Y/Y) basis, the barometer is up 0.3 percent (3MMA). The diffusion index rose to 65 percent in June. The diffusion index marks the number of positive contributors relative to the total number of indicators monitored. The CAB reading for May was revised downward by 0.38 points and that for April by 0.22 points.
|
| May Pending Home Sales | n/a | The National Association of Realtors (NAR) seasonally adjusted pending home sales index remains in contraction but improved. Our analysis shows the year-over-year rate of growth marginally declined. The quote of the day from this NAR release:
For the unadjusted data, the 3-month rolling averages remain in negative territory and the year-over-year growth for May was also in negative territory. The data is very noisy and must be averaged to make sense of the situation. Shorter term trends are now improving. Note that the long-term downward trend of home sales began in mid-2015.
|
| May Personal Income and Outlays | spending slowing | The headline data shows a marginal improvement in year-over-year growth for income and a marginal decline in expenditures. Consumer income growth year-over-year is now much less than the spending growth year-over-year. For sustained growth of expenditures, income needs to grow at nearly the same rate. The savings growth rate was relatively unchanged. Seasonally and Inflation Adjusted Year-over-Year Change of Personal Consumption Expenditures (blue line) to GDP (red line)
|
| Surveys | most surveys this week declined | Dallas Fed Manufacturing Survey – This survey remains in positive territory year-over-year with subindices new orders increasing (and in expansion) and unfilled orders also increasing and now in expansion. This should be considered a better report than last month.
Conference Board Consumer Confidence – The latest Conference Board Consumer Confidence Index’s headline number is 121.5 (1985=100), down from 131.3 in May. Consumer confidence had been on a multi-year upswing. The current volatility is showing uncertainty by consumers. Bottom line is that consumer confidence currently is eroding. Richmond Fed Manufacturing Index – This index marginally declined but remained in contraction. The important Richmond Fed subcategories (new orders and unfilled orders) improved but showed little growth or in contraction. This survey was about the same as last month.
Kansas City Fed Manufacturing Index – Of the five regional manufacturing surveys released for June, three were in expansion, one in contraction, and the Kansas Fed index at zero. Kansas City Fed manufacturing has been one of the more stable districts and their index even though below the range seen in the last 12 months. Note that the key internals was mixed with new orders in expansion and backlog in contraction. This should be considered a marginally worse report than last month.
Chicago Purchasing Managers Survey – The Chicago Business Barometer decreased by 4.5 points to 49.7 in June from 54.2 in May. The Fed manufacturing surveys were little changed or decreased this month – and Chicago ISM and one other Fed Survey were in contraction.
Michigan Consumer Sentiment – The final University of Michigan Consumer Sentiment for June came in at 98.2-, up from the preliminary of 97.9, down from the May final of 100.0, and up from the April final of 97.2.
|
| Weekly Rail Counts | Definitely not positive news | Rail so far in 2019 has changed from a reflection of a strong economic engine to contraction. Currently, not only are the economic intuitive components of rail in contraction, but the year-to-date has slipped into contraction.
|


Links To All Of Our Analysis This Past Week
include(“/home/aleta/public_html/files/ad_openx.htm”); ?>


